. 2024 May 16;10(5):356.
doi: 10.3390/jof10050356.

Evaluation of Cordyceps sinensis Quality in 15 Production Areas Using Metabolomics and the Membership Function Method

Affiliations

Evaluation of Cordyceps sinensis Quality in 15 Production Areas Using Metabolomics and the Membership Function Method

Tao Wang et al. J Fungi (Basel). .

Abstract

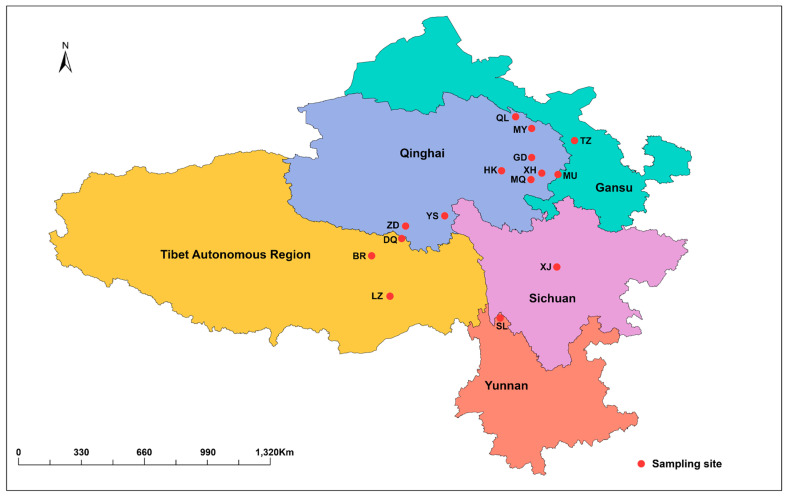
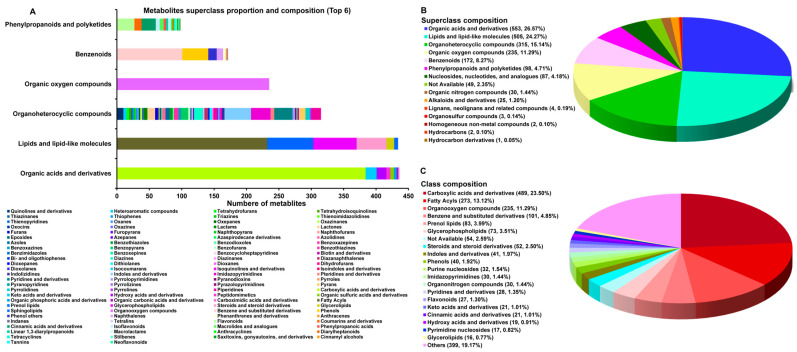
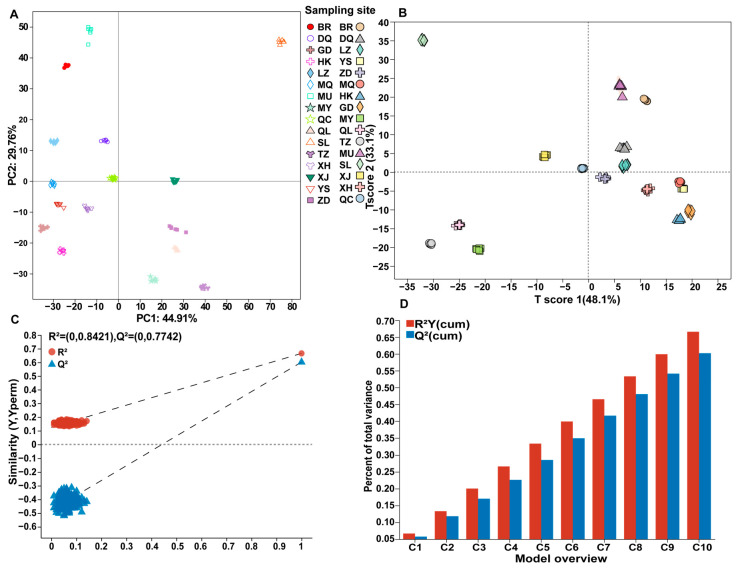
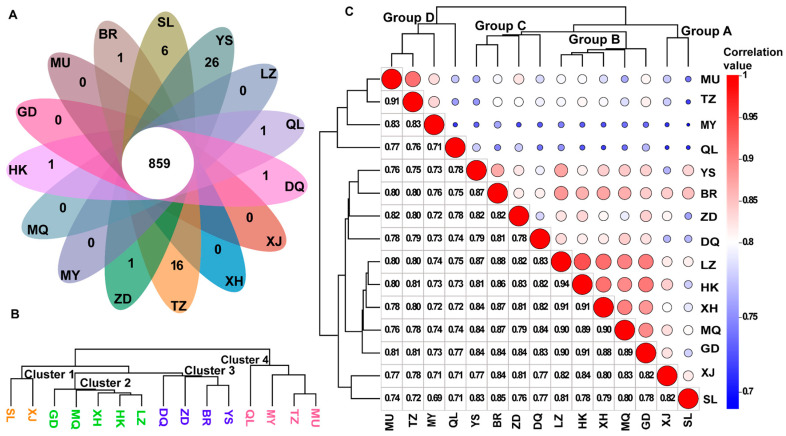
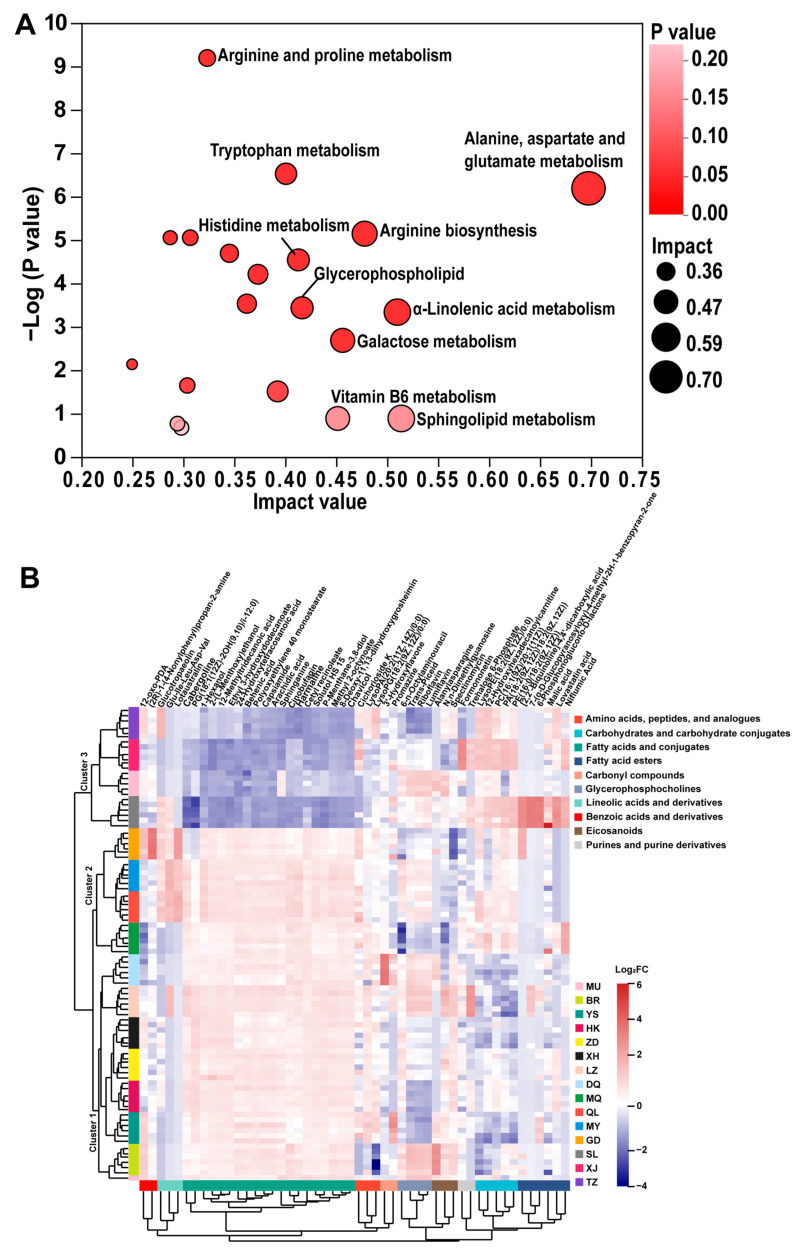
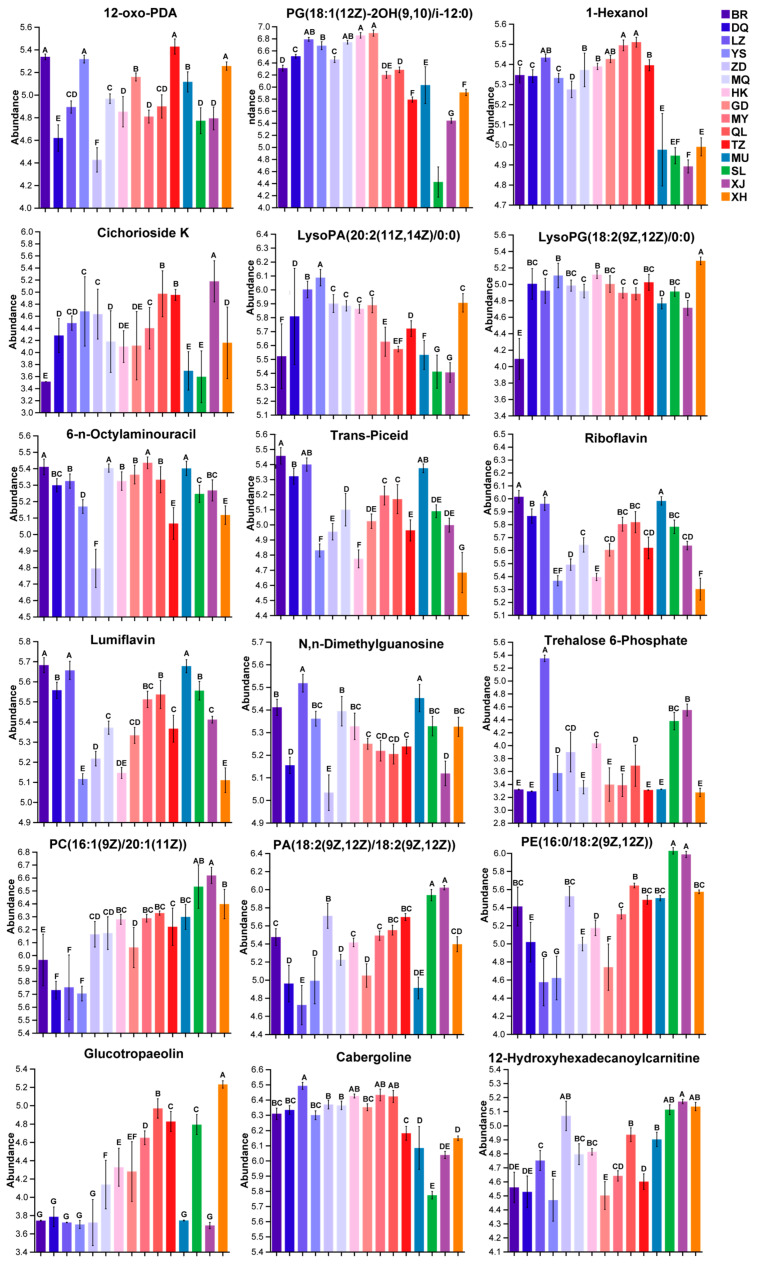
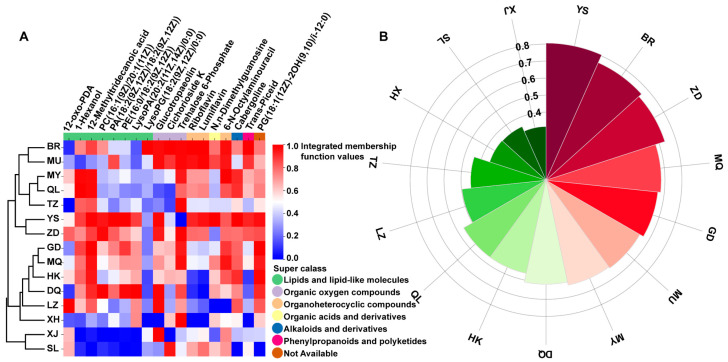
Cordyceps sinensis is a precious medicinal and edible fungus, which is widely used in body health care and disease prevention. The current research focuses on the comparison of metabolite characteristics between a small number of samples and lacks a comprehensive evaluation of the quality of C. sinensis in a large-scale space. In this study, LC-MS/MS, principal component analysis (PCA), hierarchical cluster analysis (HCA), and the membership function method were used to comprehensively evaluate the characteristics and quality of metabolites in 15 main producing areas of C. sinensis in China. The results showed that a total of 130 categories, 14 supercategories, and 1718 metabolites were identified. Carboxylic acids and derivatives, fatty acyls, organo-oxygen compounds, benzene and substituted derivatives, prenol lipids, and glycerophospholipids were the main components of C. sinensis. The HCA analysis and KEGG pathway enrichment analysis of 559 differentially accumulated metabolites (DAMs) showed that the accumulation models of fatty acids and conjugates and carbohydrates and carbohydrate conjugates in glycerophospholipid metabolism and arginine and proline metabolism may be one of the reasons for the quality differences in C. sinensis in different producing areas. In addition, a total of 18 biomarkers were identified and validated, which had a significant discrimination effect on the samples (p < 0.05). Overall, YS, BR, and ZD, with the highest membership function values, are rich and balanced in nutrients. They are excellent raw materials for the development of functional foods and provide scientific guidance for consumers to nourish health care.

Keywords: Cordyceps sinensis; biomarkers; metabolomics; quality evaluation.


Conflict of interest statement

The authors declare no conflicts of interest.

Figures

Figure 1
Figure 1
Sample distribution of C. sinensis from 15 producing areas. BR is Biru County in the TAR; DQ is Dingqing County in the TAR; LZ is Linzhi County in the TAR; ZD is Zaduo County in the Qinghai province; YS is the Yushu Tibetan Autonomous Prefecture in the Qinghai province; HK is Xinghai Country in the Qinghai province; MQ is Maqin County in the Qinghai province; XH is Xunhua County in the Qinghai province; GD is Guide County in the Qinghai province; MY is Menyuan County in the Qinghai province; QL is Qilian County in the Qinghai province; TZ is Tianzhu County in the Gansu province; MQ is Maqu County in the Gansu province; XJ is Xiaojin County in the Sichuan province; and SL is Shangri-La city in the Yunnan province.
Figure 2
Figure 2
Composition of metabolites of C. sinensis from 15 producing areas: (A) the percentage histogram of the top 6 superclasses; (B) the pie chart of the superclasses; and (C) the pie chart of the classes.
Figure 3
Figure 3
Multivariate statistical analysis of metabolites of C. sinensis from 15 producing areas: (A) PCA analysis score map; (B) PLS-DA model score map; (C) PLS-DA model validation map; and (D) PLS-DA principal component number selection map.
Figure 4
Figure 4
The relationship among the samples of C. sinensis from 15 producing areas: (A) Venn diagram; (B) sample-clustering diagram; and (C) sample correlation diagram.
Figure 5
Figure 5
Comprehensive analysis of DAMs: (A) enrichment analysis of KEGG topology analysis of DAMs in C. sinensis from 15 producing areas; and (B) hierarchical clustering analysis of 50 DAMs before the VIP value of C. sinensis from 15 producing areas.
Figure 6
Figure 6
Single-factor analysis of the 18 DAMs. The uppercase letters in the figure indicate that the abundance of metabolites is significantly different at the level of p < 0.05.
Figure 7
Figure 7
Comprehensive analysis of C. sinensis quality in 15 producing areas: (A) radar map of membership scores for 18 biomarkers from 15 producing areas; and (B) average radar chart of integrated membership function of C. sinensis in 15 producing areas.

Similar articles

Cited by

References

    1. Liang J., Li X.Z., Chen J.B., Tang C.Y., Wang T., Li Y.L. Suitability and regionalization of Chinese cordyceps in Qinghai Province Northwest China. Mycosystema. 2022;41:1772–1785. doi: 10.13346/j.mycosystema.220304. - DOI
    1. Li S.P., Yang F.Q., Tsim K.W.K. Quality control of Cordyceps sinensis, a valued traditional Chinese medicine. J. Pharm. Biomed. 2006;41:1571–1584. doi: 10.1016/j.jpba.2006.01.046. - DOI - PubMed
    1. Zhou X.W., Gong Z.H., Su Y., Lin J., Tang K.X. Cordyceps fungi: Natural products, pharmacological functions and developmental products. J. Pharm. Pharmacol. 2009;61:279–291. doi: 10.1211/jpp.61.03.0002. - DOI - PubMed
    1. Jie Y., Cao G.C., Rong Z.L., Li H.F. Global prediction of potential distribution of Ophiocordyceps sinensis in Chain based on Maxent model. Ecol. Sci. 2023;42:202–210. doi: 10.1038/s41598-021-96041-z. - DOI - PMC - PubMed
    1. Yan Y.J., Yi L., Wang W.J., He J.S., Yang R.H., Wu H.J., Wang X.L., Jiao L., Tang Z.Y., Yao Y.J. Range shifts in response to climate change of Ophiocordyceps sinensis, a fungus endemic to the Tibetan Plateau. Biol. Conserv. 2017;206:143–150. doi: 10.1016/j.biocon.2016.12.023. - DOI

LinkOut - more resources