

Transcriptomic Insights into Host Metabolism and Immunity Changes after Parasitization by Leptopilina myrica
- PMID: 38786908
- PMCID: PMC11122121
- DOI: 10.3390/insects15050352
Transcriptomic Insights into Host Metabolism and Immunity Changes after Parasitization by Leptopilina myrica
Abstract
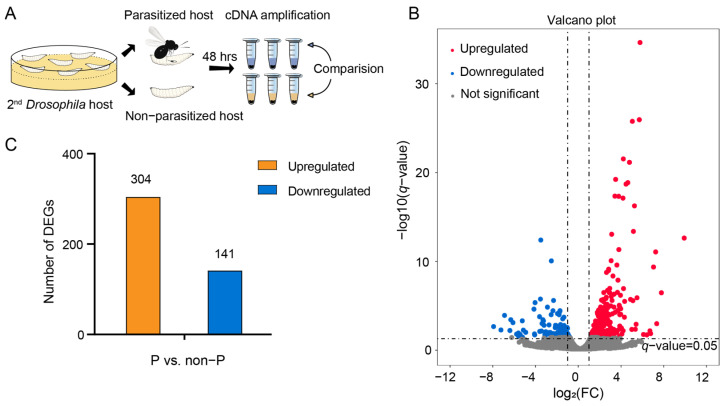
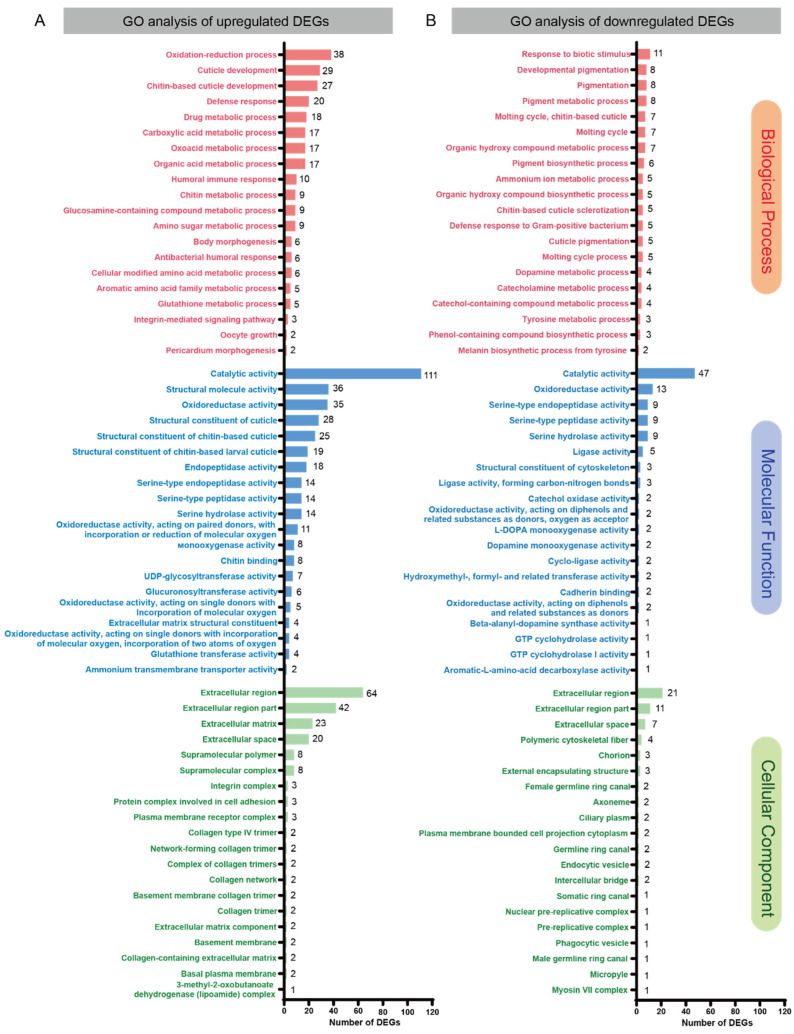
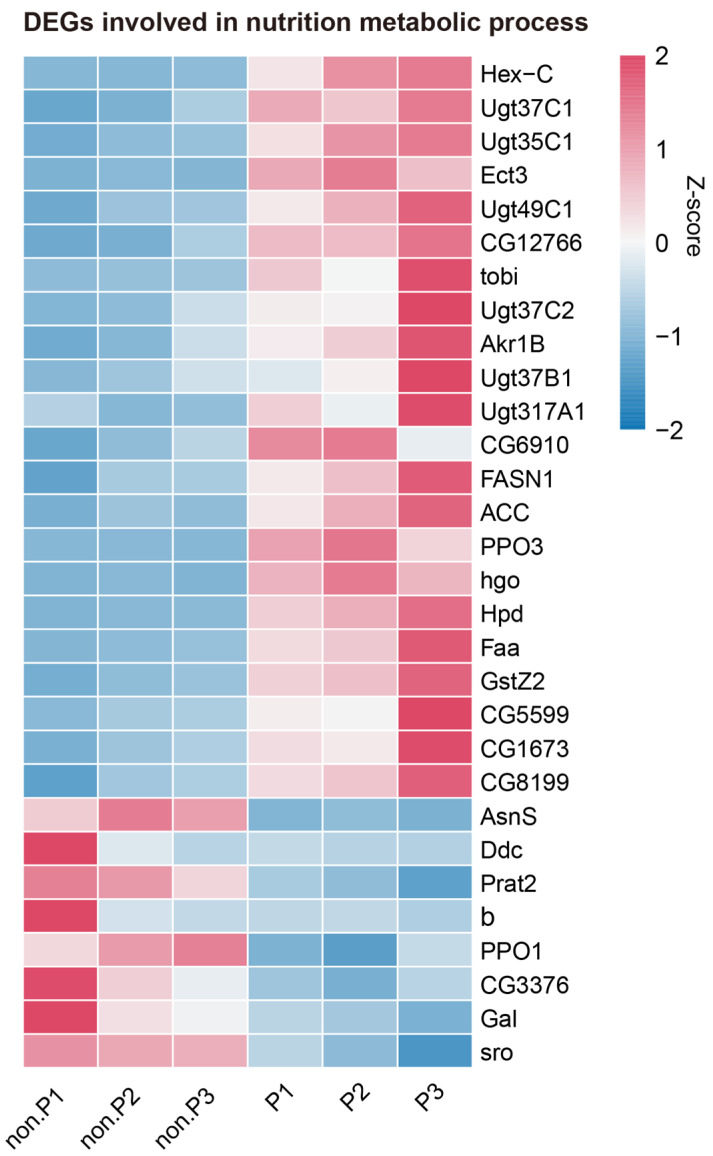
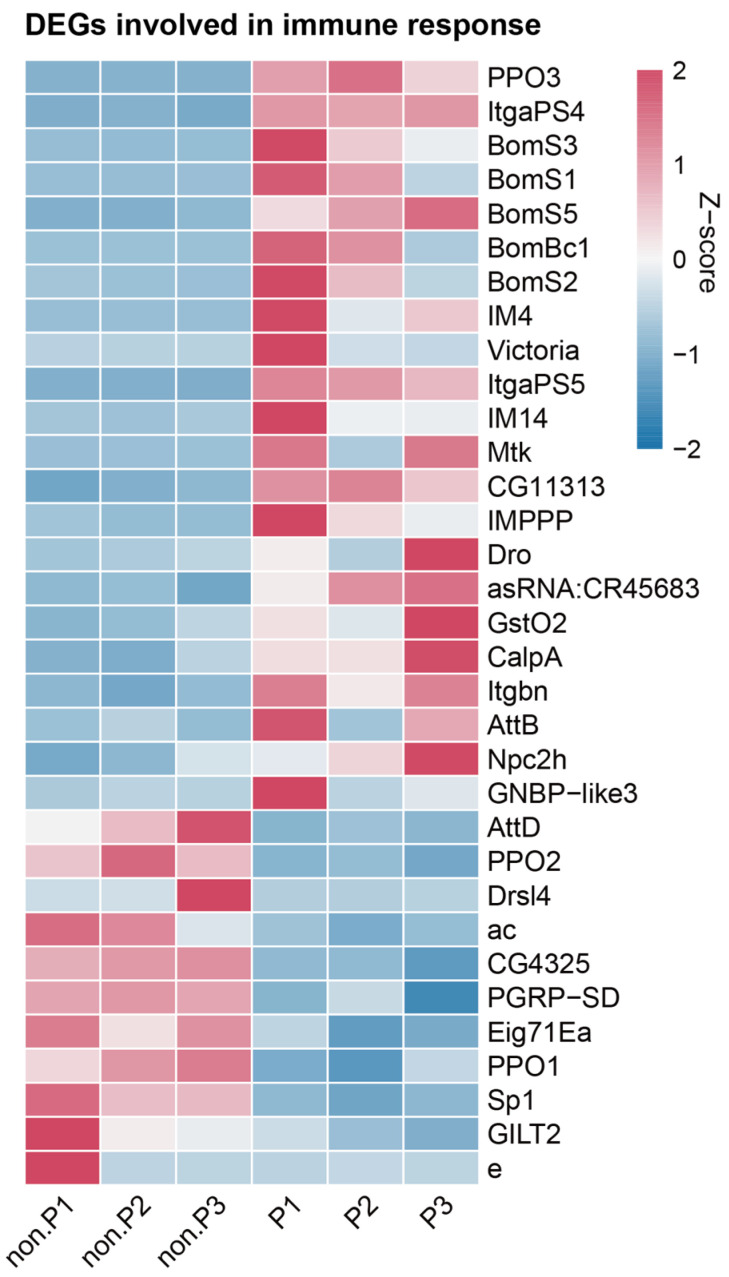
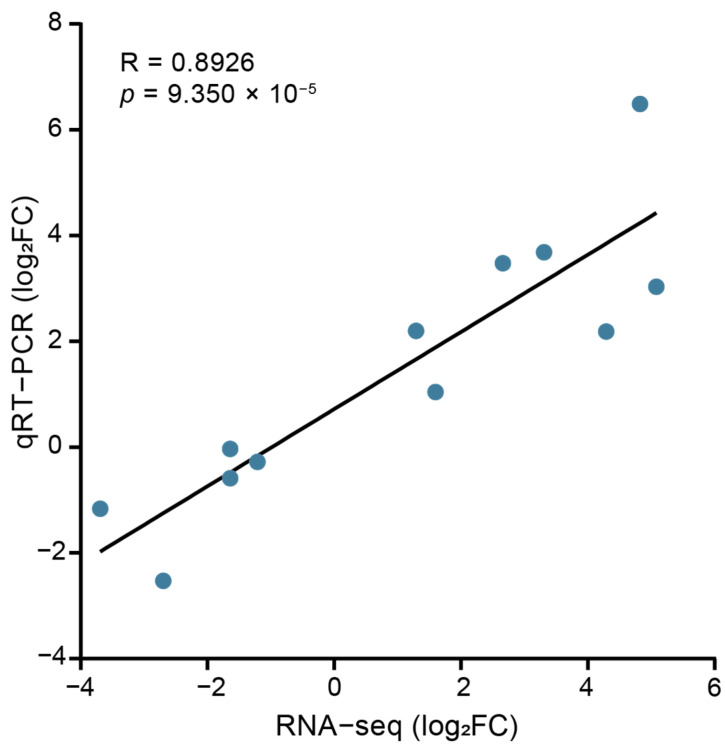
Parasitoids commonly manipulate their host's metabolism and immunity to facilitate their offspring survival, but the mechanisms remain poorly understood. Here, we deconstructed the manipulation strategy of a newly discovered parasitoid wasp, L. myrica, which parasitizes D. melanogaster. Using RNA-seq, we analyzed transcriptomes of L. myrica-parasitized and non-parasitized Drosophila host larvae. A total of 22.29 Gb and 23.85 Gb of clean reads were obtained from the two samples, respectively, and differential expression analysis identified 445 DEGs. Of them, 304 genes were upregulated and 141 genes were downregulated in parasitized hosts compared with non-parasitized larvae. Based on the functional annotations in the Gene Ontology (GO) and Kyoto Encyclopedia of Genes and Genomes (KEGG) databases, we found that the genes involved in host nutrition metabolism were significantly upregulated, particularly in carbohydrate, amino acid, and lipid metabolism. We also identified 30 other metabolism-related DEGs, including hexokinase, fatty acid synthase, and UDP-glycosyltransferase (Ugt) genes. We observed that five Bomanin genes (Boms) and six antimicrobial peptides (AMPs) were upregulated. Moreover, a qRT-PCR analysis of 12 randomly selected DEGs confirmed the reproducibility and accuracy of the RNA-seq data. Our results provide a comprehensive transcriptomic analysis of how L. myrica manipulates its host, laying a solid foundation for studies on the regulatory mechanisms employed by parasitoid wasps in their hosts.
Keywords: Leptopilina myrica; immunity; metabolism; parasitoid wasp; transcriptome.
Conflict of interest statement
The authors declare no conflicts of interest.
Figures
Similar articles
-
Host Transcriptome Analysis of Spodoptera frugiperda Larvae Parasitized by Microplitis manilae.Insects. 2023 Jan 17;14(2):100. doi: 10.3390/insects14020100. Insects. 2023. PMID: 36835669 Free PMC article.
-
Comparative transcriptome analysis reveals a potential mechanism for host nutritional manipulation after parasitization by Leptopilina boulardi.Comp Biochem Physiol Part D Genomics Proteomics. 2021 Sep;39:100862. doi: 10.1016/j.cbd.2021.100862. Epub 2021 Jun 7. Comp Biochem Physiol Part D Genomics Proteomics. 2021. PMID: 34120097
-
Metabolomics Provides New Insights into Host Manipulation Strategies by Asobara japonica (Hymenoptera: Braconidae), a Fruit Fly Parasitoid.Metabolites. 2023 Feb 24;13(3):336. doi: 10.3390/metabo13030336. Metabolites. 2023. PMID: 36984776 Free PMC article.
-
Strategies of avoidance of host immune defenses in Asobara species.Adv Parasitol. 2009;70:235-55. doi: 10.1016/S0065-308X(09)70009-0. Adv Parasitol. 2009. PMID: 19773073 Review.
-
Transcriptome analysis of starch and sucrose metabolism across bulb development in Sagittaria sagittifolia.Gene. 2018 Apr 5;649:99-112. doi: 10.1016/j.gene.2018.01.075. Epub 2018 Jan 31. Gene. 2018. PMID: 29374598 Review.
Cited by
-
The complete mitochondrial genome of Leptopilina myrica (Hymenoptera: Figitidae).Mitochondrial DNA B Resour. 2024 Dec 24;10(1):11-14. doi: 10.1080/23802359.2024.2444643. eCollection 2025. Mitochondrial DNA B Resour. 2024. PMID: 39776570 Free PMC article.
References
-
- Straser R.K., Daane K.M., Stahl J.M., Wilson H. Floral resources enhance fitness of the parasitoid Hadronotus pennsylvanicus (Hymenoptera: Scelionidae) but not biological control of its host Leptoglossus zonatus (Heteroptera: Coreidae) Environ. Entomol. 2024;53:213–222. doi: 10.1093/ee/nvae002. - DOI - PubMed
-
- Dou T., Bai S., Gao F., Tian L., Zhu J., Gu X., Yang X., Hao Y., An S., Liu X., et al. Improved effects of Helicoverpa armigera nucleopolyhedrovirus integrated with Campoletis chlorideae against H. armigera and impact of the virus on the parasitoid. Pest Manag. Sci. 2024;80:1145–1152. doi: 10.1002/ps.7845. - DOI - PubMed
Grants and funding
LinkOut - more resources
Full Text Sources
Molecular Biology Databases
