The Impact of Agroecosystems on Nitrous Acid (HONO) Emissions during Spring and Autumn in the North China Plain
- PMID: 38787110
- PMCID: PMC11126139
- DOI: 10.3390/toxics12050331
The Impact of Agroecosystems on Nitrous Acid (HONO) Emissions during Spring and Autumn in the North China Plain
Abstract
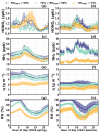
Solar radiation triggers atmospheric nitrous acid (HONO) photolysis, producing OH radicals, thereby accelerating photochemical reactions, leading to severe secondary pollution formation. Missing daytime sources were detected in the extensive HONO budget studies carried out in the past. In the rural North China Plain, some studies attributed those to soil emissions and more recent studies to dew evaporation. To investigate the contributions of these two processes to HONO temporal variations and unknown production rates in rural areas, HONO and related field observations obtained at the Gucheng Agricultural and Ecological Meteorological Station during spring and autumn were thoroughly analyzed. Morning peaks in HONO frequently occurred simultaneously with those of ammonia (NH3) and water vapor both during spring and autumn, which were mostly caused by dew and guttation water evaporation. In spring, the unknown HONO production rate revealed pronounced afternoon peaks exceeding those in the morning. In autumn, however, the afternoon peak was barely detectable compared to the morning peak. The unknown afternoon HONO production rates were attributed to soil emissions due to their good relationship to soil temperatures, while NH3 soil emissions were not as distinctive as dew emissions. Overall, the relative daytime contribution of dew emissions was higher during autumn, while soil emissions dominated during spring. Nevertheless, dew emission remained the most dominant contributor to morning time HONO emissions in both seasons, thus being responsible for the initiation of daytime OH radical formation and activation of photochemical reactions, while soil emissions further maintained HONO and associated OH radial formation rates at a high level, especially during spring. Future studies need to thoroughly investigate the influencing factors of dew and soil emissions and establish their relationship to HONO emission rates, form reasonable parameterizations for regional and global models, and improve current underestimations in modeled atmospheric oxidation capacity.
Keywords: HONO; NH3; atmospheric oxidation capacity; dew; guttation; soil emission.
Conflict of interest statement
The authors declare no conflicts of interest.
Figures


Similar articles
-
Severe photochemical pollution formation associated with strong HONO emissions from dew and guttation evaporation.Sci Total Environ. 2024 Feb 25;913:169309. doi: 10.1016/j.scitotenv.2023.169309. Epub 2023 Dec 15. Sci Total Environ. 2024. PMID: 38103604
-
Explosive morning growth phenomena of NH3 on the North China Plain: Causes and potential impacts on aerosol formation.Environ Pollut. 2020 Feb;257:113621. doi: 10.1016/j.envpol.2019.113621. Epub 2019 Nov 15. Environ Pollut. 2020. PMID: 31761581
-
The seasonal variations and potential sources of nitrous acid (HONO) in the rural North China Plain.Environ Pollut. 2022 Oct 15;311:119967. doi: 10.1016/j.envpol.2022.119967. Epub 2022 Aug 15. Environ Pollut. 2022. PMID: 35981642
-
HONO chemistry and its impact on the atmospheric oxidizing capacity over the Indo-Gangetic Plain.Sci Total Environ. 2024 Oct 15;947:174604. doi: 10.1016/j.scitotenv.2024.174604. Epub 2024 Jul 7. Sci Total Environ. 2024. PMID: 38981538 Review.
-
Sources of atmospheric nitrous acid: state of the science, current research needs, and future prospects.J Air Waste Manag Assoc. 2014 Nov;64(11):1232-50. doi: 10.1080/10962247.2014.952846. J Air Waste Manag Assoc. 2014. PMID: 25509545 Review.
Cited by
-
Acid-Modified Biochar Derived from Agricultural Waste for Efficiently Capturing Low-Concentration Nitrous Oxide (N2O): Mechanisms and Environmental Implications.Toxics. 2025 Jul 25;13(8):623. doi: 10.3390/toxics13080623. Toxics. 2025. PMID: 40863899 Free PMC article.
References
-
- Kleffmann J., Gavriloaiei T., Hofzumahaus A., Holland F., Koppmann R., Rupp L., Schlosser E., Siese M., Wahner A. Daytime formation of nitrous acid: A major source of OH radicals in a forest. Geophys. Res. Lett. 2005;32:L05818. doi: 10.1029/2005gl022524. - DOI
-
- Zheng J., Shi X., Ma Y., Ren X., Jabbour H., Diao Y., Wang W., Ge Y., Zhang Y., Zhu W. Contribution of nitrous acid to the atmospheric oxidation capacity in an industrial zone in the Yangtze River Delta region of China. Atmos. Chem. Phys. 2020;20:5457–5475. doi: 10.5194/acp-20-5457-2020. - DOI
Grants and funding
LinkOut - more resources
Full Text Sources
Miscellaneous

