. 2023 Dec:78:101830.
doi: 10.1016/j.molmet.2023.101830. Epub 2023 Oct 28.

Hepatic Activin E mediates liver-adipose inter-organ communication, suppressing adipose lipolysis in response to elevated serum fatty acids

Affiliations

Hepatic Activin E mediates liver-adipose inter-organ communication, suppressing adipose lipolysis in response to elevated serum fatty acids

John D Griffin et al. Mol Metab. 2023 Dec.

Abstract

Objective: The liver is a central regulator of energy metabolism exerting its influence both through intrinsic processing of substrates such as glucose and fatty acid as well as by secreting endocrine factors, known as hepatokines, which influence metabolism in peripheral tissues. Human genome wide association studies indicate that a predicted loss-of-function variant in the Inhibin βE gene (INHBE), encoding the putative hepatokine Activin E, is associated with reduced abdominal fat mass and cardiometabolic disease risk. However, the regulation of hepatic Activin E and the influence of Activin E on adiposity and metabolic disease are not well understood. Here, we examine the relationship between hepatic Activin E and adipose metabolism, testing the hypothesis that Activin E functions as part of a liver-adipose, inter-organ feedback loop to suppress adipose tissue lipolysis in response to elevated serum fatty acids and hepatic fatty acid exposure.

Methods: The relationship between hepatic Activin E and non-esterified fatty acids (NEFA) released from adipose lipolysis was assessed in vivo using fasted CL 316,243 treated mice and in vitro using Huh7 hepatocytes treated with fatty acids. The influence of Activin E on adipose lipolysis was examined using a combination of Inhbe knockout mice, a mouse model of hepatocyte-specific overexpression of Activin E, and mouse brown adipocytes treated with Activin E enriched media.

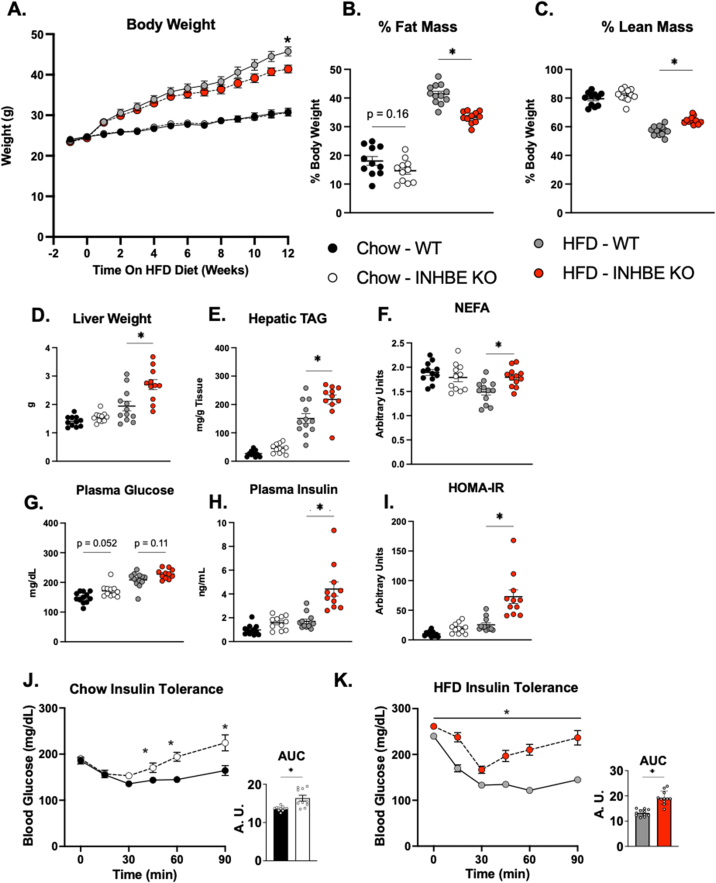
Results: Increasing hepatocyte NEFA exposure in vivo by inducing adipose lipolysis through fasting or CL 316,243 treatment increased hepatic Inhbe expression. Similarly, incubation of Huh7 human hepatocytes with fatty acids increased expression of INHBE. Genetic ablation of Inhbe in mice increased fasting circulating NEFA and hepatic triglyceride accumulation. Treatment of mouse brown adipocytes with Activin E conditioned media and overexpression of Activin E in mice suppressed adipose lipolysis and reduced serum FFA levels, respectively. The suppressive effects of Activin E on lipolysis were lost in CRISPR-mediated ALK7 deficient cells and ALK7 kinase deficient mice. Disruption of the Activin E-ALK7 signaling axis in Inhbe KO mice reduced adiposity upon HFD feeding, but caused hepatic steatosis and insulin resistance.

Conclusions: Taken together, our data suggest that Activin E functions as part of a liver-adipose feedback loop, such that in response to increased serum free fatty acids and elevated hepatic triglyceride, Activin E is released from hepatocytes and signals in adipose through ALK7 to suppress lipolysis, thereby reducing free fatty acid efflux to the liver and preventing excessive hepatic lipid accumulation. We find that disrupting this Activin E-ALK7 inter-organ communication network by ablation of Inhbe in mice increases lipolysis and reduces adiposity, but results in elevated hepatic triglyceride and impaired insulin sensitivity. These results highlight the liver-adipose, Activin E-ALK7 signaling axis as a critical regulator of metabolic homeostasis.

Keywords: Adipose tissue; Diabetes; Lipolysis; Obesity.


Figures

Image 1
Graphical abstract
Figure 1
Figure 1
Hepatic Inhbe Expression Is Increased by Free Fatty Acids. (A) Hepatic Inhbe gene expression, (B) plasma non-esterified fatty acids (NEFA), (C) hepatic triglyceride (TAG), (D) tail vein glucose and (E) plasma insulin from 10 to 12 weeks old, male C57BL6 mice collected under ad-libitum fed, 6hr fasting, 18hr fasting, or 4hr refed conditions. Gray zones on graph represent periods of ad-libitum feeding. White zones represent periods of fasting. Black and white horizontal bars represent dark and light cycle, respectively. Data are presented as mean ± S.E.M. n = 9 mice/timepoint. ∗ = p ≤ 0.05 via Student's t-test compared to fed-state. (F) Plasma NEFA, (G) hepatic TAG, and (H) hepatic Inhbe gene expression in 16–20 week old mice injected intraperitoneally with 100ug/kg CL 316,243 or saline in the fed state. Following injection food was removed, tail vein blood was collected at indicated time points and mice were euthanized after 120 or 240 min. For g & h, “baseline” data used for normalization was collected from mean of an untreated control group euthanized at time of injection. Data are presented as mean ± S.E.M. n = 8–14 mice/grp/timepoint ∗ = p ≤ 0.05 via Student's t-test CL 316,243 vs saline within each timepoint. (IL) Expression of CPT1⍺ and Inhbe in Huh7 hepatocellular carcinoma cells treated with indicated concentrations of fatty acids for 24hrs. Expression normalized to the geometric mean of Ppia, Ppib, and Gapdh and expressed relative to untreated cells incubated in 1 % BSA control media. Data are presented as mean ± S.E.M. n = 3–4 wells/dose ∗ = p ≤ 0.05 via Student's t-test vs. untreated controls within each dose group.
Figure 2
Figure 2
Loss of Inhbe Increases Fasting NEFA & Hepatic TAG. (AD) Plasma non-esterified fatty acid (NEFA) and hepatic triglyceride (TAG) from 10 to 12 weeks old, chow fed (A,C) male and (B,D) female Inhbe knockout mice collected under ad-libitum fed, 6 h fasting, or 18hr fasting conditions. (EH) Blood glucose and plasma insulin from 10 to 12 week old, chow fed (E,G) male and (F,H) female Inhbe knockout mice collected under ad-libitum fed, 6hr fasting, or 18hr fasting conditions. Gray zones on graph represent periods of ad-libitum feeding. White zones represent periods of fasting. Black and white horizontal bars represent dark and light cycle, respectively. All experiments performed at room temperature. Data are presented as mean ± S.E.M. n = 15 mice/timepoint ∗ = p ≤ 0.05 via Student's t-test compared to fed-state.
Figure 3
Figure 3
Activin E Conditioned Media Suppresses Adipocyte Free Fatty Acid Release. (AB) Non-esterified fatty acid (NEFA) release from differentiated immortalized mouse brown preadipocytes treated for 24hrs with no ligand (Krebs Ringer HEPES Buffer, KRBH), Activin B in KRBH, Activin C in KRBH, or indicated concentrations of conditioned media (CM) enriched with mouse or human INHBE (mINHBE and hINHBE, respectively) on day 7 post-differentiation. Media harvested from empty vector transfected cells (EVCM) was used as a control treatment. Following incubation, cells were treated with 1 nm isoproterenol. At the end of 2hr media was collected for analysis. Data points represent mean ± S.E.M. of 3–4 experimental replicates. All data normalized to untreated, control cells. (C–H) Representative dose–response of NEFA release from differentiated immortalized mouse brown preadipocytes incubated as above with 3 % solutions of CM. Following incubation cells were treated with indicated doses of (C–D) isoproterenol, (E–F) CL 316,243, or (G–H) forskolin. Data are presented as mean ± S.E.M. Data points represent individual wells. n = 3–6 wells/dose. ∗ = p ≤ 0.05 via one-way ANOVA within each dose (I) Intracellular cyclic AMP concentrations in differentiated mBAD treated with 1 nm isoproterenol, 1 nm CL316,243, or 1 μM forskolin. Data are presented as mean ± S.E.M. Data points represent individual wells. n = 5–6 wells/dose. ∗ = p ≤ 0.05 via one-way ANOVA. (J) Gene expression of lipolytic target genes from immortalized mouse brown preadipocytes treated with 3 % solutions of conditioned media for 24hrs. Data are presented as mean ± S.E.M. Data points represent individual wells. n = 6–8 wells/grp. ∗ = p ≤ 0.05 via one-way ANOVA within each gene. (K) Hepatic expression of Inhbe in fed mice 4 weeks following treatment with 3∗1011 g.c. AAV8-TBG adenovirus expressing empty vector (EV AAV) or the coding region of mouse Inhbe (Inhbe AAV). A saline treated group was used as an additional control. Data are presented as mean ± S.E.M. Data points represent individual mice. n = 3 mice/grp ∗ = p ≤ 0.05 via one-way ANOVA. (L) Plasma NEFA in mice fasted for 6hrs. Data collected 8 weeks following treatment with indicated adenovirus. Data are presented as mean ± S.E.M. Data points represent individual mice. n = 10–12/grp ∗ = p ≤ 0.05 via one-way ANOVA. (M) Plasma NEFA at indicated timepoints and area under the curve (AUC) from mice injected with 100ug/kg CL316,243 12 weeks following treatment with indicated adenovirus or saline. Experiment performed at room temperature. Data are presented as mean ± S.E.M. For AUC, data points represent individual mice. n = 12 mice/grp ∗ = p ≤ 0.05 via one-way ANOVA. (For interpretation of the references to color in this figure legend, the reader is referred to the Web version of this article.)
Figure 4
Figure 4
Activin E Signals Through ALK7 To Suppress Adipose Lipolysis. (A) Representative western blot of SMAD phosphorylation in HEK293T transfected with indicated constructs, treated with empty vector conditioned media (EVCM), EVCM plus 25 ng/mL Activin B, or CM enriched with mouse or human INHBE (mINHBE and hINHBE, respectively) for 30mins. Where indicated, cells were pretreated for 30 min with SB-431542 prior to ligand addition. (BE) Densitometric quantitation of pSMAD2:Total SMAD2 for cells treated with indicated ligands. Data are normalized to mean of empty vector transfected cells treated with EVCM and presented as mean ± S.E.M. of 4 experimental replicates. Data points represent values from independent experiments. ∗ = p ≤ 0.05 analyzed by one-way ANOVA (F) Representative western blot of SMAD phosphorylation in differentiated immortalized mouse brown preadipocytes following CRISPR mediated gene editing using indicated guides. (G) Non-esterified fatty acid (NEFA) release from differentiated immortalized mouse brown preadipocytes following CRISPR mediated gene editing. Cells were treated for 24hrs with indicated ligands prior to starvation and stimulation with 1 nm isoproterenol. Data are presented as mean ± S.E.M. Data points represent individual wells. n = 4–6 wells/grp. ∗ = p ≤ 0.05 analyzed by one-way ANOVA. Data are representative of two independent experiments. (H) Plasma NEFA in 12 week old, chow fed male ALK7 constitutively active (ALK7 CA) mice fasted for 6hr. Data are presented as mean ± S.E.M. Data points represent indivudal mice. n = 8 mice/grp. ∗ = p ≤ 0.05 analyzed by Student's t-test. (I) Plasma NEFA in 16 week old, chow fed male mice injected intraperitoneally with 100ug/kg CL 316,243 in the fed state. Following injection food was removed and tail vein blood was collected at indicated time points. Data are presented as mean ± S.E.M. n = 8 mice/grp/timepoint. ∗ = p ≤ 0.05 analyzed by Student's t-test within each timepoint. (JK) (J) Plasma NEFA and (K) baseline normalized area under the curve (AUC) in mice treated with an AAV8-TBG encoding mouse Inhbe (Inhbe AAV) or an empty vector (EV AAV) control. 10 weeks following AAV treatment mice were injected intraperitoneally with 100ug/kg CL 316,243 in the fed state. Following injection food was removed and tail vein blood was collected at indicated time points. Data are presented as mean ± S.E.M. n = 10–12 mice/grp/timepoint ∗ = p ≤ 0.05, Wildtype – EV vs. Wildtype - Inhbe via one-way ANOVA and Tukey's HSD posthoc testing within each timepoint. (For interpretation of the references to color in this figure legend, the reader is referred to the Web version of this article.)
Figure 5
Figure 5
Knockout of INHBE Protects from HFD Induced Obesity, but Increases Hepatic TAG and Impairs Insulin Sensitivity (A) Body weight of male wildtype (WT) and Inhbe knockout (INHBE KO) mice fed chow and 60 % high fat diet (HFD) for 12 weeks. (B) Relative fat mass and (C) relative lean mass after 11 weeks of diet treatment. (DE) Liver weight and hepatic triglyceride content of wildtype and INHBE KO after 12 weeks of chow or HFD feeding. (F) 6hr fasting plasma non-esterified fatty acids (NEFA) after 3 weeks of chow or HFD feeding. (GH) 6hr fasting blood glucose and plasma insulin measured from tail nick and submandibular bleed, respectively, following 9 weeks of HFD. (I) Homeostatic model assessment of insulin resistance (HOMA-IR) calculated from blood glucose and plasma insulin collected after 9 weeks of diet treatment. Data are presented as mean ± S.E.M. n = 11–12/grp. ∗ = p ≤ 0.05 via Two-way ANOVA and Tukey's HSD posthoc testing. (JK) Blood glucose excursions following intraperitoneal injection of insulin in mice fed (J) chow or (K) HFD for 4 weeks. Area under the curve (AUC) of blood glucose over time is shown adjacent to each graph. All experiments performed at thermoneutrality Data are presented as mean ± S.E.M. Where shown, data points represent values from individual mice. n = 11–12/grp. ∗ = p ≤ 0.05 via Student's t-test at each timepoint.

References

    1. Priest C., Tontonoz P. Inter-organ cross-talk in metabolic syndrome. Nat Metab. 2019;1(12):1177–1188. doi: 10.1038/s42255-019-0145-5. - DOI - PubMed
    1. Jensen-Cody S.O., Potthoff M.J. Hepatokines and metabolism: deciphering communication from the liver. Mol Metabol. 2020;44:101138. doi: 10.1016/j.molmet.2020.101138. - DOI - PMC - PubMed
    1. Deaton A.M., Dubey A., Ward L.D., Dornbos P., Flannick J., Yee E., et al. Rare loss of function variants in the hepatokine gene INHBE protect from abdominal obesity. Nat Commun. 2022;13(1):4319. doi: 10.1038/s41467-022-31757-8. - DOI - PMC - PubMed
    1. Akbari P., Sosina O.A., Bovijn J., Landheer K., Nielsen J.B., Kim M., et al. Multiancestry exome sequencing reveals INHBE mutations associated with favorable fat distribution and protection from diabetes. Nat Commun. 2022;13(1):4844. doi: 10.1038/s41467-022-32398-7. - DOI - PMC - PubMed
    1. Sugiyama M., Kikuchi A., Misu H., Igawa H., Ashihara M., Kushima Y., et al. Inhibin βE (INHBE) is a possible insulin resistance-associated hepatokine identified by comprehensive gene expression analysis in human liver biopsy samples. PLoS One. 2018;13(3) doi: 10.1371/journal.pone.0194798. - DOI - PMC - PubMed