. 2024 Oct 4;14(10):1922-1939.
doi: 10.1158/2159-8290.CD-23-1145.

Targeting Acute Myeloid Leukemia Stem Cells through Perturbation of Mitochondrial Calcium

Affiliations

Targeting Acute Myeloid Leukemia Stem Cells through Perturbation of Mitochondrial Calcium

Anagha Inguva Sheth et al. Cancer Discov. .

Abstract

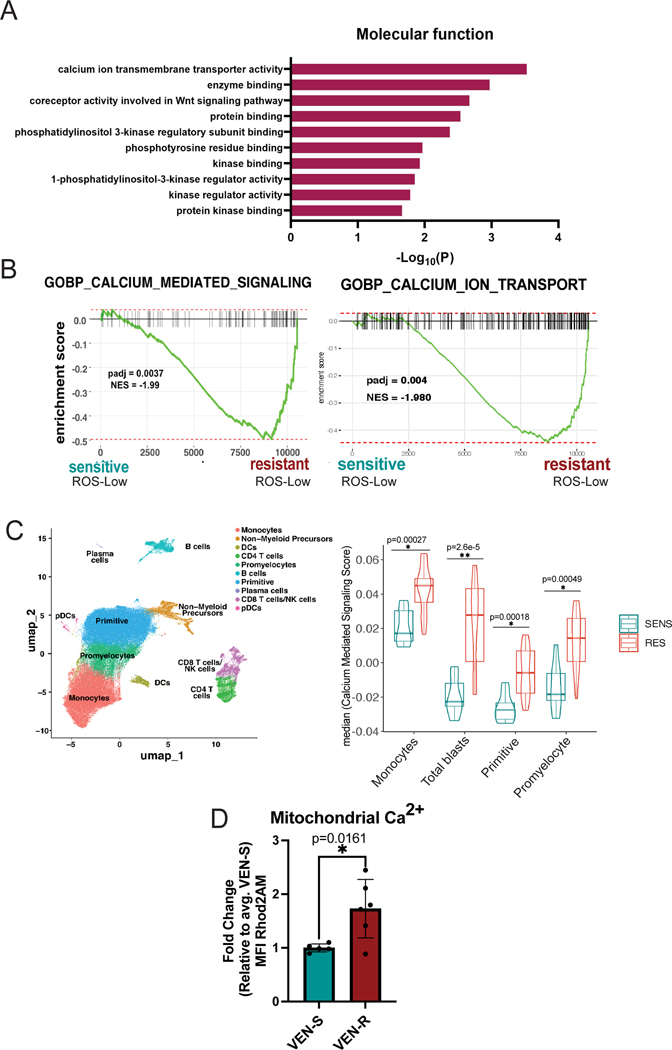
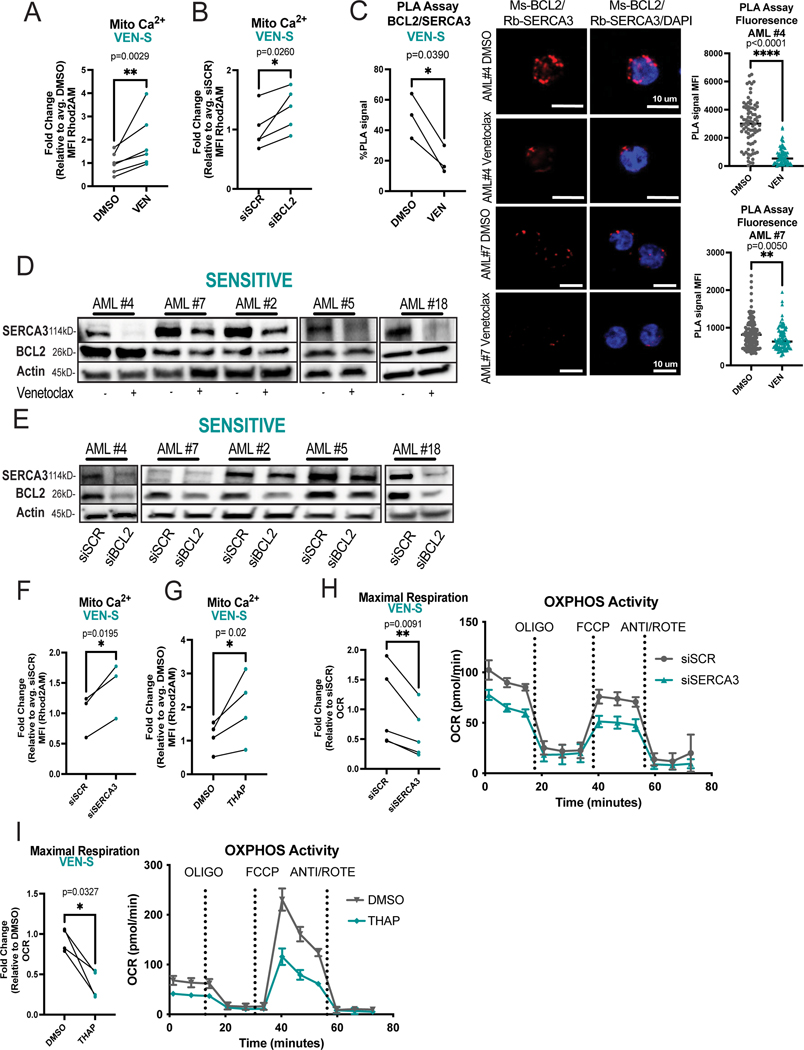
Acute myeloid leukemia stem cells (LSCs) are uniquely reliant on oxidative phosphorylation (OXPHOS) for survival. Moreover, maintenance of OXPHOS is dependent on BCL-2, creating a therapeutic opportunity to target LSCs using the BCL-2 inhibitor venetoclax. Although venetoclax-based regimens have shown promising clinical activity, the emergence of drug resistance is prevalent. Thus, in the present study, we investigated how mitochondrial properties may influence venetoclax responsiveness. Our data show that utilization of mitochondrial calcium is fundamentally different between drug-responsive and nonresponsive LSCs. By comparison, venetoclax-resistant LSCs demonstrate an active metabolic (i.e., OXPHOS) status with relatively high levels of calcium. Consequently, we tested genetic and pharmacological approaches to target the mitochondrial calcium uniporter. We demonstrate that inhibition of calcium uptake reduces OXPHOS and leads to eradication of venetoclax-resistant LSCs. These findings demonstrate a central role for calcium signaling in LSCs and provide an avenue for clinical management of venetoclax resistance. Significance: We identify increased utilization of mitochondrial calcium as a distinct metabolic requirement of venetoclax-resistant LSCs and demonstrate the potential of targeting mitochondrial calcium uptake as a therapeutic strategy.


Conflict of interest statement

Disclosure of COI

The authors declare no competing interests related to this study.

Conflict of interest: The authors declare that there is no conflict of interest regarding the publication of this article.

Figures

Figure 1.
Figure 1.. Venetoclax Responsiveness is Associated with Intrinsic Differences in Calcium Pathway Signaling
A. BCL-2 interacts with signaling proteins using BioID in T-REx HEK293 cells. Pathway enrichment analysis of BCL-2 proximity interactors involved in cellular signaling. Gene ontology (Molecular Function) analysis shows the top 10 enrichment pathways. B. Enrichment plot for GOBP Calcium Mediated Signaling pathway (198 genes) and GOBP Calcium Ion Transport (455 genes) in N=7 venetoclax sensitive primary human AML ROS-Low cells and N=5 venetoclax resistant primary human AML ROS-Low cells C. Projection of all samples with cluster assignments annotated. In various populations of tumor including, monocytes, primitive cells, promyelocytes, and total blasts (a combination of monocytes, primitive cells and promyelocytes)GO-BP Calcium Mediated Signaling Pathway expression was analyzed using Seurat’s AddModuleScore function in sensitive (n=8) versus resistant (n=12) AML patient specimens with median plotted. Significance was determined using t-test. D. Mitochondrial calcium levels in venetoclax resistant primary human AML ROS-low cells compared to sensitive ROS-low cells presented as mean fluorescence intensity (MFI). N=5 venetoclax sensitive (AML 2,4,6,7,18) and n=6 venetoclax resistant (AML 1,3,11,12,13,14) cells. Data are presented as mean +/− SD. Significance was determined using two-tailed unpaired t-test.
Figure 2.
Figure 2.. BCL-2 Inhibition Causes Mitochondrial Calcium Changes Associated with SERCA Disruption in Venetoclax Sensitive LSCs
A. Mitochondrial calcium content presented as mean fluorescence intensity (MFI) after venetoclax treatment (500nM, 3 hours). N=6 venetoclax sensitive primary human AML ROS-low cells (AML#2,4–7,18). Significance determined using two-tailed ratio paired t-test. B. Primary human ROS-low AML cells analyzed 36 hours post electroporation with indicated siRNA. Mitochondrial calcium after genetic inhibition of BCL-2. N=5 venetoclax sensitive specimens (AML# 2,4–7). Significance determined using two-tailed ratio paired t-test. C. BCL-2 and SERCA3 proximity interaction in primary human ROS-low AML cells after venetoclax treatment (500nM, 3 hours) as measured by PLA assay with flow cytometry reported as percentage above negative signal determined by IgG control (n=3, AML #2,4,7). Significance was determined using two-tailed ratio paired t-test. Confocal microscopy to confirm PLA assay results. Representative images from AML #4 and #7. Red signal is positive signal from PLA assay (FarRed) while blue signal is from Dapi staining. Signal was quantified using ImageJ for MFI of loci. N>70 loci per condition. Data are presented as mean with individual data points. Significance was determined using two-tailed unpaired t-test. D. Western blot of SERCA3 and BCL-2 levels upon venetoclax treatment (500nM, 3 hours) in venetoclax sensitive primary human AML ROS low cells. Anti-actin antibody was used as loading control, anti-BCL-2 and anti-SERCA3 antibodies were used to determine protein levels of BCL-2 and SERCA3 respectively. Quantification presented in supplementary figure 2O. Minimally cropped version presented in supplementary figure 2P E. Western blot of SERCA3 levels upon BCL-2 inhibition via siRNA electroporation in primary human ROS-low AML cells 36 hours post infection. Anti-actin antibody was used as loading control, anti-BCL-2 and anti-SERCA3 antibodies were used to determine protein levels of BCL-2 and SERCA3 respectively. Quantification presented in supplementary figure 2Q. Minimally cropped version presented in supplementary figure 2R F. Mitochondrial calcium 36 hours post siRNA electroporation of primary human ROS-low AML cells. N=3 (AML#2,5,6). Significance determined using two-tailed ratio paired t-test. G. Mitochondrial calcium content after thapsigargin treatment (500nM, 3 hours). N=4 primary human ROS-low AML cells (AML# 2,5–7). Significance determined using two-tailed ratio paired t-test. H. OCR after genetic knockdown of SERCA3 36 hours post infection in venetoclax sensitive primary human ROS-low AML cells. N=5 (AML# 2,4–7). Significance was determined using two-tailed ratio paired t-test. I. OCR after thapsigargin treatment (500nM, 3 hours). N=4 (AML# 2,5–7) in venetoclax sensitive primary human ROS-low AML cells. Significance was determined using two-tailed ratio paired t-test.
Figure 3.
Figure 3.. Reducing Mitochondrial Calcium Levels Targets Venetoclax Resistant LSCs
A. Mitochondrial calcium content presented as mean fluorescence intensity (MFI) after venetoclax treatment (500nM, 3 hours). N=7 venetoclax resistant primary human AML ROS-low cells (AML# 11–14, 19–21). Significance was determined using two-tailed ratio paired t-test. B. BCL-2 and SERCA3 proximity interaction in venetoclax resistant primary human AML ROS-low cells after venetoclax treatment (500nM, 3 hours) as measured by PLA assay with flow cytometry (n=3, AML #11–13). Significance was determined using two-tailed ratio paired t-test. Confocal microscopy to confirm PLA assay results. Representative images from AML #13 and AML #12. Red signal is positive signal from PLA assay (FarRed) while blue signal is from Dapi staining. Signal was quantified using ImageJ for MFI of loci. N>70 foci per condition. Data are presented as mean with individual data points. Significance was determined using two-tailed unpaired t-test. C. Western blot of SERCA3 and BCL-2 levels upon venetoclax treatment (500nM, 3 hours) in venetoclax resistant primary human AML ROS-Low cells. Anti-actin antibody was used as loading control, anti-BCL-2 and anti-SERCA3 antibodies were used to determine protein levels of BCL-2 and SERCA3 respectively. Quantification presented in supplementary figure 3A. Minimally cropped version presented in supplementary figure 3B D. Boxplot of specific genes of interest. All genes shown were significantly different between resistant and sensitive samples with p-values shown on figure. N=7 venetoclax sensitive ROS-Low cells and N=5 venetoclax resistant ROS-Low cells. E. Western blot of MCU levels in venetoclax sensitive versus resistant ROS-low cells. Anti-actin antibody was used as loading control, anti-MCU antibody was used to determine protein levels of MCU. N=4 biological replicates per category. Quantification using ImageJ of respective bands from panel are presented. Significance was determined using two-tailed unpaired t-test. F-H. Venetoclax resistant primary human AML ROS-Low cells (n=3, AML#11–13) treated with MCUi4 for 16 hours at 5uM. F. Mitochondrial calcium content after MCUi4 treatment presented as mean fluorescence intensity (MFI). Significance was determined using two-tailed ratio paired t-test. G. OCR after MCUi4 treatment. Significance was determined using two-tailed ratio paired t-test. H. Isocitrate dehydrogenase activity and alpha keto-glutarate dehydrogenase activity after MCUi4 treatment. Significance was determined using two-tailed ratio paired t-test. I. MCUi4 treatment (5uM, 16 hours, ex vivo) and subsequent engraftment potential of venetoclax resistant primary human AML specimens after transplantation into immune-deficient mice. N=13,16,12 for vehicle control group and n=12,12,9 for MCUi4 treatment group for AML 11,13 and 14 respectively. 2 million cells injected per mouse and engraftment was assessed between 4–8 weeks. Data are presented as mean with individual data points. Significance was measured by two-tailed unpaired t-test.
Figure 4.
Figure 4.. Mitoxantrone Inhibits Mitochondrial Metabolism and Colony Formation in Venetoclax Resistant LSCs
A-D. Venetoclax resistant primary human AML ROS-low cells treated with mitoxantrone for 16 hours at 100nM. A. Mitochondrial calcium content after mitoxantrone treatment presented as mean fluorescence intensity (MFI). Significance was determined using two-tailed ratio paired t-test. (N=4, AML#11–14) B. OCR after mitoxantrone treatment. Significance was determined using two-tailed ratio paired t-test. (N=4, AML#11–14) C. Isocitrate dehydrogenase activity and alpha keto-glutarate dehydrogenase activity after mitoxantrone treatment (N=3, AML#11–13). Significance was determined using two-tailed ratio paired t-test. D. Gamma H2AX presented as mean fluorescence intensity (MFI). Significance was determined using two-tailed ratio paired t-test. (N=3, AML#11,13,14) E. Colony forming units measured by colony formation assays in venetoclax resistant primary human AML specimens after mitoxantrone treatment (1nM,10nM and 100nM, 16 hour treatment, ex vivo). Data are presented as mean values +/−SD. Significance was measured by two-tailed unpaired t-test. N=3 per sample per condition. F. Colony forming units measured by colony formation assays in mobilized peripheral blood samples after mitoxantrone treatment (DMSO, 10nM or 100nM, 16 hour treatment, ex vivo). Data are presented as mean values +/−SD. Significance was measured by two-tailed unpaired t-test. N=3 per sample per condition.
Figure 5.
Figure 5.. Mitoxantrone Targets Venetoclax Resistant LSCs
A. Engraftment potential of venetoclax resistant primary human AML specimens after mitoxantrone treatment (100nM, 16 hours, ex vivo) after transplantation into immune-deficient mice. Data are presented as mean values with individual data points. Significance was measured by two-tailed unpaired t-test. n=8,8,8,10,13 for vehicle control group and n=10,11,7,10,10 for mitoxantrone treatment group for AML 1,3,11,13, 14 respectively. B. In vivo treatment of NSG-S mice with venetoclax resistant AML tumor burden. Venetoclax resistant specimens were transplanted into immune-deficient mice. Upon at least 20% bone marrow tumor burden, mice were treated with either vehicle (PBS,i.p/day. 4 days ) or mitoxantrone (0.5mg/kg/day,i.p. 4 days). On day 5, mice were sacrificed and bone marrow was assessed for tumor burden. Cells were then transplanted again into NSG-S mice for secondary transplants (1million cells per mouse per condition) to assess LSC potential. Data are presented as mean values with individual data points. Significance was measured by two-tailed unpaired t-test. For AML #1, n=11 (vehicle) and n=12 (mitoxantrone) for primary transplants. For AML #1, n=11 (vehicle) and n=9 (mitoxantrone) for secondary transplants. For AML #13, n=12 (vehicle) and n=12 (mitoxantrone) for primary transplants. For AML #13, n=10 (vehicle) and n=10 (mitoxantrone) for secondary transplants. For AML#14, n=8 (vehicle) and n=9 (mitoxantrone) for primary transplants. For AML #11, n=8 (vehicle) and n=9 (mitoxantrone) for secondary transplants.
Figure 6.
Figure 6.. Hypothesized Model of Intracellular Calcium Dynamics in Venetoclax Sensitive versus Resistant LSCs.
A. Due to inherently low basal respiration, venetoclax sensitive LSCs require relatively low basal mitochondrial calcium. During basal conditions, in venetoclax sensitive primary human AML LSCs, BCL2 promotes proper SERCA activity, thereby shuttling calcium into the ER for proper storage preventing cytosolic or mitochondrial calcium overload. MAMs facilitate proper exchange of calcium from the ER to mitochondria to fuel OXPHOS activity. Upon venetoclax treatment, SERCA activity it is decreased leading to decreased ER calcium uptake. Increased cytosolic calcium levels combined with transfer of calcium from MAMs leads to increased calcium being stored in the mitochondria leading to calcium overload and inhibition of proper mitochondrial metabolism. B. In contrast to sensitive LSCs, venetoclax resistant LSCs have evolved to have higher levels of mitochondrial calcium to support increased metabolic demands including higher OXPHOS activity. These functional changes are supported by decreased BCL-2 and SERCA3 levels concomitant with increased MCU expression. As a result, venetoclax treatment does not induce further decreased BCL-2 activity or SERCA levels. As venetoclax is unable to perturb intracellular calcium signaling in resistant LSCs, we hypothesized directly perturbing mitochondrial calcium content, a key ion required for OXPHOS activity, could target venetoclax resistant LSCs. Inhibition of MCU through genetic or pharmacologic inhibition leads to decreased mitochondrial calcium levels, OXPHOS activity and LSC activity. Taken together, our data demonstrate that either mitochondrial calcium overload or depletion is detrimental to mitochondrial metabolism and cell function.

Update of

References

    1. DiNardo CD, et al., Azacitidine and Venetoclax in Previously Untreated Acute Myeloid Leukemia. N Engl J Med, 2020. 383(7): p. 617–629. - PubMed
    1. Pollyea DA, et al., Venetoclax with azacitidine disrupts energy metabolism and targets leukemia stem cells in patients with acute myeloid leukemia. Nat Med, 2018. 24(12): p. 1859–1866. - PMC - PubMed
    1. DiNardo CD, et al., Venetoclax combined with decitabine or azacitidine in treatment-naive, elderly patients with acute myeloid leukemia. Blood, 2019. 133(1): p. 7–17. - PMC - PubMed
    1. DiNardo CD, et al., Safety and preliminary efficacy of venetoclax with decitabine or azacitidine in elderly patients with previously untreated acute myeloid leukaemia: a non-randomised, open-label, phase 1b study. Lancet Oncol, 2018. 19(2): p. 216–228. - PubMed
    1. Pei S, et al., Monocytic Subclones Confer Resistance to Venetoclax-Based Therapy in Patients with Acute Myeloid Leukemia. Cancer Discov, 2020. 10(4): p. 536–551. - PMC - PubMed

MeSH terms