. 2024 Jul 1;327(1):H155-H181.
doi: 10.1152/ajpheart.00041.2024. Epub 2024 May 24.

Innervation of adipocytes is limited in mouse perivascular adipose tissue

Affiliations

Innervation of adipocytes is limited in mouse perivascular adipose tissue

Marie Hanscom et al. Am J Physiol Heart Circ Physiol. .

Abstract

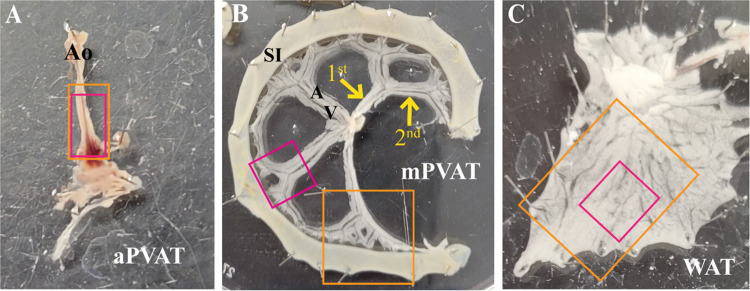
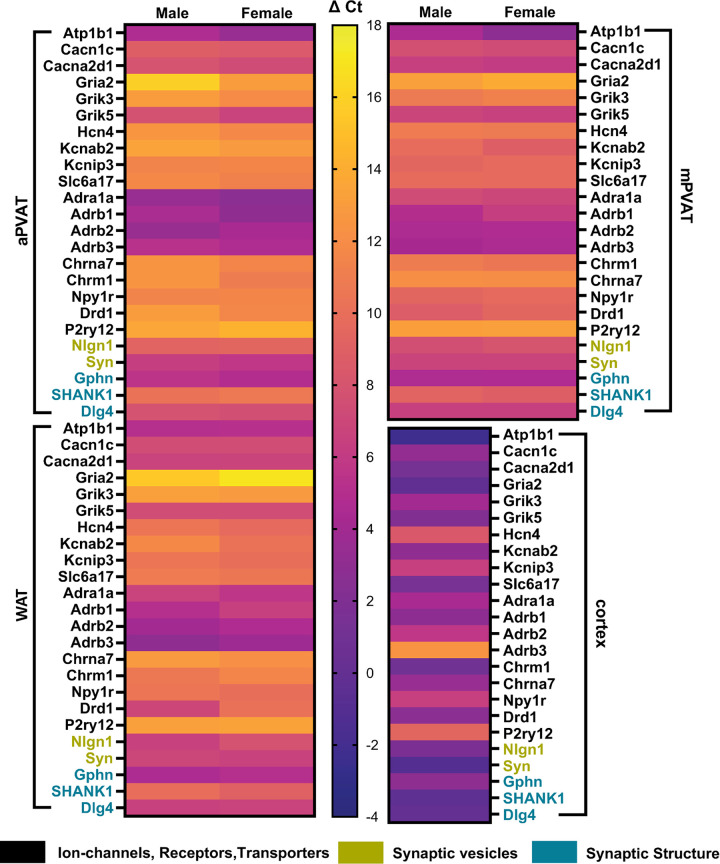
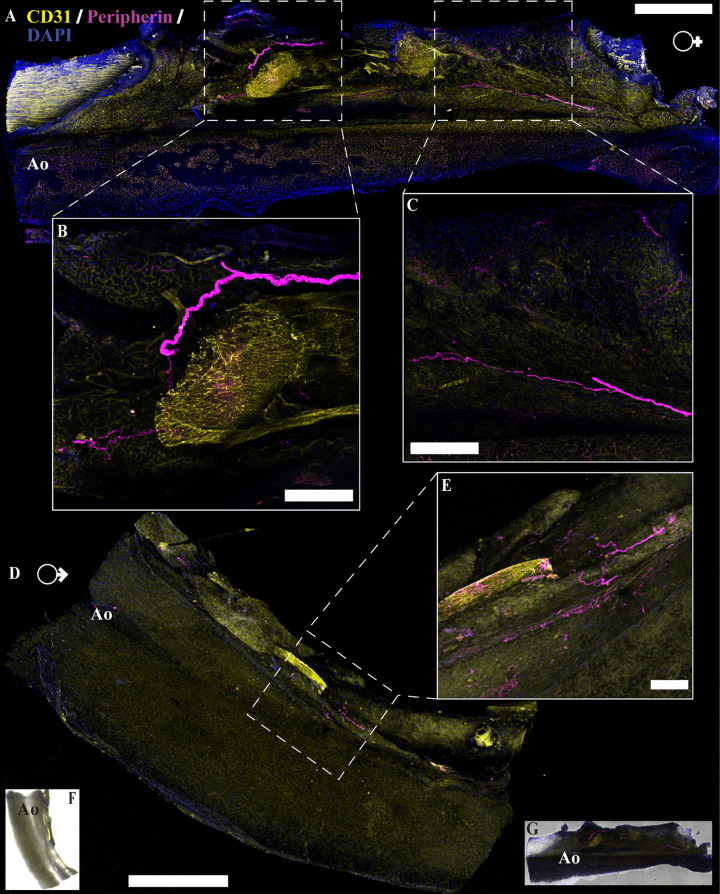
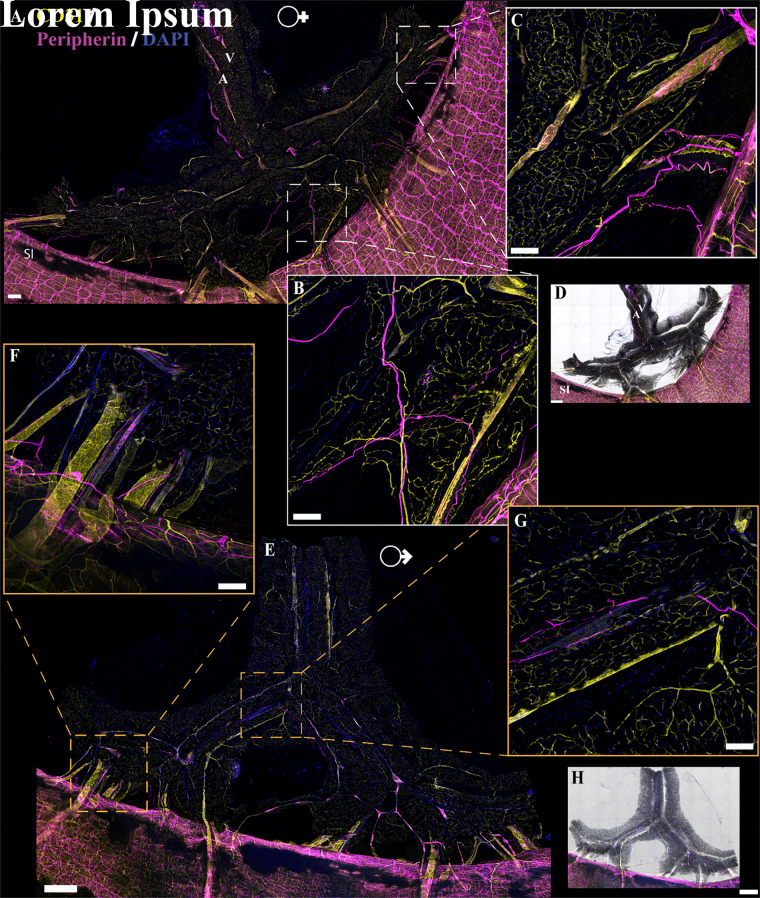
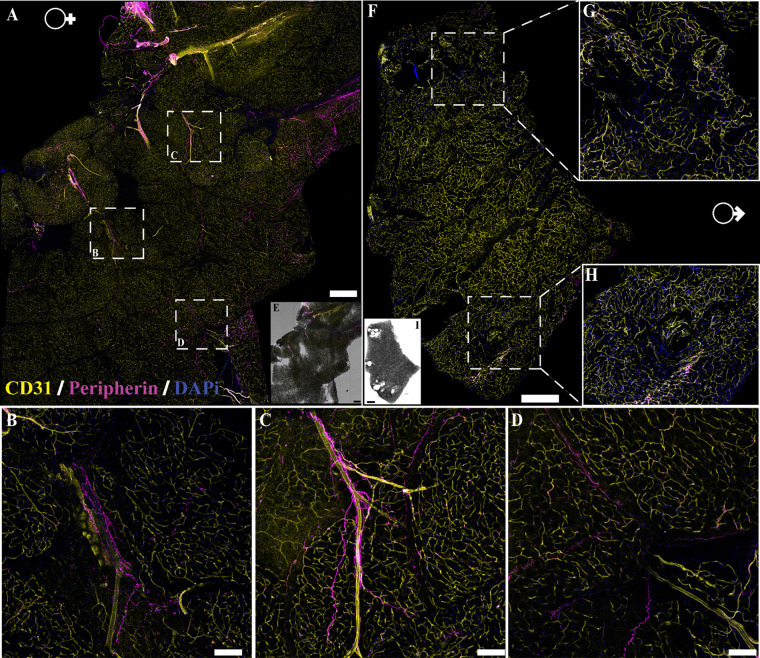
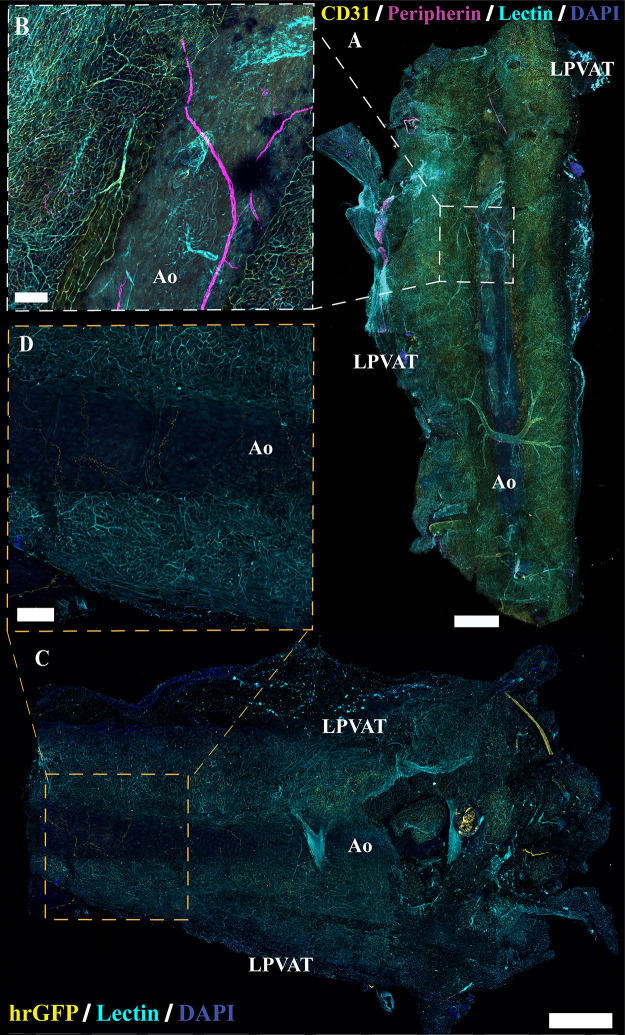
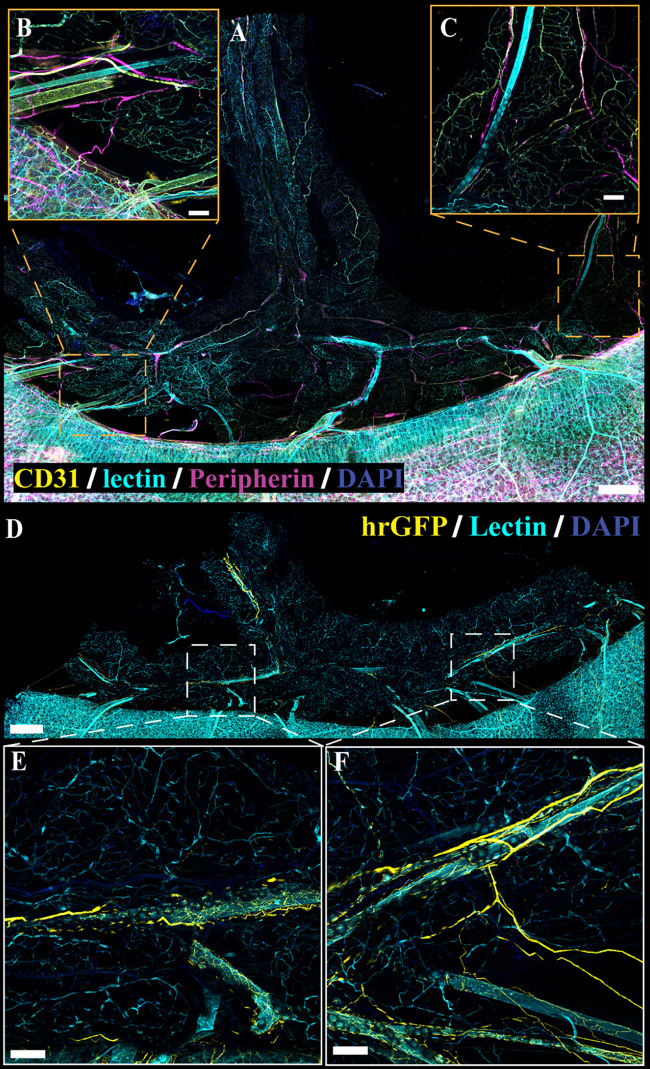
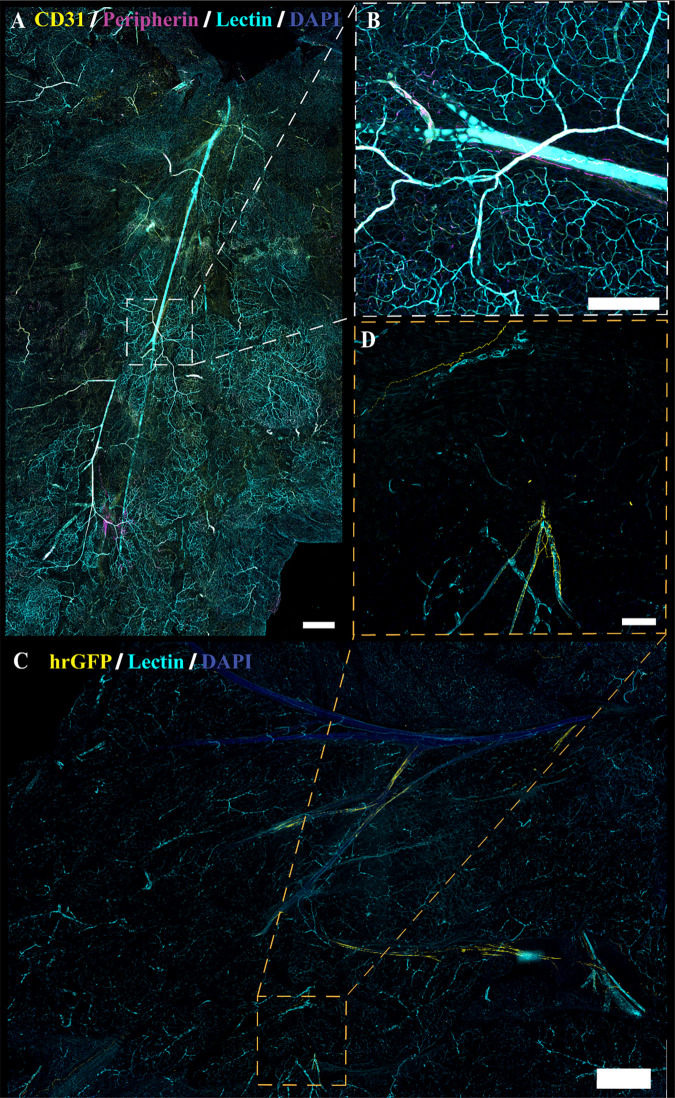
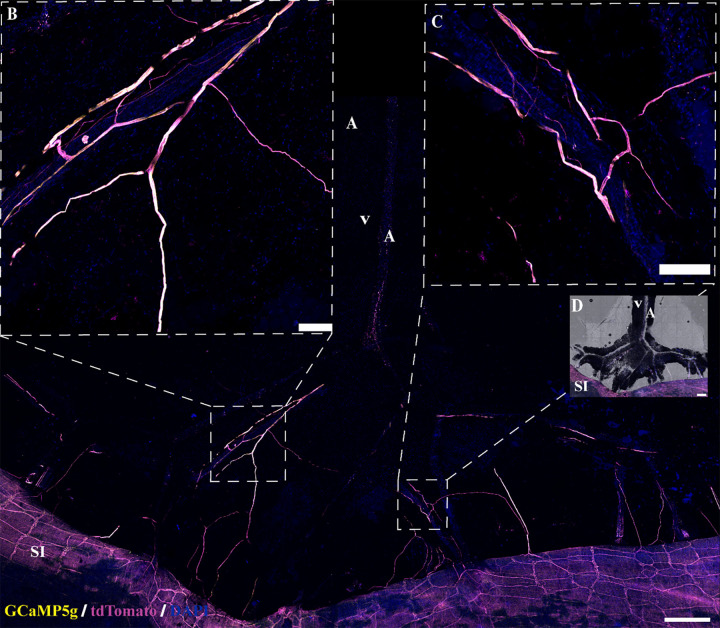
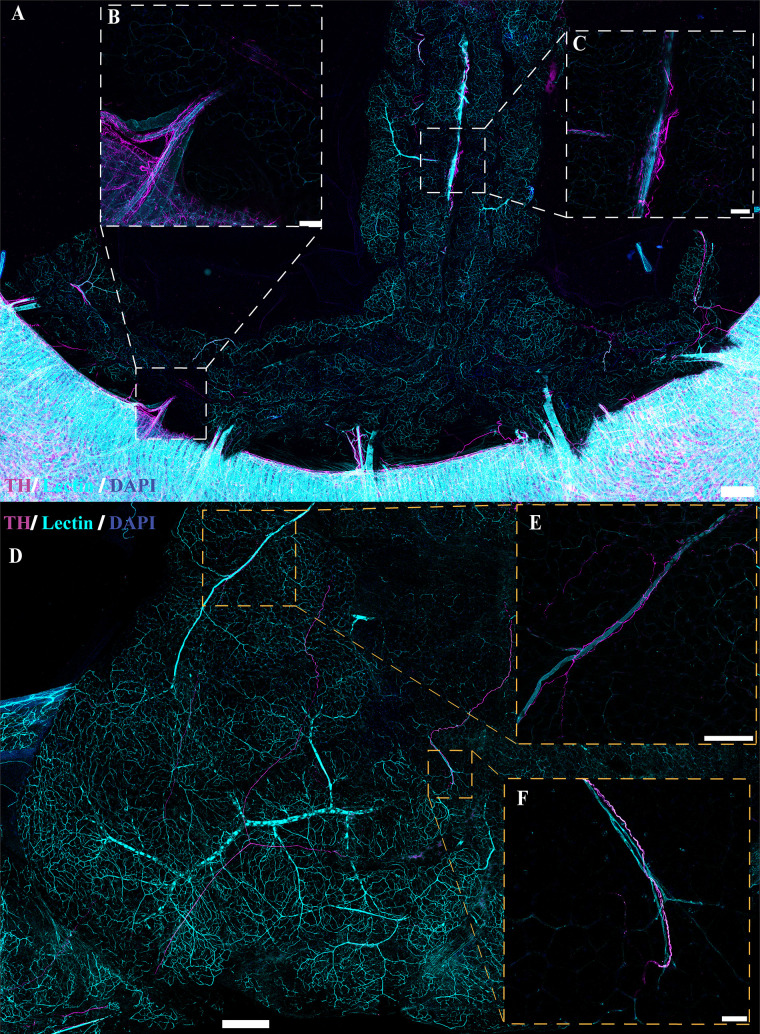
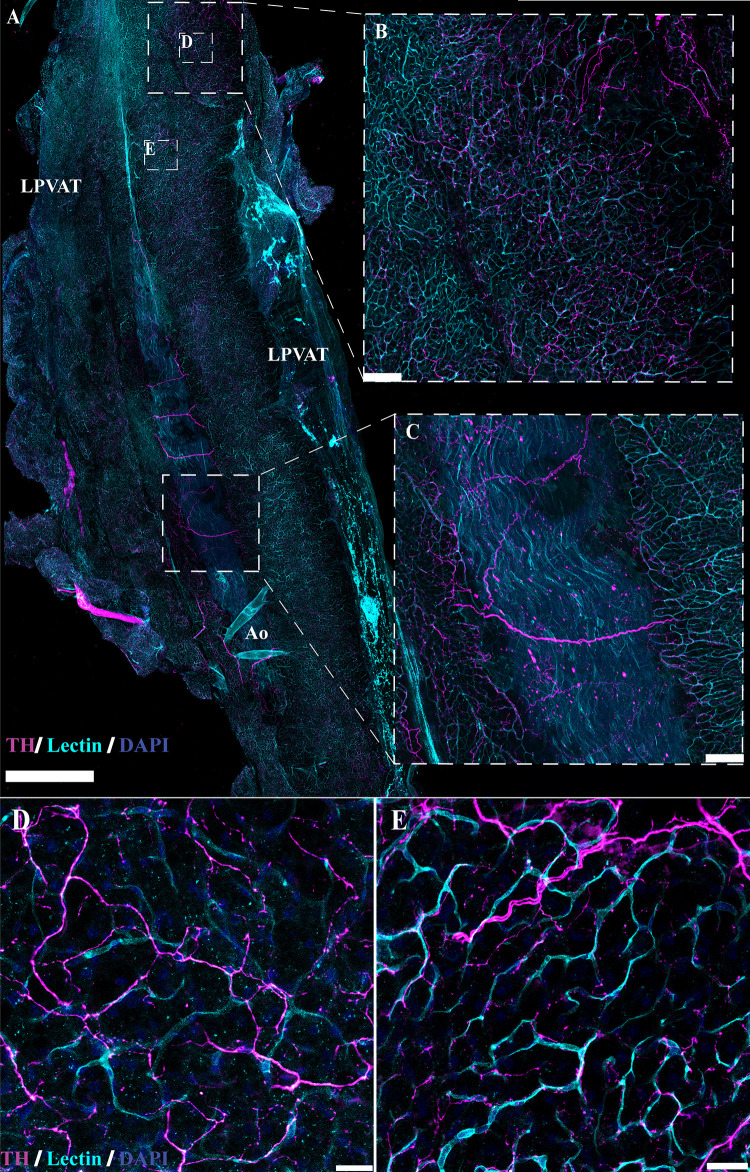
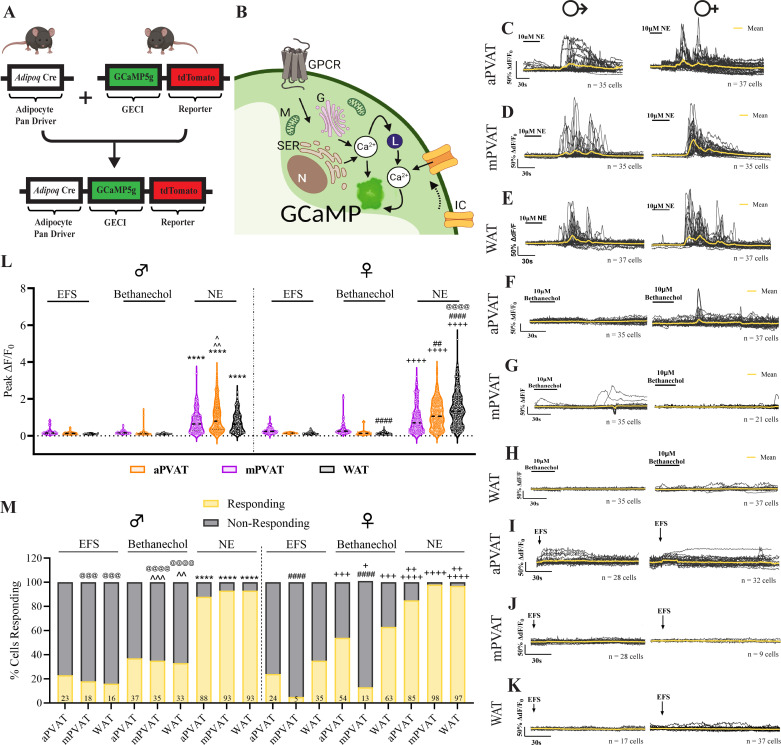
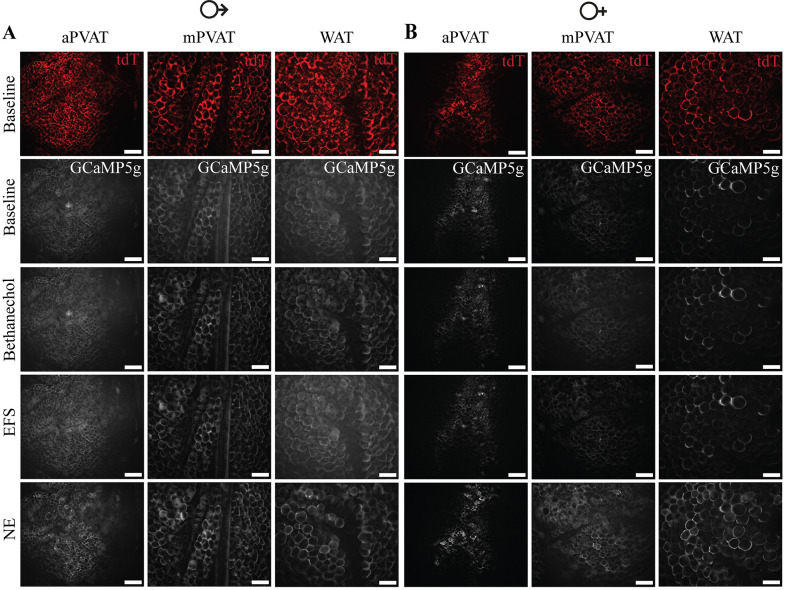
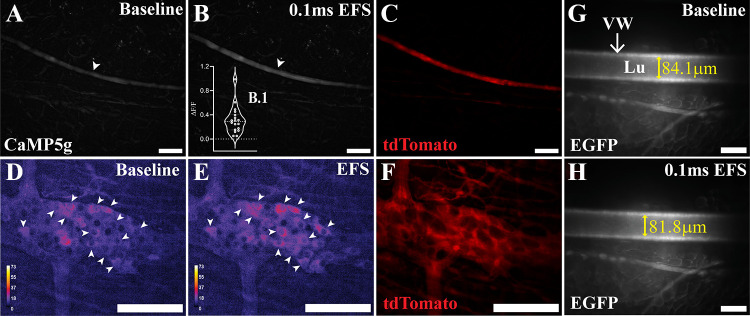
Perivascular adipose tissue (PVAT) regulates vascular tone by releasing anticontractile factors. These anticontractile factors are driven by processes downstream of adipocyte stimulation by norepinephrine; however, whether norepinephrine originates from neural innervation or other sources is unknown. The goal of this study was to test the hypothesis that neurons innervating PVAT provide the adrenergic drive to stimulate adipocytes in aortic and mesenteric perivascular adipose tissue (aPVAT and mPVAT), and white adipose tissue (WAT). Healthy male and female mice (8-13 wk) were used in all experiments. Expression of genes associated with synaptic transmission were quantified by qPCR and adipocyte activity in response to neurotransmitters and neuron depolarization was assessed in AdipoqCre+;GCaMP5g-tdTf/WT mice. Immunostaining, tissue clearing, and transgenic reporter lines were used to assess anatomical relationships between nerves and adipocytes. Although synaptic transmission component genes are expressed in adipose tissues (aPVAT, mPVAT, and WAT), strong nerve stimulation with electrical field stimulation does not significantly trigger calcium responses in adipocytes. However, norepinephrine consistently elicits strong calcium responses in adipocytes from all adipose tissues studied. Bethanechol induces minimal adipocyte responses. Imaging neural innervation using various techniques reveals that nerve fibers primarily run alongside blood vessels and rarely branch into the adipose tissue. Although nerve fibers are associated with blood vessels in adipose tissue, they demonstrate limited anatomical and functional interactions with adjacent adipocytes, challenging the concept of classical innervation. These findings dispute the significant involvement of neural input in regulating PVAT adipocyte function and emphasize alternative mechanisms governing adrenergic-driven anticontractile functions of PVAT.NEW & NOTEWORTHY This study challenges prevailing views on neural innervation in perivascular adipose tissue (PVAT) and its role in adrenergic-driven anticontractile effects on vasculature. Contrary to existing paradigms, limited anatomical and functional connections were found between PVAT nerve fibers and adipocytes, underscoring the importance of exploring alternative mechanistic pathways. Understanding the mechanisms involved in PVAT's anticontractile effects is critical for developing potential therapeutic interventions against dysregulated vascular tone, hypertension, and cardiovascular disease.

Keywords: adipocytes; innervation; perivascular adipose tissue.


Conflict of interest statement

No conflicts of interest, financial or otherwise, are declared by the authors.

Figures

Figure 1.
Figure 1.
Tissue dissection for molecular and imaging studies. Schematic of adipose tissue dissection for ex vivo live calcium imaging and immunofluorescence in the aortic perivascular adipose tissue (aPVAT; A), mesenteric perivascular adipose tissue (mPVAT; B), and white adipose tissue (WAT; C). Orange boxes are representative of dissected tissue taken for immunofluorescent staining. Magenta boxes are representative of tissue dissected for ex vivo live calcium imaging. Primary and secondary branching of the vasculature in the mPVAT is indicated by yellow arrows (B). Ao, aorta; A, artery; SI, small intestines; V, vein, 1st, primary branching; 2nd, secondary branching.
Figure 2.
Figure 2.
Expression of neurotransmission-associated gene in adipose tissue. Heat map illustrating relative expression levels for synaptic transmission-related genes in 3 regions of mouse adipose tissue: aortic perivascular adipose tissue (aPVAT), mesenteric perivascular adipose tissue (mPVAT), and white adipose tissue (WAT). Expression levels represented are the averaged change in cycle threshold (ΔCt) for each gene of interest (n = 3 per sex/adipose region). Selected genes included synaptic ion channels, receptors, and transporters (Atp1b1, Cacn1c, Cacna2d1, Gria2, Grik3, Grik5, Hcn4, Kcnab2, Kcnip3, Slc6a17, Adra1a, Adrb1, Adrb2, Adrb3, Chrm1, Chrna7, Npy1r, Drd1, P2ry12), as well as proteins involved in synaptic vesicle formation (Nlgn1, Syn1) and synapse structure (Gphn, SHANK1, Dlg4). Expression levels in a single female cortex were included as confirmation of qPCR. Color scale indicates relative gene expression levels, ranging from highest (ΔCt = −4) to lowest (ΔCt = 18).
Figure 3.
Figure 3.
Neural innervation in female and male mouse aortic perivascular adipose tissue (aPVAT). Immunofluorescent labeling of neuron fibers (anti-peripherin, magenta), vasculature (anti-CD31, yellow), and nuclei [4′,6-diamidino-2-phenylindole dihydrochloride (DAPI), blue] in female and male aPVAT. A: representative confocal large area scan of stained female aPVAT (scale bar, 500 mm). B and C: ×10 images of labeled nerve fibers in female aPVAT (scale bar = 100 mm). D: representative large area scan of stained male aPVAT (scale bar = 500 mm). E: ×10 image of labeled nerve fibers in male aPVAT (scale bar = 100 mm). F and G: brightfield overlay of the large area scans for male (F) and female (G) mice. Ao, aorta. Representative of 3 females/males.
Figure 4.
Figure 4.
Innervation in female and male mouse mesenteric perivascular adipose tissue (mPVAT). Immunofluorescent labeling of neuron fibers (peripherin, magenta), vasculature (CD31, yellow), and nuclei [4′,6-diamidino-2-phenylindole dihydrochloride (DAPI), blue] in female and male mPVAT. A: representative confocal large area scan of stained female mPVAT (scale bar = 500 mm). B and C: ×10 images of labeled nerve fibers in female mPVAT (scale bar = 100 mm). D: brightfield overlay of stained female mPVAT (A). E: representative large area scan of stained male mPVAT (scale bar = 500 mm). F and G: ×10 images of labeled nerve fibers in male aPVAT (scale bar = 100 mm). H: brightfield overlay of the large area scan for male mPVAT. A, artery; SI, small intestines; V, vein. Representative of 3 females/males.
Figure 5.
Figure 5.
Innervation of white adipose tissue (WAT). Immunofluorescent labeling of neuron fibers (peripherin, magenta), vasculature (CD31, yellow), and nuclei [4′,6-diamidino-2-phenylindole dihydrochloride (DAPI), blue] in female and male WAT. A: representative confocal large area scan of stained female WAT (scale bar = 500 mm). B–D: ×10 images of labeled nerve fibers in female WAT (scale bar = 100 mm). E: brightfield overlay of the large area scan for female WAT (A). F: representative large area scan of stained male WAT (scale bar = 500 mm). G and H: ×10 images of labeled nerve fibers in male WAT (scale bar = 100 mm). I: brightfield overlay of the large area scan for male mesenteric perivascular adipose tissue (mPVAT). Representative of 3 females/males.
Figure 6.
Figure 6.
Visualization of innervation in cleared AdipoqCre−;GCaMP5g-tdTfl/WT and noncleared NPY-GFP aortic perivascular adipose tissue (aPVAT). A: representative confocal large area scan of female AdipoqCre−;GCaMP5g-tdTfl/WT aPVAT cleared and stained with anti-peripherin (magenta), anti-CD31 (yellow), lectin-649 (cyan), and 4′,6-diamidino-2-phenylindole dihydrochloride (DAPI, blue) (scale bar = 500 mm). B: ×10 image of a single frame within the large area scan (A) depicting labeled nerve fibers and vasculature (scale bar = 100 mm). Representative confocal large area scan of aPVAT from female NPY-GFP mice expressing transgenically labeled NPY nerve fibers (yellow) and stained with lectin (cyan) and DAPI (blue, scale bar = 500 mm). D: ×10 image of a single frame within the NPY-GFP large area scan (C) depicting labeled nerve fibers and vasculature (scale bar = 100 mm). Representative of 2 females for cleared female AdipoqCre−;GCaMP5g-tdTfl/WT and 1 female for NPY-GFP mice. Ao, aorta; LPVAT, lateral PVAT.
Figure 7.
Figure 7.
Innervation in cleared AdipoqCre−;GCaMP5g-tdTfl/WT and noncleared NPY-GFP mesenteric perivascular adipose tissue (mPVAT). A: representative large area scan of cleared female AdipoqCre−;GCaMP5g-tdTfl/WT mPVAT stained with anti-peripherin (magenta), anti-CD31 (yellow), lectin-649 (cyan), and 4′,6-diamidino-2-phenylindole dihydrochloride (DAPI, blue) (scale bar = 500 mm). B and C: ×10 images of a single frame within the cleared mPVAT large area scan (A) depicting labeled nerve fibers and vasculature (scale bar = 100 mm). D: representative large area scan of noncleared mPVAT from female NPY-GFP mice expressing transgenic labeling of NPY nerve fibers (yellow) and stained with lectin (cyan) and DAPI (blue, scale bar = 500 mm). E and F: ×10 images of a single frame within the NPY-GFP large area scan (D) depicting labeled nerve fibers and vasculature (scale bar = 100 mm). Representative of 2 females for cleared female AdipoqCre−;GCaMP5g-tdTfl/WT and 1 female for NPY-GFP.
Figure 8.
Figure 8.
Neural innervation in cleared AdipoqCre−;GCaMP5g-tdTfl/WT and noncleared NPY-GFP white adipose tissue (WAT). A: representative large area scan of cleared female AdipoqCre−;GCaMP5g-tdTfl/WT WAT stained with anti-peripherin (magenta), anti-CD31 (yellow), lectin (cyan), and 4′,6-diamidino-2-phenylindole dihydrochloride (DAPI, blue) (scale bar = 500 mm). B: ×10 image of a single frame within the cleared WAT large area scan (A) depicting labeled nerve fibers and vasculature (scale bar = 100 mm). Representative large area scan of noncleared WAT from female NPY-GFP mice expressing transgenic labeling of NPY nerve fibers (yellow) and stained with lectin (cyan) and DAPI (blue, scale bar = 500 mm). D: ×10 image of a single frame within the NPY-GFP large area scan (C) depicting labeled nerve fibers and vasculature (scale bar = 100 mm). Representative of 2 females for cleared female AdipoqCre−;GCaMP5g-tdTfl/WT and 1 female for NPY-GFP.
Figure 9.
Figure 9.
Neural innervation in mesenteric perivascular adipose tissue (mPVAT) in additional transgenic mouse models. Transgenic expression of fluorescent proteins in nerves present in the mPVAT in Wnt1Cre+:GCaMPtdTf/Wt female mice. Traditional immunofluorescence with 4′,6-diamidino-2-phenylindole dihydrochloride (DAPI) counterstaining and without vascular staining was used. A: representative confocal large area scan of mPVAT from Wnt1Cre+:GCaMPtdTf/Wt female mice expressing tdTomato and GCaMP5g expression in nerve fibers, counterstained with DAPI (scale bar = 500 mm, n = 3 females). B and C: ×10 images of single frames within the Wnt1Cre+:GCaMPtdTf/Wt large area scan depicting labeled nerve fibers and nuclei (scale bar = 100 mm). D: brightfield overlay of mPVAT obtained from transgenic Wnt1Cre+:GCaMPtdTf/Wt female mice expressing tdTomato and GCaMP5g in nerve fibers and counterstained with DAPI (A). A, artery; SI, small intestines; V, vein. Representative of 3 females.
Figure 10.
Figure 10.
Sympathetic innervation in cleared AdipoqCre−;GCaMP5g-tdTfl/WT mesenteric perivascular adipose tissue (mPVAT) and white adipose tissue (WAT). TH, tyrosine hydroxylase. A: representative confocal large area scan of cleared female AdipoqCre−;GCaMP5g-tdTfl/WT mPVAT stained with anti-TH (magenta), lectin (cyan), and 4′,6-diamidino-2-phenylindole dihydrochloride (DAPI, blue) (scale bar = 500 mm). B and C: ×10 image of a single frame within the cleared mPVAT large area scan (A) depicting labeled nerve fibers and vasculature (scale bar = 100 mm). D: representative confocal large area scan of cleared female AdipoqCre−;GCaMP5g-tdTfl/WT WAT stained with anti-TH (magenta), lectin (cyan), and DAPI (blue) (scale bar = 500 mm). E: ×10 image of a single frame within the cleared WAT large area scan (D) depicting labeled nerve fibers and vasculature (scale bar = 100 mm). F: ×20 image of a single frame within the cleared WAT large area scan (D) depicting labeled nerve fibers and vasculature (scale bar = 50 mm). Representative of 2 females.
Figure 11.
Figure 11.
Sympathetic innervation in cleared AdipoqCre−;GCaMP5g-tdTfl/WT aortic perivascular adipose tissue (aPVAT). TH, tyrosine hydroxylase. A: representative confocal large area scan of cleared female AdipoqCre−;GCaMP5g-tdTfl/WT aPVAT stained with anti-TH (magenta), lectin (cyan), and 4′,6-diamidino-2-phenylindole dihydrochloride (DAPI, blue) (scale bar = 1,000 mm). B and C: ×10 image of a single frame within the cleared aPVAT large area scan (A) depicting labeled nerve fibers and vasculature (scale bar = 100 mm). D and E: ×40 image of a single frame within the cleared aPVAT large area scan (A) depicting labeled nerve fibers and vasculature (scale bar = 25 mm). Ao, aorta; LP, lateral PVAT. Representative of 2 females.
Figure 12.
Figure 12.
Adipocytes are not functionally regulated by neural input. A: AdipoqCre+;GCaMPtdTf/Wt mice express the genetically encoded calcium indicator, GCaMP5g, and reporter protein, tdTomato, under control of the adipocyte pan driver, adiponectin. B: schematic depicting adipocyte activation involving increased cytoplasmic Ca2+ release from G protein-coupled receptor or ion channel activation. C–E: representative traces of male and female adipocyte responses (ΔF/F0) to bath application of 10 mM norepinephrine (NE) in aortic perivascular adipose tissue (aPVAT), mesenteric perivascular adipose tissue (mPVAT), and white adipose tissue (WAT), respectively (n = 17–37 cells). F–H: representative traces of male and female adipocyte responses to bath application of 10 mM bethanechol in aPVAT, mPVAT, and WAT, respectively (n = 21–37 cells). I–K: representative traces depicting male and female adipocyte responses to electrical field stimulation (EFS) (+100 V, 0.1 ms, 10 Hz, 1 pulse) in aPVAT, mPVAT, and WAT, respectively (n = 9–37 cells). L: quantification of peak adipocyte responses (peak ΔF/F0) to electrical field stimulation (EFS), bethanechol, and NE in male and female aPVAT, mPVAT, and WAT (n = 164–294 cells from 3 animals per experimental group). M: percentage of cells responding to EFS, bethanechol, and NE stimulation in male and female aPVAT, mPVAT, and WAT (n = 164–294 cells from 3 animals per experimental group). Statistical analyses was as follows: L: 3-way ANOVA, Tukey’s post hoc: ****P < 0.0001, male aPVAT NE vs. male aPVAT EFS and male aPVAT bethanechol, male mPVAT NE vs. male mPVAT EFS and male mPVAT bethanechol, male WAT NE vs. male WAT EFS and male WAT bethanechol. ^P = 0.0241, male mPVAT NE vs. male aPVAT NE. ^^P = 0.0021, male mPVAT NE vs. male WAT NE; ++++P < 0.0001 female aPVAT NE vs. female aPVAT EFS and female aPVAT bethanechol, female mPVAT NE vs. female mPVAT EFS and female mPVAT bethanechol, female WAT NE vs. female WAT EFS and female WAT bethanechol. ##P = 0.0011, female mPVAT NE vs. female aPVAT NE. ####P < 0.0001, female WAT NE vs. female aPVAT NE and female mPVAT NE, female aPVAT bethanechol vs. female WAT bethanechol. @@@@P < 0.0001, female WAT NE vs. male WAT NE. M: Fisher’s exact test, ^^P = 0.0015, male WAT EFS vs. male WAT bethanechol. ^^^P = 0.0002, male mPVAT EFS vs. male mPVAT bethanechol. ****P < 0.0001, male aPVAT NE vs. male aPVAT EFS and male aPVAT bethanechol, mPVAT NE vs. male mPVAT EFS and male mPVAT bethanechol, male WAT NE vs. male WAT EFS and male WAT bethanechol. +P = 0.0377, female mPVAT EFS vs. female mPVAT bethanechol. ++P = 0.0094, female aPVAT bethanechol vs. female aPVAT NE, ++P = 0.0015 female WAT bethanechol vs. female WAT NE, +++P = 0.0002 female aPVAT EFS vs. female aPVAT bethanechol, female WAT EFS vs. female WAT bethanechol; ++++P < 0.0001 female aPVAT NE vs. female aPVAT EFS bethanechol, female mPVAT NE vs. female mPVAT EFS and female mPVAT bethanechol, female WAT NE vs. female WAT EFS; ####P < 0.0001 female mPVAT EFS vs. female aPVAT EFS and female WAT EFS, female mPVAT bethanechol vs. female aPVAT bethanechol and female WAT bethanechol; @@@@P < 0.0001 male mPVAT bethanechol vs. female mPVAT bethanechol, male WAT bethanechol vs. female WAT bethanechol, @@@P = 0.0006 male WAT EFS vs. female WAT EFS, @@@P = 0.0001 male WAT bethanechol vs. female WAT bethanechol. G, Golgi; GECI, genetically encoded Ca2+ indicator; GPCR, G protein-coupled receptor; IC, ion channel; L, Lysosome; Lu, lumen; M, mitochondria; N, nucleus; Ser, smooth endoplasmic reticulum; VW, vessel wall. Images created with a licensed version of BioRender.com.
Figure 13.
Figure 13.
Transgenic expression of reporter protein, tdTomato (tdT), and genetically encoded calcium indicator, GCaMP5g, in adipocytes of AdipoqCre+;GCaMPtdTf/Wt transgenic mice. A and B: representative images of aortic perivascular adipose tissue (aPVAT), mesenteric perivascular adipose tissue (mPVAT), and white adipose tissue (WAT) from male (A) and female (B) AdipoqCre+;GCaMPtdTf/Wt mice demonstrating the expression of the reporter protein tdTomato and the genetically encoded calcium indicator, GCaMP5g, in mesenteric adipocytes (scale bar = 100 µm). Representative images of calcium responses in male (A) and female (B) mice to stimulation with 10 µM bethanechol, electrical field stimulation (EFS, +100 V, 0.1 ms, 10 Hz, 1 pulse), and 10 µM norephinephrine (NE).
Figure 14.
Figure 14.
Confirmation of electrical field stimulation. A–C: confirmation of electrical field stimulation (EFS) by imaging nerve fiber responses in the mesenteric perivascular adipose tissue (mPVAT) from Wnt1Cre+;GCaMPtdTf/WT mice (n = 3 males). A: representative image of baseline calcium activity in nerve fibers (white arrowhead) in the mPVAT (scale bar = 100 µM). B: representative image of nerve fiber responses to EFS (+100 V, 0.1 ms, 10 Hz, scale bar = 100 µM). C: representative image of tdTomato expression in nerves within the mPVAT of Wnt1Cre+;GCaMPtdTf/WT. D and F: confirmation of EFS by imaging neuron responses in the colon from Wnt1Cre+;GCaMPtdTf/WT mice (n = 1 female). D: baseline calcium activity in neurons (white arrowheads) in the circular myenteric plexus (scale bar = 100 mm). E: response of neurons to EFS (+100 V, 0.1 ms, 10 Hz, scale bar = 100 mm). Color scale indicates intensity of responses. F: expression of reporter protein tdTomato in neurons (scale bar = 100 mm). G and H: confirmation of EFS in enhanced green fluorescent protein (EGFP)-labeled vasculature in mPVAT from AdipoqCre+;RC-L-hMD3qf/Wt mice (n = 3 females). G: representative measurement of artery diameter in unstimulated mPVAT (84.1 mm, scale bar = 100 mm). H: representative decrease in artery diameter in response to EFS (+100 V, 0.1 ms, 10 Hz; 81.8 mm; scale bar = 100 mm).

Comment in

Similar articles

Cited by

References

    1. Mills KT, Bundy JD, Kelly TN, Reed JE, Kearney PM, Reynolds K, Chen J, He J. Global disparities of hypertension prevalence and control: a systematic analysis of population-based studies from 90 countries. Circulation 134: 441–450, 2016. doi: 10.1161/CIRCULATIONAHA.115.018912. - DOI - PMC - PubMed
    1. Eldholm RS, Persson K, Barca ML, Knapskog A-B, Cavallin L, Engedal K, Selbaek G, Skovlund E, Saltvedt I. Association between vascular comorbidity and progression of Alzheimer’s disease: a two-year observational study in Norwegian memory clinics. BMC Geriatr 18: 120, 2018. doi: 10.1186/s12877-018-0813-4. - DOI - PMC - PubMed
    1. Vasan RS, Song RJ, Xanthakis V, Beiser A, DeCarli C, Mitchell GF, Seshadri S. Hypertension-mediated organ damage: prevalence, correlates, and prognosis in the community. Hypertension 79: 505–515, 2022. doi: 10.1161/HYPERTENSIONAHA.121.18502. - DOI - PMC - PubMed
    1. Cohuet G, Struijker-Boudier H. Mechanisms of target organ damage caused by hypertension: therapeutic potential. Pharmacol Ther 111: 81–98, 2006. doi: 10.1016/j.pharmthera.2005.09.002. - DOI - PubMed
    1. Lorius N, Locascio JJ, Rentz DM, Johnson KA, Sperling RA, Viswanathan A, Marshall GA; Alzheimer’s Disease Neuroimaging Initiative. Vascular disease and risk factors are associated with cognitive decline in the Alzheimer’s disease spectrum. Alzheimer Dis Assoc Disord 29: 18–25, 2015. doi: 10.1097/WAD.0000000000000043. - DOI - PMC - PubMed

Publication types

LinkOut - more resources