. 2024 May 1;65(5):38.
doi: 10.1167/iovs.65.5.38.

Improving Understanding of Visual Snow by Quantifying its Appearance and Effect on Vision

Affiliations

Improving Understanding of Visual Snow by Quantifying its Appearance and Effect on Vision

Cassandra J Brooks et al. Invest Ophthalmol Vis Sci. .

Abstract

Purpose: Visual snow is the hallmark of the neurological condition visual snow syndrome (VSS) but the characteristics of the visual snow percept remain poorly defined. This study aimed to quantify its appearance, interobserver variability, and effect on measured visual performance and self-reported visual quality.

Methods: Twenty-three participants with VSS estimated their visual snow dot size, separation, luminance, and flicker rate by matching to a simulation. To assess whether visual snow masks vision, we compared pattern discrimination thresholds for textures that were similar in spatial scale to visual snow as well as more coarse than visual snow, in participants with VSS, and with and without external noise simulating visual snow in 23 controls.

Results: Mean and 95% confidence intervals for visual snow appearance were: size (6.0, 5.8-6.3 arcseconds), separation (2.0, 1.7-2.3 arcmin), luminance (72.4, 58.1-86.8 cd/m2), and flicker rate (25.8, 18.9-32.8 frames per image at 120 hertz [Hz]). Participants with finer dot spacing estimates also reported greater visibility of their visual snow (τb = -0.41, 95% confidence interval [CI] = -0.62 to -0.13, P = 0.01). In controls, adding simulated fine-scale visual snow to textures increased thresholds for fine but not coarse textures (F(1, 22) = 4.98, P = 0.036, ηp2 = 0.19). In VSS, thresholds for fine and coarse textures were similar (t(22) = 0.54, P = 0.60), suggesting that inherent visual snow does not act like external noise in controls.

Conclusions: Our quantitative estimates of visual snow constrain its likely neural origins, may aid differential diagnosis, and inform future investigations of how it affects vision. Methods to quantify visual snow are needed for evaluation of potential treatments.


Conflict of interest statement

Disclosure: C.J. Brooks, None; Y.M. Chan, None; J. Fielding, None; O.B. White, None; D.R. Badcock, None; A.M. McKendrick, CentreVue iCare (F)

Figures

Figure 1.
Figure 1.
Illustration of the matching task quantifying visual snow appearance. The participant's own visual snow, readily visible on the black left side of the screen, was compared to simulated visual snow on the right that consisted of randomly placed white dots on a black background. This illustration is not to scale, as in the experiment the image was viewed from a remote distance. However, this illustration is designed to be viewed at the intended size from a typical reading distance, as the simulation may appear non-uniform due to aliasing when minified.
Figure 2.
Figure 2.
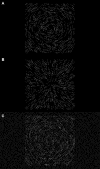
Illustration of fine textures for the customized test of visual interference. Participants discriminated between concentric and radial Glass patterns, shown sequentially in a randomized order. (A, B) Example fine textures without simulated visual snow, depicting a concentric (A) and radial (B) Glass pattern at 100% coherence on a uniform black background. (C) Example of a fine texture with external visual snow-like noise, consisting of a visual snow simulation superimposed on a 100% coherence concentric Glass pattern of the same spatial scale.
Figure 3.
Figure 3.
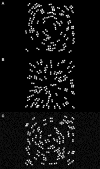
Illustration of coarse textures for the customized test of visual interference. Participants discriminated between concentric and radial Glass patterns, shown sequentially in a randomized order. (A, B) Example coarse textures without simulated visual snow, depicting a concentric (A) and radial (B) Glass pattern at 100% coherence on a uniform black background. (C) Example of a coarse texture with external visual snow-like noise, consisting of a visual snow simulation superimposed on a 100% coherence concentric Glass pattern that was much coarser in spatial scale.
Figure 4.
Figure 4.
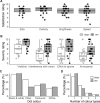
Quantitative estimates of visual snow appearance. Individual data (small grey circles), mean (large black circles), and 95% confidence intervals (error bars) for estimated (A) dot size in seconds of arc, (B) minimum separation between dots in minutes of arc, which is inversely related to perceived visual snow density, (C) dot luminance (cd/m2) and (D) number of frames per image of simulated visual snow, with corresponding flicker rate shown on the alternate y axis.
Figure 5.
Figure 5.
Repeat quantification of visual snow appearance in a single individual. The quantification task was repeated on 10 different days (every Monday and Thursday for 5 consecutive weeks) in the morning (grey symbols) and afternoon (black symbols) to obtain estimates for visual snow dot size (A), separation (B), luminance (C), and frames per image (D). Morning and afternoon sessions were approximately 5 hours apart, commencing within +/− 15 minutes of 9:30 AM and 2:30 PM. Parameter estimates were obtained using the procedure described in the methods and are plotted on the same scale as group data in Figure 4 (note +20 upwards shift in the y axis of panel D to capture range).
Figure 6.
Figure 6.
Questionnaire results. (A) Match satisfaction ratings, spanning responses from simulated visual snow that matched their own visual snow not at all (0) to an exact match (10), for each appearance dimension considered in isolation. (B) Perceived severity ratings for each questionnaire item, with higher values indicating greater severity, for habitual visual snow in bright lighting (white filled boxes) and dim lighting (grey filled boxes). Box plots show the median (line), interquartile range (box), whiskers (extending to values within 1.5 times the interquartile range), and individual data (circles). (C) Percentage of participants reporting static in each color category in bright and dim lighting. (D) Percentage of participants reporting single or multiple static color types in bright and dim lighting.
Figure 7.
Figure 7.
Performance on the customized test of visual interference. Log thresholds for discriminating global form for fine and coarse textures for (A) controls with and without external noise simulating visual snow and (B) VSS with textures individualized to their visual snow. Log spread of the psychometric function, which is inversely related to discrimination precision, for (C) controls with and without external noise simulating visual snow and (D) VSS with textures individualized to their visual snow. Mean (large symbols), 95% confidence intervals (error bars), and individual data (small symbols) are shown as diamonds in controls (left panels), colored dark blue for the conditions without simulated visual snow and light blue for conditions with simulated visual snow, and as red circles for participants with VSS (right panels).

References

    1. Schankin CJ, Maniyar FH, Digre KB, Goadsby PJ.. “Visual snow” - a disorder distinct from persistent migraine aura. Brain. 2014; 137(5): 1419–1428. - PubMed
    1. Solly EJ, Clough M, Foletta P, White OB, Fielding J.. The psychiatric symptomology of visual snow syndrome. Front Neurol. 2021; 12: 703006. - PMC - PubMed
    1. Hu KS, Martindale C, Cortez MM, Digre KB.. Visual quality of life in patients with visual snow syndrome. Cephalalgia. 2021; 41(Suppl 1): 95.
    1. Graber M, Scutelnic A, Klein A, Puledda F, Goadsby PJ, Schankin CJ.. Natural course of visual snow syndrome: a long-term follow-up study. Brain Commun. 2022; 4(5): fcac230. - PMC - PubMed
    1. Puledda F, Vandenbussche N, Moreno-Ajona D, Eren O, Schankin C, Goadsby PJ.. Evaluation of treatment response and symptom progression in 400 patients with visual snow syndrome. Br J Ophthalmol. 2022; 106(9): 1318–1324. - PMC - PubMed

Supplementary concepts