

Transcriptomic and proteomic analysis of the virulence inducing effect of ciprofloxacin on enterohemorrhagic Escherichia coli
- PMID: 38787890
- PMCID: PMC11125564
- DOI: 10.1371/journal.pone.0298746
Transcriptomic and proteomic analysis of the virulence inducing effect of ciprofloxacin on enterohemorrhagic Escherichia coli
Abstract
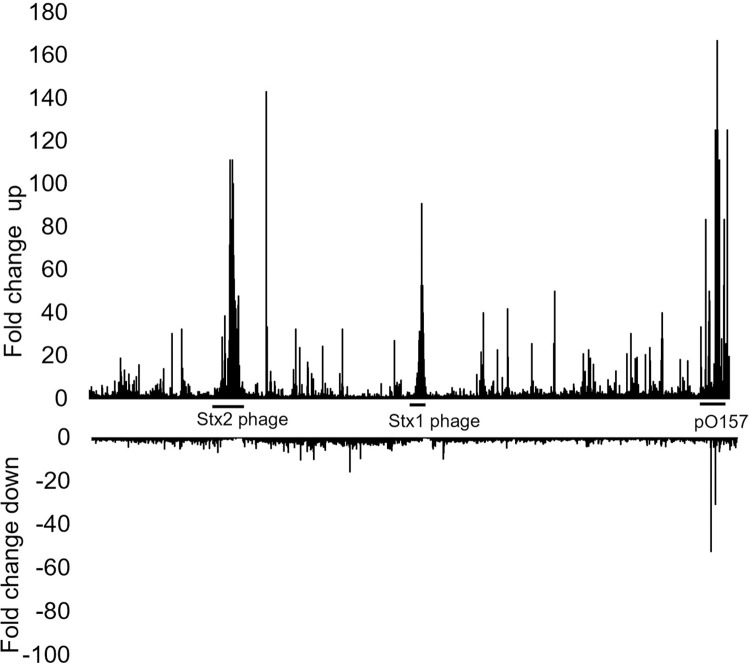
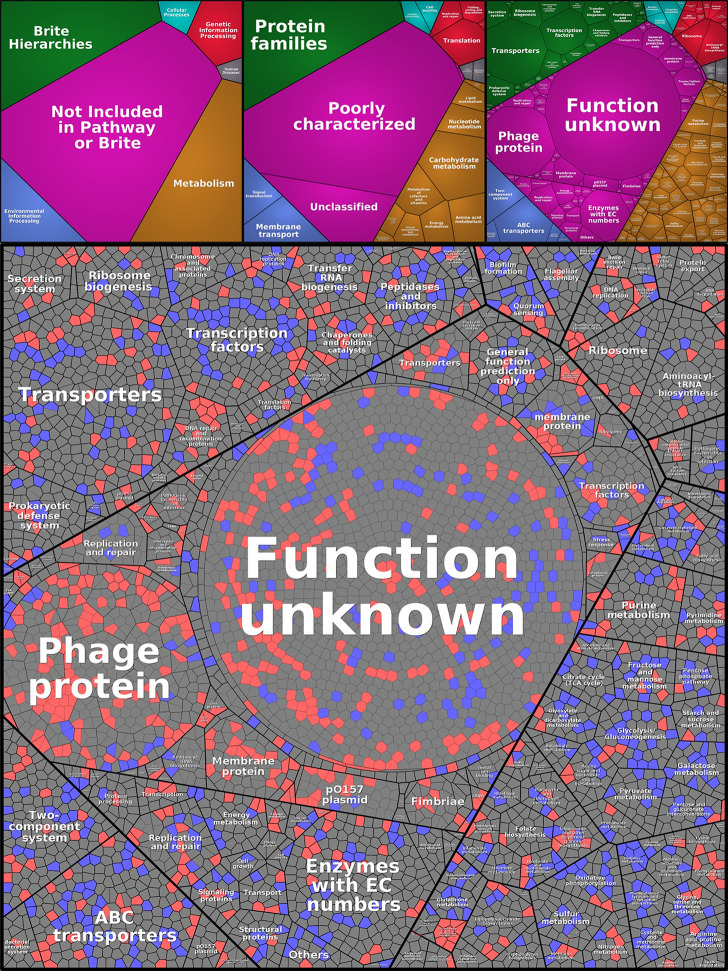
Enterohemorrhagic E. coli (EHEC) is considered to be the most dangerous pathotype of E. coli, as it causes severe conditions such as hemorrhagic colitis (HC) and hemolytic uremic syndrome (HUS). Antibiotic treatment of EHEC infections is generally not recommended since it may promote the production of the Shiga toxin (Stx) and lead to worsened symptoms. This study explores how exposure to the fluoroquinolone ciprofloxacin reorganizes the transcriptome and proteome of EHEC O157:H7 strain EDL933, with special emphasis on virulence-associated factors. As expected, exposure to ciprofloxacin caused an extensive upregulation of SOS-response- and Stx-phage proteins, including Stx. A range of other virulence-associated factors were also upregulated, including many genes encoded by the LEE-pathogenicity island, the enterohemolysin gene (ehxA), as well as several genes and proteins involved in LPS production. However, a large proportion of the genes and proteins (17 and 8%, respectively) whose expression was upregulated upon ciprofloxacin exposure (17 and 8%, respectively) are not functionally assigned. This indicates a knowledge gap in our understanding of mechanisms involved in EHECs response to antibiotic-induced stress. Altogether, the results contribute to better understanding of how exposure to ciprofloxacin influences the virulome of EHEC and generates a knowledge base for further studies on how EHEC responds to antibiotic-induced stress. A deeper understanding on how EHEC responds to antibiotics will facilitate development of novel and safer treatments for EHEC infections.
Copyright: © 2024 Kijewski et al. This is an open access article distributed under the terms of the Creative Commons Attribution License, which permits unrestricted use, distribution, and reproduction in any medium, provided the original author and source are credited.
Conflict of interest statement
The authors have declared that no competing interests exist.
Figures


Similar articles
-
Bacteriophage Transcription Factor Cro Regulates Virulence Gene Expression in Enterohemorrhagic Escherichia coli.Cell Host Microbe. 2018 May 9;23(5):607-617.e6. doi: 10.1016/j.chom.2018.04.007. Cell Host Microbe. 2018. PMID: 29746832 Free PMC article.
-
Vitamin K Analogs Influence the Growth and Virulence Potential of Enterohemorrhagic Escherichia coli.Appl Environ Microbiol. 2020 Nov 24;86(24):e00583-20. doi: 10.1128/AEM.00583-20. Print 2020 Nov 24. Appl Environ Microbiol. 2020. PMID: 32769190 Free PMC article.
-
Phytochemicals Controlling Enterohemorrhagic Escherichia coli (EHEC) Virulence-Current Knowledge of Their Mechanisms of Action.Int J Mol Sci. 2025 Jan 4;26(1):381. doi: 10.3390/ijms26010381. Int J Mol Sci. 2025. PMID: 39796236 Free PMC article. Review.
-
Critical roles for stx2, eae, and tir in enterohemorrhagic Escherichia coli-induced diarrhea and intestinal inflammation in infant rabbits.Infect Immun. 2003 Dec;71(12):7129-39. doi: 10.1128/IAI.71.12.7129-7139.2003. Infect Immun. 2003. PMID: 14638803 Free PMC article.
-
Shiga toxin in enterohemorrhagic E.coli: regulation and novel anti-virulence strategies.Front Cell Infect Microbiol. 2012 Jun 7;2:81. doi: 10.3389/fcimb.2012.00081. eCollection 2012. Front Cell Infect Microbiol. 2012. PMID: 22919672 Free PMC article. Review.
Cited by
-
Excess A-subunits of Shiga toxin 2a are produced in enterohemorrhagic Escherichia coli.Sci Rep. 2025 May 14;15(1):16712. doi: 10.1038/s41598-025-01342-2. Sci Rep. 2025. PMID: 40368985 Free PMC article.
-
Use of transcriptomics and genomics to assess the effect of disinfectant exposure on the survival and resistance of Escherichia coli O157:H7, a human pathogen.Front Microbiol. 2024 Oct 23;15:1477683. doi: 10.3389/fmicb.2024.1477683. eCollection 2024. Front Microbiol. 2024. PMID: 39507346 Free PMC article.
References
MeSH terms
Substances
LinkOut - more resources
Full Text Sources
Research Materials
Miscellaneous
