Metabolite profiling of human renal cell carcinoma reveals tissue-origin dominance in nutrient availability
- PMID: 38787918
- PMCID: PMC11126308
- DOI: 10.7554/eLife.95652
Metabolite profiling of human renal cell carcinoma reveals tissue-origin dominance in nutrient availability
Abstract
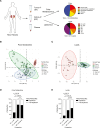
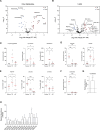
The tumor microenvironment is a determinant of cancer progression and therapeutic efficacy, with nutrient availability playing an important role. Although it is established that the local abundance of specific nutrients defines the metabolic parameters for tumor growth, the factors guiding nutrient availability in tumor compared to normal tissue and blood remain poorly understood. To define these factors in renal cell carcinoma (RCC), we performed quantitative metabolomic and comprehensive lipidomic analyses of tumor interstitial fluid (TIF), adjacent normal kidney interstitial fluid (KIF), and plasma samples collected from patients. TIF nutrient composition closely resembles KIF, suggesting that tissue-specific factors unrelated to the presence of cancer exert a stronger influence on nutrient levels than tumor-driven alterations. Notably, select metabolite changes consistent with known features of RCC metabolism are found in RCC TIF, while glucose levels in TIF are not depleted to levels that are lower than those found in KIF. These findings inform tissue nutrient dynamics in RCC, highlighting a dominant role of non-cancer-driven tissue factors in shaping nutrient availability in these tumors.
Keywords: cancer; cancer biology; human; metabolism; tumor microenvironment.
Plain language summary
Cancer cells convert nutrients into energy differently compared to healthy cells. This difference in metabolism allows them to grow and divide more quickly and sometimes to migrate to different areas of the body. The environment around cancer cells – known as the tumor microenvironment – contains a variety of different cells and blood vessels, which are bathed in interstitial fluid. This microenvironment provides nutrients for the cancer cells to metabolize, and therefore influences how well a tumor grows and how it might respond to treatment. Recent advances with techniques such as mass spectrometry, which can measure the chemical composition of a substance, have allowed scientists to measure nutrient levels in the tumor microenvironments of mice. However, it has been more difficult to conduct such studies in humans, as well as to compare the tumor microenvironment to the healthy tissue the tumors arose from. Abbott, Ali, Reinfeld et al. aimed to fill this gap in knowledge by using mass spectrometry to measure the nutrient levels in the tumor microenvironment of 55 patients undergoing surgery to remove kidney tumors. Comparing the type and levels of nutrients in the tumor interstitial fluid, the neighboring healthy kidney and the blood showed that nutrients in the tumor and healthy kidney were more similar to each other than those in the blood. For example, both the tumor and healthy kidney interstitial fluids contained less glucose than the blood. However, the difference between nutrient composition in the tumor and healthy kidney interstitial fluids was insignificant, suggesting that the healthy kidney and its tumor share a similar environment. Taken together, the findings indicate that kidney cancer cells must adapt to the nutrients available in the kidney, rather than changing what nutrients are available in the tissue. Future studies will be required to investigate whether this finding also applies to other types of cancer. A better understanding of how cancer cells adapt to their environments may aid the development of drugs that aim to disrupt the metabolism of tumors.
© 2024, Abbott, Ali, Reinfeld et al.
Conflict of interest statement
KA, AA, BR, AD, SS, ML, RH, KY, TK, KC, JK, MM, KB, CL, CC, AM, WR, JR No competing interests declared, CN Royalty and income from Cambridge Epigenetix and ThermoFisher and stock in Opko Health, RJ Consultant/SAB fees from Cur, DynamiCure, Elpis, SPARC, SynDevRx; owns equity in Accurius, Enlight, SynDevRx; served on the Board of Trustees of Tekla Healthcare Investors, Tekla Life Sciences Investors, Tekla Healthcare Opportunities Fund, Tekla World Healthcare Fund, and received Research Grants from Boehringer Ingelheim and Sanofi; no funding or reagents from these organizations were used in the study, MV Scientific advisor for Agios Pharmaceuticals, iTeos Therapeutics, Sage Therapeutics, Pretzel Therapeutics, Lime Therapeutics, Faeth Therapeutics, Droia Ventures, and Auron Therapeutics
Figures


Update of
-
Metabolite profiling of human renal cell carcinoma reveals tissue-origin dominance in nutrient availability.bioRxiv [Preprint]. 2024 Apr 8:2023.12.24.573250. doi: 10.1101/2023.12.24.573250. bioRxiv. 2024. Update in: Elife. 2024 May 24;13:RP95652. doi: 10.7554/eLife.95652. PMID: 38187626 Free PMC article. Updated. Preprint.
References
-
- Abbott KL, Ali A, Casalena D, Do BT, Ferreira R, Cheah JH, Soule CK, Deik A, Kunchok T, Schmidt DR, Renner S, Honeder SE, Wu M, Chan SH, Tseyang T, Stoltzfus AT, Michel SLJ, Greaves D, Hsu PP, Ng CW, Zhang CJ, Farsidjani A, Kent JR, Madariaga MLL, Gramatikov IMT, Matheson NJ, Lewis CA, Clish CB, Rees MG, Roth JA, Griner LM, Muir A, Auld DS, Vander Heiden MG. Screening in serum-derived medium reveals differential response to compounds targeting metabolism. Cell Chemical Biology. 2023;30:1156–1168. doi: 10.1016/j.chembiol.2023.08.007. - DOI - PMC - PubMed
-
- Apiz Saab JJ, Dzierozynski LN, Jonker PB, AminiTabrizi R, Shah H, Menjivar RE, Scott AJ, Nwosu ZC, Zhu Z, Chen RN, Oh M, Sheehan C, Wahl DR, Pasca di Magliano M, Lyssiotis CA, Macleod KF, Weber CR, Muir A. Pancreatic tumors exhibit myeloid-driven amino acid stress and upregulate arginine biosynthesis. eLife. 2023;12:e81289. doi: 10.7554/eLife.81289. - DOI - PMC - PubMed
MeSH terms
Substances
Grants and funding
- U01 CA224348/CA/NCI NIH HHS/United States
- P30 DK058404/DK/NIDDK NIH HHS/United States
- R01-CA208205/NH/NIH HHS/United States
- P30 CA014051/CA/NCI NIH HHS/United States
- Education Activity W81XWH-22-1-0418/Department of Defense
- U01-CA224348/NH/NIH HHS/United States
- F31 CA271787/CA/NCI NIH HHS/United States
- R35CA242379/CA/NCI NIH HHS/United States
- U01CA261842/NH/NIH HHS/United States
- P30 DK040561/DK/NIDDK NIH HHS/United States
- T32 GM007287/GM/NIGMS NIH HHS/United States
- R01 NS118929/NS/NINDS NIH HHS/United States
- F30CA247202/CA/NCI NIH HHS/United States
- R01 CA259253/CA/NCI NIH HHS/United States
- T32 CA009172/CA/NCI NIH HHS/United States
- R35 CA242379/CA/NCI NIH HHS/United States
- P30CA1405141/CA/NCI NIH HHS/United States
- R01-CA259253/NH/NIH HHS/United States
- T32GM007347/NH/NIH HHS/United States
- R01 CA269672/CA/NCI NIH HHS/United States
- U01 CA261842/CA/NCI NIH HHS/United States
- R01CA217987/CA/NCI NIH HHS/United States
- T32 GM007347/GM/NIGMS NIH HHS/United States
- R01 CA208205/CA/NCI NIH HHS/United States
- DGE-1122374/National Science Foundation
- F30 CA247202/CA/NCI NIH HHS/United States
- R01 CA217987/CA/NCI NIH HHS/United States
- F31CA271787/CA/NCI NIH HHS/United States
- R01-NS118929/NH/NIH HHS/United States
- T32GM007287/NH/NIH HHS/United States
- Medical Research Fellow/HHMI/Howard Hughes Medical Institute/United States
LinkOut - more resources
Full Text Sources
Medical
Miscellaneous

