. 2024 May 24;10(21):eadl5762.
doi: 10.1126/sciadv.adl5762. Epub 2024 May 24.

Longitudinal plasma proteomic analysis of 1117 hospitalized patients with COVID-19 identifies features associated with severity and outcomes

Affiliations

Longitudinal plasma proteomic analysis of 1117 hospitalized patients with COVID-19 identifies features associated with severity and outcomes

Arthur Viode et al. Sci Adv. .

Abstract

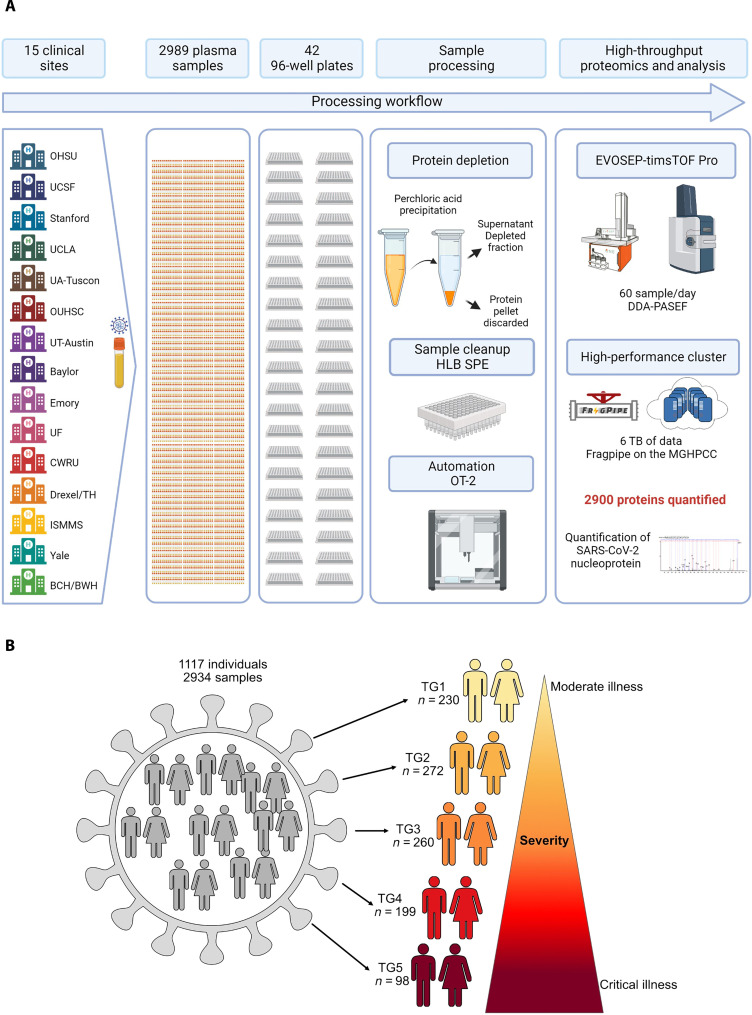
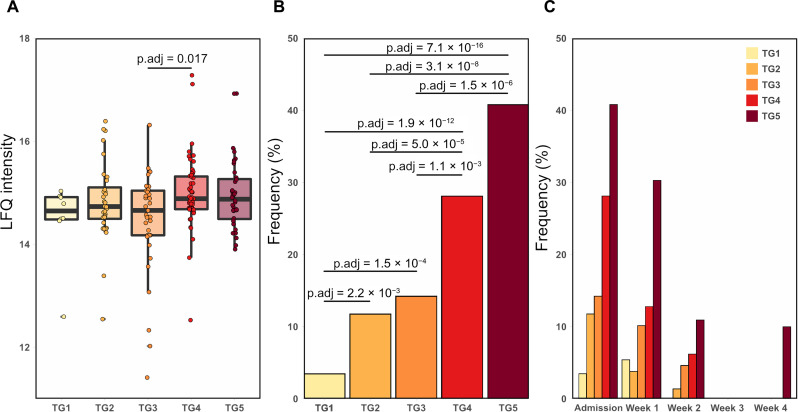
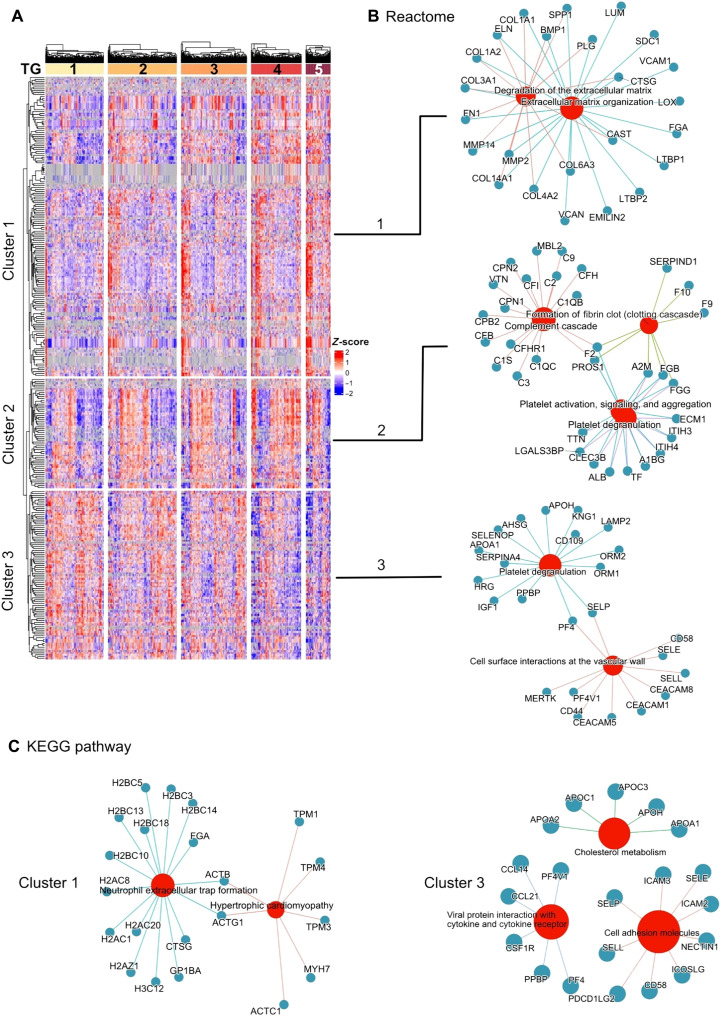
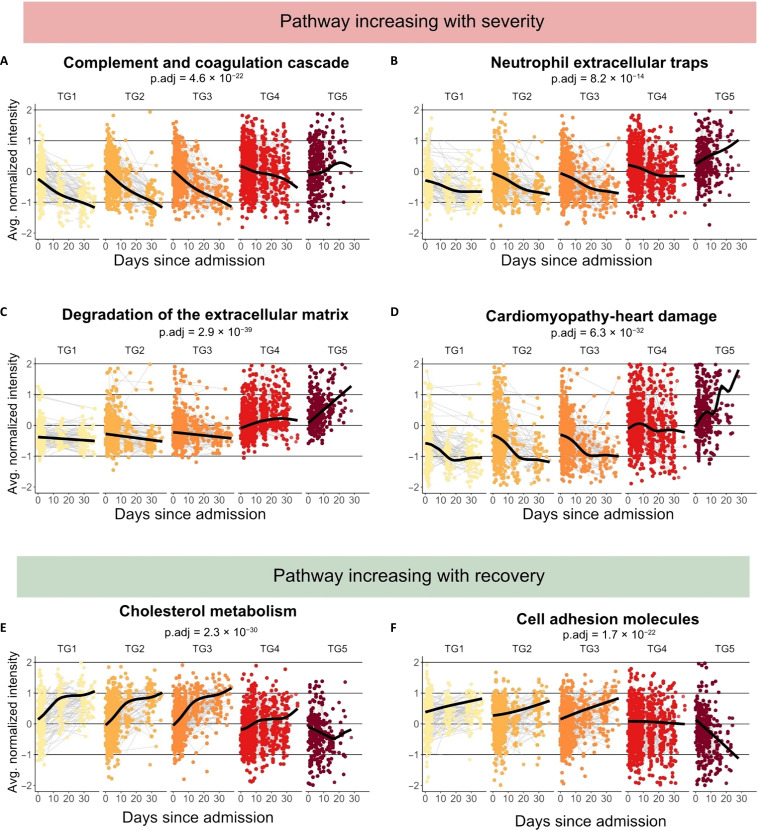
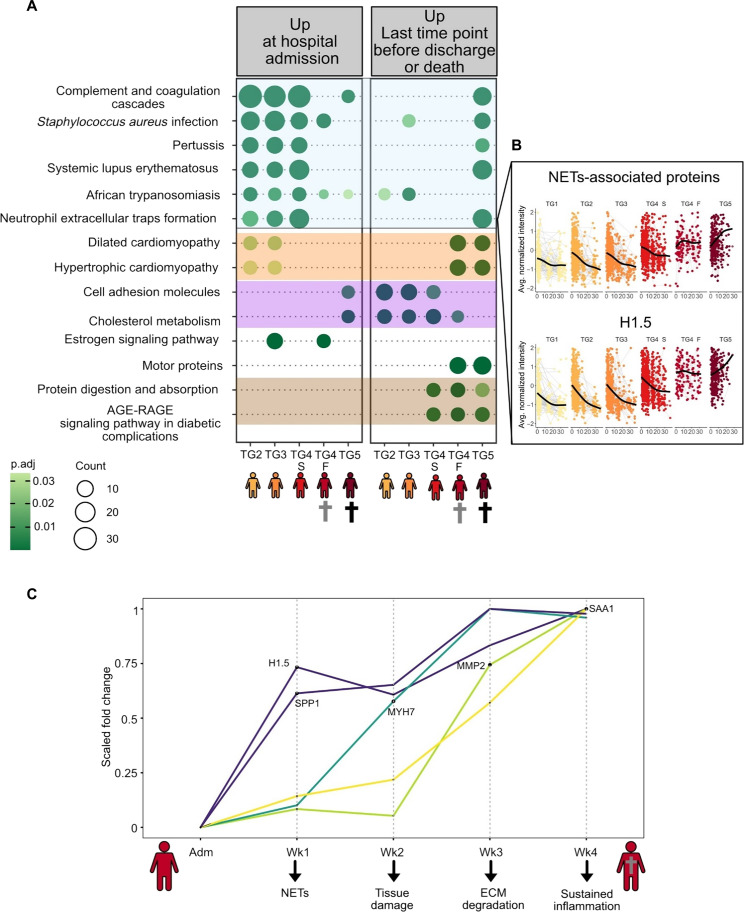
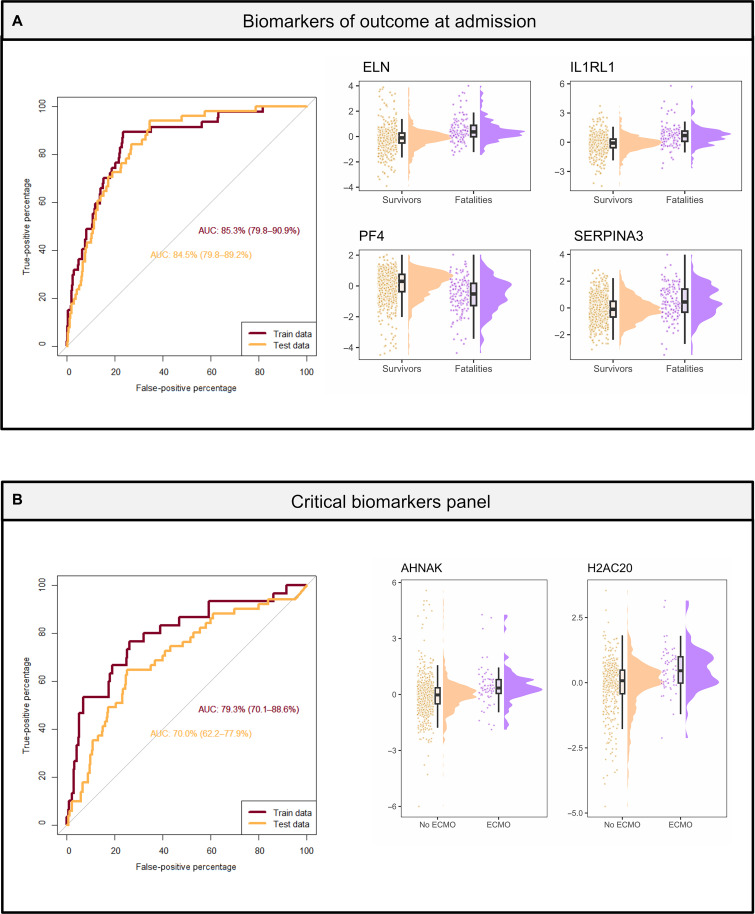
Severe acute respiratory syndrome coronavirus 2 (SARS-CoV-2) infection is characterized by highly heterogeneous manifestations ranging from asymptomatic cases to death for still incompletely understood reasons. As part of the IMmunoPhenotyping Assessment in a COVID-19 Cohort study, we mapped the plasma proteomes of 1117 hospitalized patients with COVID-19 from 15 hospitals across the United States. Up to six samples were collected within ~28 days of hospitalization resulting in one of the largest COVID-19 plasma proteomics cohorts with 2934 samples. Using perchloric acid to deplete the most abundant plasma proteins allowed for detecting 2910 proteins. Our findings show that increased levels of neutrophil extracellular trap and heart damage markers are associated with fatal outcomes. Our analysis also identified prognostic biomarkers for worsening severity and death. Our comprehensive longitudinal plasma proteomics study, involving 1117 participants and 2934 samples, allowed for testing the generalizability of the findings of many previous COVID-19 plasma proteomics studies using much smaller cohorts.


Figures

Fig. 1.
Fig. 1.. High-throughput LCMS–based method for the analysis of thousands of plasma samples and cohort design.
(A) Workflow: Perchloric acid plasma proteomic platform. (B) Individuals were categorized into five clinical TGs based on disease severity. TG1, TG2, TG3, TG4, and TG5 from moderate illness to critical illness. TG5 comprises individuals who died within 28 days of hospitalization.
Fig. 2.
Fig. 2.. Frequency of detection of SARS-CoV-2 NP in plasma was associated with COVID-19 severity.
(A) Boxplot of the Label-free quantification (LFQ) intensity of the N protein at admission. We performed a one-way analysis of variance (ANOVA) and found statistical differences with an adjusted P value of 0.034. A post hoc test was done, a statistical difference was found between TG3 versus TG4 (P value = 0.0172). (B) Frequency of SARS-CoV-2–derived NP at admission to the hospital for each TG. The frequency of NP detection for each TG was as follows: TG1 had 3% (8 of 230), TG2 12% (32 of 272), TG3 14% (37 of 260), TG4 28% (56 of 199), and TG5 41% (40 of 98). We applied a Fisher’s exact test to assess statistical differences between TGs. Frequency NCAP: statistically highly significant TG1/TG2 (Padj = 2.2 × 10⁻³), TG1/TG3 (Padj = 1.5 × 10⁻⁴), TG1/TG4 (Padj = 1.9 × 10⁻¹²), TG1/TG5 (Padj = 7.1 × 10⁻¹⁶), TG2/TG4 (Padj = 5.0 × 10⁻⁵), TG2/TG5 (Padj = 3.1 × 10⁻⁸), TG3/TG4 (Padj = 1.1 × 10⁻³), TG3/TG5 (Padj = 1.5 × 10⁻⁶). (C) Frequency of SARS-CoV-2–derived NP at admission to the hospital, week 1, week 2, week 3, and week 4 for each TG. At week 4, the NP was only observed in one individual belonging to TG5. No NP was observed after 4 weeks of hospitalization.
Fig. 3.
Fig. 3.. Immune response signatures at hospital admission differentiated between severity groups.
(A) Hierarchical clustering of the 305 proteins exhibiting differential abundances among the five TGs, based on one-way ANOVA. Each row represents a protein, and each cell represents the protein abundance (Z-scored) (the red represents an up-regulation; blue represents a down-regulation; gray represents missing values). Samples were ordered on the basis of increased severity from the mildest (TG1) to the most severe group (TG5). We observed three clusters. (B) Reactome pathway enrichment analysis. Cluster 1: enrichment for ECM organization and degradation of the ECM. Cluster 2: enriched for innate immune system, complement cascade, formation of fibrin clot (clotting cascade), and platelet degranulation. Cluster 3: enrichment for platelet degranulation and cell surface interaction at the vascular wall. (C) KEGG pathway enrichment analysis. Cluster 1: enrichment for NET formation and cardiomyopathies. Cluster 3: enrichment for cell adhesion molecules, viral protein interaction with cytokine and cytokine receptor, and cholesterol metabolism.
Fig. 4.
Fig. 4.. Longitudinal study of the pathways dysregulated at admission.
Time course analysis of selected biological pathways. A generalized additive model with mixed effects analysis to evaluate the effects of the TG was performed. Enrollment sites and individuals were considered random effects. TGs, age, and sex were considered as fixed effects. The TGs are plotted from mild (light yellow) to severe (dark red). We highlighted pathways increasing over time in TG5 and decreasing in the other TGs such as (A) complement and coagulation cascades, (B) NETs, (C) degradation of the ECM, and those associated with (D) cardiomyopathies. Pathways decreasing over time in TG5 and increasing in the other TGs were plotted: (E) cholesterol metabolism and (F) cell adhesion molecules. Corresponding P values can be found in table S2.
Fig. 5.
Fig. 5.. Death signature and collateral damage – sequence of events.
(A) Our analysis focused on comparison between the first and last time points collected per individual. For better understanding of proteomic signatures associated with death, we split TG4 into two subgroups: TG4 survivors (TG4-S) and TG4 fatalities (TG4-F). TG4-F represents those who eventually died within the study but only after the 28-day period. TG4-F included 32 individuals (16%) who died within TG4. In contrast, TG5 is uniquely composed of individuals who died within 28 days. A paired t test (first sample collected versus last sample collected) was performed for each TG. Significant proteins were subjected to KEGG pathway enrichment analysis. Significant pathways were plotted using the compareCluster function of Cluster Profiler. (B) Highlights the NETs-associated proteins pathway and the protein H1 to H5 belonging to that pathway. (C) Longitudinal changes between TG4-S and TG4-F were mapped. To do so, t tests were performed at admission, week 1, week 2, week 3, and week 4. We identified key proteins whose abundances are changing over time between TG4-S and TG4-F. The fold change was normalized for each protein from 0 to 1 (y axis). There are no significant differences at admission between TG4-S and TG4-F. As soon as the first week 1, H1.5 and SPP1 are up-regulated in TG4-F, then, MYH7 at week 2, MMP2 at week 3, and lastly, SAA1 at week 4.
Fig. 6.
Fig. 6.. Prognostic biomarkers upon admission for outcome including use of ECMO or invasive mechanical ventilation.
Predictive biomarkers at admission of outcome and escalation of care (receipt of ECMO or invasive mechanical ventilation). For both analysis, data were split into a train and test dataset. Both datasets are independent as samples were collected in different hospitals. The samples from the training dataset were collected at the following hospitals: UA-Tucson, Baylor, Boston/BWH, Case Western, OUHSC, UCLA, and Yale. The samples from the test dataset were collected at the following hospitals: Drexel/Tower Health, Emory, UF, ISMMS, OHSU, Stanford, UCSF, and UT Austin. (A) Panel of biomarkers for outcome with an AUROC value of 0.0.85 for the test dataset. Expression levels of the biomarker panel are composed of ELN, IL1RL1, PF4, and SERPINA3. (B) Panel of biomarkers for ECMO with an AUROC value of 0.77 for the test dataset. Expression levels of the biomarker panel are composed of AHNAK and H2AC20.

References

    1. Pascarella G., Strumia A., Piliego C., Bruno F., Del Buono R., Costa F., Scarlata S., Agro F. E., COVID-19 diagnosis and management: A comprehensive review. J. Intern. Med. 288, 192–206 (2020). - PMC - PubMed
    1. Shen B., Yi X., Sun Y., Bi X., Du J., Zhang C., Quan S., Zhang F., Sun R., Qian L., Ge W., Liu W., Liang S., Chen H., Zhang Y., Li J., Xu J., He Z., Chen B., Wang J., Yan H., Zheng Y., Wang D., Zhu J., Kong Z., Kang Z., Liang X., Ding X., Ruan G., Xiang N., Cai X., Gao H., Li L., Li S., Xiao Q., Lu T., Zhu Y., Liu H., Chen H., Guo T., Proteomic and metabolomic characterization of COVID-19 patient sera. Cell 182, 59–72.e15 (2020). - PMC - PubMed
    1. Wang Z., Cryar A., Lemke O., Tober-Lau P., Ludwig D., Helbig E. T., Hippenstiel S., Sander L. E., Blake D., Lane C. S., Sayers R. L., Mueller C., Zeiser J., Townsend S., Demichev V., Mulleder M., Kurth F., Sirka E., Hartl J., Ralser M., A multiplex protein panel assay for severity prediction and outcome prognosis in patients with COVID-19: An observational multi-cohort study. EClinicalMedicine 49, 101495 (2022). - PMC - PubMed
    1. Demichev V., Tober-Lau P., Lemke O., Nazarenko T., Thibeault C., Whitwell H., Rohl A., Freiwald A., Szyrwiel L., Ludwig D., Correia-Melo C., Aulakh S. K., Helbig E. T., Stubbemann P., Lippert L. J., Gruning N. M., Blyuss O., Vernardis S., White M., Messner C. B., Joannidis M., Sonnweber T., Klein S. J., Pizzini A., Wohlfarter Y., Sahanic S., Hilbe R., Schaefer B., Wagner S., Mittermaier M., Machleidt F., Garcia C., Ruwwe-Glosenkamp C., Lingscheid T., Bosquillon de Jarcy L., Stegemann M. S., Pfeiffer M., Jurgens L., Denker S., Zickler D., Enghard P., Zelezniak A., Campbell A., Hayward C., Porteous D. J., Marioni R. E., Uhrig A., Muller-Redetzky H., Zoller H., Loffler-Ragg J., Keller M. A., Tancevski I., Timms J. F., Zaikin A., Hippenstiel S., Ramharter M., Witzenrath M., Suttorp N., Lilley K., Mulleder M., Sander L. E.; PA-COVID-19 Study group, Ralser M., Kurth F., A time-resolved proteomic and prognostic map of COVID-19. Cell Syst. 12, 780–794.e7 (2021). - PMC - PubMed
    1. Shu T., Ning W., Wu D., Xu J., Han Q., Huang M., Zou X., Yang Q., Yuan Y., Bie Y., Pan S., Mu J., Han Y., Yang X., Zhou H., Li R., Ren Y., Chen X., Yao S., Qiu Y., Zhang D. Y., Xue Y., Shang Y., Zhou X., Plasma Proteomics Identify Biomarkers and Pathogenesis of COVID-19. Immunity 53, 1108–1122.e5 (2020). - PMC - PubMed