

Bioinformatics identification and validation of maternal blood biomarkers and immune cell infiltration in preeclampsia: An observational study
- PMID: 38788026
- PMCID: PMC11124706
- DOI: 10.1097/MD.0000000000038260
Bioinformatics identification and validation of maternal blood biomarkers and immune cell infiltration in preeclampsia: An observational study
Abstract
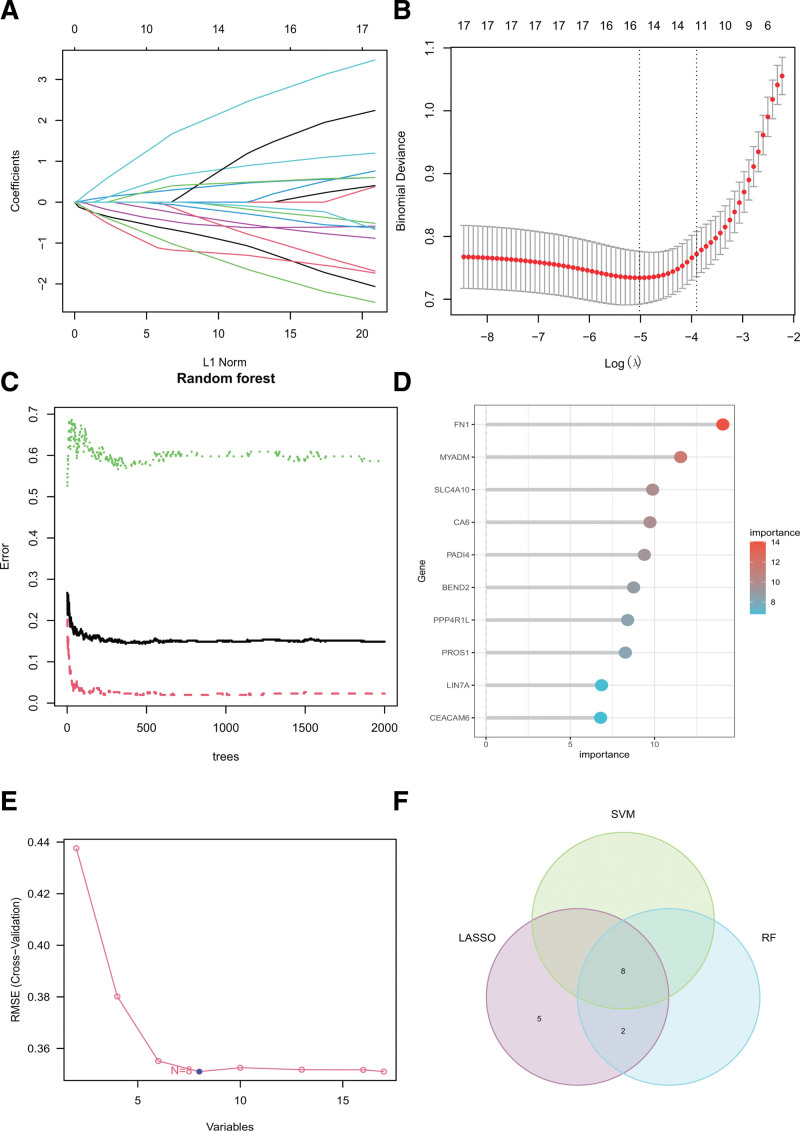
Preeclampsia (PE) is a pregnancy complication characterized by placental dysfunction. However, the relationship between maternal blood markers and PE is unclear. It is helpful to improve the diagnosis and treatment of PE using new biomarkers related to PE in the blood. Three PE-related microarray datasets were obtained from the Gene Expression Synthesis database. The limma software package was used to identify differentially expressed genes (DEGs) between PE and control groups. Least absolute shrinkage and selection operator regression, support vector machine, random forest, and multivariate logistic regression analyses were used to determine key diagnostic biomarkers, which were verified using clinical samples. Subsequently, functional enrichment analysis was performed. In addition, the datasets were combined for immune cell infiltration analysis and to determine their relationships with core diagnostic biomarkers. The diagnostic performance of key genes was evaluated using the receiver operating characteristic (ROC) curve, C-index, and GiViTi calibration band. Genes with potential clinical applications were evaluated using decision curve analysis (DCA). Seventeen DEGs were identified, and 6 key genes (FN1, MYADM, CA6, PADI4, SLC4A10, and PPP4R1L) were obtained using 3 types of machine learning methods and logistic regression. High diagnostic performance was found for PE through evaluation of the ROC, C-index, GiViti calibration band, and DCA. The 2 types of immune cells (M0 macrophages and activated mast cells) were significantly different between patients with PE and controls. All of these genes except SLC4A10 showed significant differences in expression levels between the 2 groups using quantitative reverse transcription-polymerase chain reaction. This model used 6 maternal blood markers to predict the occurrence of PE. The findings may stimulate ideas for the treatment and prevention of PE.
Copyright © 2024 the Author(s). Published by Wolters Kluwer Health, Inc.
Conflict of interest statement
The authors have no conflicts of interest to disclose.
Figures


References
-
- Melchiorre K, Sharma R, Thilaganathan B. Cardiovascular implications in preeclampsia: an overview. Circulation. 2014;130:703–14. - PubMed
-
- Garovic VD, Hayman SR. Hypertension in pregnancy: an emerging risk factor for cardiovascular disease. Nat Clin Pract Nephrol. 2007;3:613–22. - PubMed
-
- Tun C, Quiñones JN, Kurt A, et al. . Comparison of 12-hour urine protein and protein: creatinine ratio with 24-hour urine protein for the diagnosis of preeclampsia. Am J Obstet Gynecol. 2012;207:233.e1–8. - PubMed
Publication types
MeSH terms
Substances
LinkOut - more resources
Full Text Sources
Miscellaneous
