. 2024 Aug 27;8(16):4262-4275.
doi: 10.1182/bloodadvances.2023011594.

Low frequency of Vγ9Vδ2 T cells predicts poor survival in newly diagnosed acute myeloid leukemia

Affiliations

Low frequency of Vγ9Vδ2 T cells predicts poor survival in newly diagnosed acute myeloid leukemia

Anne-Charlotte Le Floch et al. Blood Adv. .

Abstract

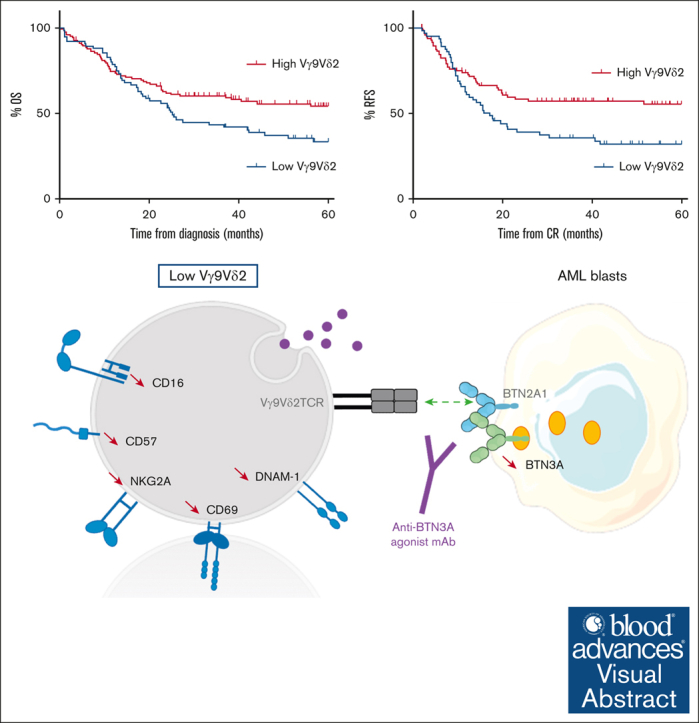
In several tumor subtypes, an increased infiltration of Vγ9Vδ2 T cells has been shown to have the highest prognostic value compared with other immune subsets. In acute myeloid leukemia (AML), similar findings have been based solely on the inference of transcriptomic data and have not been assessed with respect to confounding factors. This study aimed at determining, by immunophenotypic analysis (flow or mass cytometry) of peripheral blood from patients with AML at diagnosis, the prognostic impact of Vγ9Vδ2 T-cell frequency. This was adjusted for potential confounders (age at diagnosis, disease status, European LeukemiaNet classification, leukocytosis, and allogeneic hematopoietic stem cell transplantation as a time-dependent covariate). The cohort was composed of 198 patients with newly diagnosed (ND) AML. By univariate analysis, patients with lower Vγ9Vδ2 T cells at diagnosis had significantly lower 5-year overall and relapse-free survivals. These results were confirmed in multivariate analysis (hazard ratio [HR], 1.55 [95% confidence interval (CI), 1.04-2.30]; P = .030 and HR, 1.64 [95% CI, 1.06-2.53]; P = .025). Immunophenotypic alterations observed in patients with lower Vγ9Vδ2 T cells included a loss of some cytotoxic Vγ9Vδ2 T-cell subsets and a decreased expression of butyrophilin 3A on the surface of blasts. Samples expanded regardless of their Vγ9Vδ2 T-cell levels and displayed similar effector functions in vitro. This study confirms the prognostic value of elevated Vγ9Vδ2 T cells among lymphocytes in patients with ND AML. These results provide a strong rationale to consider consolidation protocols aiming at enhancing Vγ9Vδ2 T-cell responses.


Conflict of interest statement

Conflict-of-interest disclosure: D.O. is a cofounder and shareholder of ImCheck Therapeutics. The remaining authors declare no competing financial interests.

Figures

None
Graphical abstract
Figure 1.
Figure 1.
Univariate survival analysis according to the frequency of Vγ9Vδ2 T cells. (A-B) Threshold determination of Vγ9Vδ2 T cells among viable lymphocytes is determined using the optimal cut points, performed using the maximally selected log-rank statistics using the maxstat R package. For a given prognostic parameter, maxstat identifies the optimal cut point that best discriminates 2 patient groups (https://cran.r-project.org/web/packages/maxstat/index.html). The threshold of 0.75 % of Vγ9Vδ2 T cells among viable lymphocytes was selected for this study. (C-D) 5-y OS and 5-y RFS (n = 198 and 161, respectively) were estimated using the Kaplan-Meier method and compared between groups using the log-rank test.
Figure 2.
Figure 2.
Low Vγ9Vδ2 T-cell phenotype is associated with phenotypical changes. (A) Expression of surface Vγ9Vδ2 T-cell coreceptors in the FILO cohorts according to the frequency group of Vγ9Vδ2 T cells: percentage of cells positive for CD57 (n = 123), NKG2A (n = 116), DNAM-1 (n = 116), NKG2D (n = 115), and CD56 (n = 123). (B) Vγ9Vδ2 T cells from PBMCs of HVs and patients with AML from the HEMATOBIO cohort were manually pregated and exported in OMIQ for t-SNE analysis. Subsampling was performed for HVs and for each patient group with a fixed number of 100 000 Vγ9Vδ2 T cells for each group (HV, n = 8; patients with AML with low Vγ9Vδ2 T cells, n = 12; patients with AML with high Vγ9Vδ2 T cells, n = 7). Vγ9Vδ2 T cells were analyzed using t-the t-SNE dimensionality reduction algorithm. In the left panel, the density of Vγ9Vδ2 T-cell subsets in each patient group is projected (blue, low cell density; red, high cell density). The expression of markers of Vγ9Vδ2 T cells is projected onto t-SNE maps in the right panel (blue, low expression; red, high expression). (C-H) Maturation phenotype and expression of surface Vγ9Vδ2 T-cell coreceptors from PBMCs of HVs (n = 18) and patients with AML from the HEMATOBIO cohort (n = 40) according to the Vγ9Vδ2 T-cell frequency group (n = 20 in each group): (C) percentage of Vγ9Vδ2 T cells positive for NKG2A, CD57, DNAM-1, NKG2D, and CD56; (D) percentage of Vγ9Vδ2 T cells positive for CD16, CD69, CD8, CD28, and CD25; (E) maturation phenotype of Vγ9Vδ2 T cells according to the expression of CD45RA and CD27; (F) percentage of Vγ9Vδ2 T cells positive for OX40, 4-1BB, CD44, CCR7, and CD127; (G) percentage of Vγ9Vδ2 T cells positive for BTLA, TIGIT, PD-1, CTLA4, and TIM3; (H) percentage of Vγ9Vδ2 T cells positive for LAG3, HVEM, ICOS, PDL-1, CD95, and CD4. (I-J) BTN3A expression was assessed by flow cytometry on the surface of primary blasts from patients with AML (n = 27), the relative number of BTN3A molecules was quantified with MESF (molecules of equivalent soluble fluorochrome) method, using the anti-BTN3A 108.5 (I) and 20.1 epitopes (J). Results are presented as mean ± standard deviation (SD) (A, C-H) or as box plots (I-J), and statistical significance was established using a Mann-Whitney test (A), or a Kruskal-Wallis test followed by a Dunn's test (C-H), or a t test (I-J). ∗P < .5; ∗∗P < .01.
Figure 2.
Figure 2.
Low Vγ9Vδ2 T-cell phenotype is associated with phenotypical changes. (A) Expression of surface Vγ9Vδ2 T-cell coreceptors in the FILO cohorts according to the frequency group of Vγ9Vδ2 T cells: percentage of cells positive for CD57 (n = 123), NKG2A (n = 116), DNAM-1 (n = 116), NKG2D (n = 115), and CD56 (n = 123). (B) Vγ9Vδ2 T cells from PBMCs of HVs and patients with AML from the HEMATOBIO cohort were manually pregated and exported in OMIQ for t-SNE analysis. Subsampling was performed for HVs and for each patient group with a fixed number of 100 000 Vγ9Vδ2 T cells for each group (HV, n = 8; patients with AML with low Vγ9Vδ2 T cells, n = 12; patients with AML with high Vγ9Vδ2 T cells, n = 7). Vγ9Vδ2 T cells were analyzed using t-the t-SNE dimensionality reduction algorithm. In the left panel, the density of Vγ9Vδ2 T-cell subsets in each patient group is projected (blue, low cell density; red, high cell density). The expression of markers of Vγ9Vδ2 T cells is projected onto t-SNE maps in the right panel (blue, low expression; red, high expression). (C-H) Maturation phenotype and expression of surface Vγ9Vδ2 T-cell coreceptors from PBMCs of HVs (n = 18) and patients with AML from the HEMATOBIO cohort (n = 40) according to the Vγ9Vδ2 T-cell frequency group (n = 20 in each group): (C) percentage of Vγ9Vδ2 T cells positive for NKG2A, CD57, DNAM-1, NKG2D, and CD56; (D) percentage of Vγ9Vδ2 T cells positive for CD16, CD69, CD8, CD28, and CD25; (E) maturation phenotype of Vγ9Vδ2 T cells according to the expression of CD45RA and CD27; (F) percentage of Vγ9Vδ2 T cells positive for OX40, 4-1BB, CD44, CCR7, and CD127; (G) percentage of Vγ9Vδ2 T cells positive for BTLA, TIGIT, PD-1, CTLA4, and TIM3; (H) percentage of Vγ9Vδ2 T cells positive for LAG3, HVEM, ICOS, PDL-1, CD95, and CD4. (I-J) BTN3A expression was assessed by flow cytometry on the surface of primary blasts from patients with AML (n = 27), the relative number of BTN3A molecules was quantified with MESF (molecules of equivalent soluble fluorochrome) method, using the anti-BTN3A 108.5 (I) and 20.1 epitopes (J). Results are presented as mean ± standard deviation (SD) (A, C-H) or as box plots (I-J), and statistical significance was established using a Mann-Whitney test (A), or a Kruskal-Wallis test followed by a Dunn's test (C-H), or a t test (I-J). ∗P < .5; ∗∗P < .01.
Figure 3.
Figure 3.
Autologous expansion rates and functional capacities according to Vγ9Vδ2 T-cell phenotype. (A) PBMCs from patients with AML (n = 43) were cultured with 1 μM zoledronate (ZOL) plus 200 U/mL rhIL-2 and 10 μg/mL rhIL-15 for 14 days. (B) Degranulation of Vγ9Vδ2 T cells expanded from PBMCs of patients with AML (n = 23) against autologous blasts pretreated or not with ZOL 50 μM and with or without the agonist anti-BTN3A 20.1 mAb. Results are presented as box plots (A) or as mean ± SD (B), and the statistical significance was established using a Mann-Whitney test (A-B) or a Friedman test followed by a Dunn's test (B). ∗∗P < .01; ∗∗∗∗P < .0001.

References

    1. Vadakekolathu J, Minden MD, Hood T, et al. Immune landscapes predict chemotherapy resistance and immunotherapy response in acute myeloid leukemia. Sci Transl Med. 2020;12(546) - PMC - PubMed
    1. Ferraro F, Miller CA, Christensen KA, et al. Immunosuppression and outcomes in adult patients with de novo acute myeloid leukemia with normal karyotypes. Proc Natl Acad Sci U S A. 2021;118(49) - PMC - PubMed
    1. Khaldoyanidi S, Nagorsen D, Stein A, Ossenkoppele G, Subklewe M. Immune biology of acute myeloid leukemia: implications for immunotherapy. J Clin Orthod. 2021;39(5):419–432. - PMC - PubMed
    1. Brück O, Dufva O, Hohtari H, et al. Immune profiles in acute myeloid leukemia bone marrow associate with patient age, T cell receptor clonality, and survival. Blood Adv. 2020;4(2):274–286. - PMC - PubMed
    1. Williams P, Basu S, Garcia-Manero G, et al. The distribution of T-cell subsets and the expression of immune checkpoint receptors and ligands in patients with newly diagnosed and relapsed acute myeloid leukemia. Cancer. 2019;125(9):1470–1481. - PMC - PubMed

Publication types

Substances