. 2024 Jul 9;57(7):1514-1532.e15.
doi: 10.1016/j.immuni.2024.04.025. Epub 2024 May 23.

A RIPK1-specific PROTAC degrader achieves potent antitumor activity by enhancing immunogenic cell death

Affiliations

A RIPK1-specific PROTAC degrader achieves potent antitumor activity by enhancing immunogenic cell death

Jonathan Mannion et al. Immunity. .

Abstract

Receptor-interacting serine/threonine-protein kinase 1 (RIPK1) functions as a critical stress sentinel that coordinates cell survival, inflammation, and immunogenic cell death (ICD). Although the catalytic function of RIPK1 is required to trigger cell death, its non-catalytic scaffold function mediates strong pro-survival signaling. Accordingly, cancer cells can hijack RIPK1 to block necroptosis and evade immune detection. We generated a small-molecule proteolysis-targeting chimera (PROTAC) that selectively degraded human and murine RIPK1. PROTAC-mediated depletion of RIPK1 deregulated TNFR1 and TLR3/4 signaling hubs, accentuating the output of NF-κB, MAPK, and IFN signaling. Additionally, RIPK1 degradation simultaneously promoted RIPK3 activation and necroptosis induction. We further demonstrated that RIPK1 degradation enhanced the immunostimulatory effects of radio- and immunotherapy by sensitizing cancer cells to treatment-induced TNF and interferons. This promoted ICD, antitumor immunity, and durable treatment responses. Consequently, targeting RIPK1 by PROTACs emerges as a promising approach to overcome radio- or immunotherapy resistance and enhance anticancer therapies.

Keywords: RIPK1; TLR3; TNF; anticancer immunity; cell death; immunotherapy; inflammation; interferon; necroptosis; radiotherapy.


Conflict of interest statement

Declaration of interests The authors declare no competing interests.

Figures

Figure 1.
Figure 1.. Development of selective RIPK1-PROTAC degraders
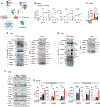
(A) Schematic representation of RIPK1-PROTACs. (B) HT1080RIPK1-HiBiT cells were treated with the indicated PROTACs for 24 h. HiBiT measurements are shown. RLU, relative light unit. (C) Western blot analysis evaluating RIPK1 degradation. Cells were incubated with the indicated concentrations of R1-ICR-5 for 6 h. (D) Micro-confocal images of the indicated endogenous proteins in cells treated with the indicated PROTACs for 20 h. Scale bars: 100 μm (HT1080/HT29) and 50 μm (EMT6/L929). (E) Quantification of relative endogenous RIPK1 levels from (D). (F) Western blot analyzis of cells treated with the indicated agents for 6 h. (G) Western blot analyzis of primary BMDMs treated as indicated. Where indicated, cells were pre-treated with VH298 (1 μM) or bortezomib (100 nM) for 1 h before R1-ICR-5 exposure. RIPK1 degradation was quantified by densitometry (right panel). (H) Volcano plot depicting whole proteome of BMDMs treated with R1-ICR-5 (1 μM, 5 h) vs non-treated controls. Log2 fold change and −log10 adjusted P values (Benjamin-Hochberg procedure) are shown along the x- and y-axis, respectively. (I) Washout experiment. Mlkl−/− BMDMs were treated with DMSO or R1-ICR-5 (1 μM) for 24 h before washout. Mlkl−/− cells were used to avoid loss of cellular material. Samples were harvested at the indicated time points, and analyzed by western blot (left panel) and quantified by densitometry (right panel). Data shown are technical replicates and are representative of 3 independent biological repeats. Data show ± SD and are representative of ≥2 independent biological repeats. Statistical analysis (E,I) was calculated by two-way ANOVA with Sidak’s multiple comparison test and (G) one-way ANOVA with Bonferroni’s multiple comparison test.
Figure 2.
Figure 2.. Acute degradation of RIPK1 deregulates TNFR1 and TLR3 signaling
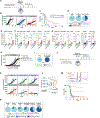
(A) Schematic representation depicting RIPK1’s regulation of TNFR1 and TLR3/4-induced signaling and cell death. (B) Relative mRNA expression of NF-κB target genes, in BMDMs pre-treated with DMSO or R1-ICR-5 for 4 h, followed by indicated TNF treatment. (C) Relative Tnf mRNA expression in BMDMs treated for 4 h with the indicated conditions. MK2i refers to an MK2 inhibitor. (D) Western blot analysis of TNFR1 signaling complex-I. Cells were treated with DMSO or R1-ICR-5 (overnight). (E) L929 cells were treated as in (D) before anti-GST-TUBE pulldown to isolate the ubiquitylated proteome. *Indicates non-specific signal. (F) Western blot analysis of BMDMs pre-treated with DMSO or R1-ICR-5 for 4 h, followed by TNF exposure for the indicated time points. (G) Relative mRNA expression of NF-κB or IFN target genes. BMDMs were pre-treated with DMSO or R1-ICR-5 for 4 h, followed by stimulation with Poly(I:C). Data show mean ± SD and are representative of (C,E) two, (B,G) three, (F) four or (D) five independent biological repeats. P values were calculated using (B) two-way ANOVA (Sidak’s multiple comparison test) or (C,G) one-way ANOVA (Bonferroni’s multiple comparison test).
Figure 3.
Figure 3.. RIPK1 degraders drive TNFR1-driven necroptosis, independent of TRIF and ZBP1
(A, B) Quantification of propidium iodide positive (PI+) cells, treated with the indicated conditions. Cells were pre-treated with DMSO, R1-ICR-5 or RIPK2 degrader (A,18 h; B,5 h), before stimulation with the indicated conditions (A,5 h; B,7 h). (C) Western blot analysis monitoring RIPK3 and MLKL activation. Cells were pre-treated for 18 h, before exposure to TE for the indicated time points. *Indicates non-specific signal. (D, E) Quantification of PI+ cells. Cells were pre-treated with DMSO, R1-ICR-3 or R1-ICR-5 for 4 h, followed by the indicated treatments (3 h). (F) Quantification of PI+ BMDMs. Cells were pre-treated with DMSO or R1-ICR-5 for 4 h, followed by the indicated treatment. (G) Quantification of PI+ L929 cells. Cells were untreated or pre-treated with R1-ICR-5 for 12 h, followed by treatment with the indicated agents. RIPK1 kinase inhibitors were added 30 min prior to TE (6.5 h). (H-K) Quantification of PI+ cells. The indicated cells were treated with R1-ICR-5, R1-ICR-5S, or MK2 inhibitor for 24 h. (L) Quantification of PI+ cells. Ripk3−/− cells were reconstituted with Dox-inducible WT or RHIM-mutant RIPK3 (RHIMm). Cells were induced with Dox and incubated with R1-ICR-5 for 12 h, before treatment with TE for 2.5 h. (M) Quantification of PI+ cells. Cells were pre-treated with DMSO or R1-ICR-5 for 18 h, following treatment with TE (5 h). Trif and Zbp1 deficiency was confirmed by western blot analysis. (N) Quantification of PI+ BMDMs. Cells were treated with the indicated agents for 24 h (left panel). Right panel: western blot analysis of BMDMs following treatment with DMSO or R1-ICR-5 for 6 h. (O) Quantification of PI+ BMDMs. The indicated cells were treated with R1-ICR-5 for 24 h. Data show ± SD and are representative of three (A,D-O), four (B) or two (C) independent biological repeats. P values were calculated using (F,H,K,O) one-way ANOVA (Bonferroni multiple comparison test) or (A,B,D,E,G,I,J,L-N) two-way ANOVA (Sidak’s multiple comparison test).
Figure 4.
Figure 4.. RIPK1 degradation facilitates TRADD fibrillation and TRADD-RIPK3 interaction
(A, B) Quantification of PI+ L929s. Cells were treated with the indicated RNAis for 48 h, followed by treatment with control or R1-ICR-5 for 24 h. Subsequently, cells were treated with TE for 2 h. (C) Quantification of PI+ BMDMs. Cells were pre-treated with DMSO or R1-ICR-5 for 4 h, followed by treatment with TZ or TE. Data represent 2 biological replicates and are representative of three independent experiments. (D) TNFR1 complex-II analysis using L929Dox-Flag-TRADD cells pre-treated with DMSO or R1-ICR-5 overnight. FLAG-TRADD was induced for 1 h (Dox), followed by treatment with TE (1 h). Lysates were subjected to anti-FLAG IP before western blot and densitometry analyzes. (E) Western blot analysis of L929Dox-Flag-TRADD cells pre-treated with DMSO or R1-ICR-5 for 18 h, followed by 1 h induction of FLAG-TRADD (Dox). Subsequently, cells were treated with TE for the indicated time points. *Indicates non-specific signal. (F) Quantification of PI+ L929Dox-Flag-TRADD cells. Cells were pre-treated with DMSO or R1-ICR-5 for 18 h, followed by 1 h induction of TRADD (Dox). Subsequently, cells were treated with TE (2 h). (G) Confocal microscopy images of TRADD fibrils using L929Dox-Flag-TRADD. Cells were treated with DMSO or R1-ICR-5 overnight, followed by 1 h Dox-induction of FLAG-TRADD (in the presence of E). Subsequently, cells were treated with TNF for 10 minutes. i) and ii) are magnifications of the indicated areas. Scale bars: 50 μm and magnification 10 μm. Quantification of the number of TRADD aggregates per cell (~70 cells/condition) (right panel). (H) Analysis of the ubiquitylated proteome. cells were pre-treated with DMSO or R1-ICR-5 overnight, followed by treatment with TE for the indicated time points. Cells were subjected to TUBE pull-down. Samples were split and boiled with or without β-mercaptoethanol (reducing or non-reducing). *Indicates non-specific signal. (I) Predicted AlphaFold structure of mTRADD (AF-Q3U0V2-F1, left panel). C198 has a confidence of 45–58 %, whereas all other cysteines have a >85 % confidence. Right panel, schematic representations of mTradd constructs used to reconstitute L929 Tradd−/− cells in (J,K). DD, Death Domain. (J,K) Quantification of PI+ cells, reconstituted with the indicated Dox-inducible Tradd transgenes. Cells were treated with DMSO or R1-ICR-5 overnight, prior to treatment with Dox/E for 2 h. Subsequently, cells were treated with TNF for 3h. (L) Quantification of PI+ cells, stably expressing Dox-inducible Ripk1 constructs. Cells were treated with DMSO or R1-ICR-5 overnight, before incubation with Dox/E for 3 h. Subsequently, cells were treated as indicated. (M) Schematic diagram depicting rewiring of TNFR1-mediated activation of RIPK3 upon R1-ICR-5 treatment. RIPK1, through its DD (Death domain), competes with TRADD for the binding of TNFR1. Upon depletion of RIPK1, TRADD is enriched at the TNFR1 signaling complex-I, ultimately leading to accentuated formation of complex-II, RIPK3 activation and necroptosis. Data show ± SD and are representative of (a-c,f-h,j-l) 3 or (d,e) 2 independent biological repeats. P values were calculated using (d,k) one-way ANOVA (Bonferroni multiple comparison test) or (a-c,f,j,m) two-way ANOVA (Sidak’s multiple comparison test) or (g) unpaired t-tests.
Figure 5.
Figure 5.. RIPK1 protects cancer cells from TNF and IFN-induced cell death
(A,B) Quantification of PI+ cells. Cells were pre-incubated with DMSO or R1-ICR-5 for 4 h, cells were left untreated or stimulated with TNF or TE in the presence and absence of RIPK3 inhibitors (6, 48 and 24 h for EO771, MC38 and MCA-205, respectively). (C) Quantification of PI+ cells. Cells were pre-treated with DMSO or R1-ICR-5 (4 h), before 24 h of IFNβ or IFNγ. MCA-205 and MC38 were pre-treated overnight with IFNγ before incubation with DMSO or R1-ICR-5 for 24 h (MCA-205) or 48 h (MC38). (D) Quantification of PI+ cells. Cells were pre-treatment with IFNβ in the presence of E overnight. Subsequently, cells were treated with R1-ICR-5 for 5 h, before TNF treatment (24 h). (E) Purification of TNFR1 complex-II from EO771Dox-FLAG-TRADD cells. Cells were treated with DMSO or R1- ICR-5 for 2 h, before induction of Tradd for 2 h (Dox). Subsequently, cells were treated as indicated and analyzed by western blotting. Densitometry was used to quantify P-RIPK3. P-RIPK3 signal was normalized to purified TRADD. (F) Western blot analysis of the indicated proteins in EO771Dox-FLAG-TRADD. Cells were pre-treated with DMSO or R1-ICR-5 for 4 h. Subsequently, TRADD was induced with Dox and cells were treated with TE for the indicated time points. (G) Quantification of PI+ cells, treated as in (F). Data are triplicate technical repeats and are representative of two independent biological repeats. (H) IFNβ and TNF gene expression analysis of EO771 cells left untreated or exposed to 8 Gy irradiation. Data show mean ± SD and are representative of three biological repeats. Statistical analysis was performed by unpaired t test. (I-L) Quantification of PI+ cells, subjected to the indicated dose of irradiation. 24 h after treatment, cells were incubated with DMSO or R1-ICR-5 for 24 h. (K) Enbrel was added 30 minutes prior to irradiation. (m) Quantification of PI+ cells, stably expressing the indicated shRNA constructs, treated as in (K) in the presence of Dox. Data show ± SD and are representative of (A-D,F,H-M) three, (E) two or (G) four independent biological repeats. P values were calculated using two-way ANOVA (Sidak’s multiple comparison).
Figure 6.
Figure 6.. RIPK1 functions as a protective factor for cancer cells against the effects of RT
(A) Schematic depicting the treatment regimen of tumor bearing mice. I.T, Intratumoral injection. (B) Tumor growth curves of tumor-bearing mice treated as depicted in (A): sham (n = 8), RT (n = 11), RT/R1-ICR-5 (n = 10). Thick lines represent average tumor growth. Curves represent two independent experiments. (C) Survival curves of EO771 tumor bearing mice treated as depicted in (A,B). Curves represent two independent experiments. Median survival (RT = 24 days; RT/R1-ICR-5 = 35 days) (Logrank (Mantel-cox) P=0.0290). (D) Pie-charts depicting the response of treated mice from (A,C). Chi-square test – Sham Vs RT/R1-ICR-5, P=0.0186; RT Vs RT/R1-ICR-5, P=0.0382. (E-G) Flow cytometric analysis of tumors treated as in (A) and harvested on day 13 post-RT. Sham (n=10), RT (n=9) and RT/R1-ICR-5 (n=8). Data are representative of two independent experiments. (E) The number of TNFα+IFNγ+ immune (CD45+) and non-immune cells (CD45) per gram of tumor. (F) The number of TNFα+IFNγ+ lymphocytes per gram of tumor. (G) The number of CD45+, CD8+ T, CD4+ conventional T (CD4cv), γδ T, NK and NK T cells per gram of tumor. (H) Tumor rechallenge experiment. Data show the growth curves of EO771 mammary tumors, in naïve mice (n=7, black lines) or RT/R1-ICR-5-treated tumor-free mice from (A-D) (100 days post-treatment (n=2, red lines). Each line represents 1 animal, thick lines denote average tumor growth. I.P, intraperitoneal injection; I.T, intratumoral injection. (I) Pie-charts depicting the proportion of mice bearing tumors, 42-days after re-challenge with EO771 cells (H). Chi-square test, P=0.0027. (J) Schematic depicting the treatment regimen of tumor bearing mice. (K) Tumor growth curves of mice treated as in (J). Thick lines represent average tumor growth. Treated mice: IgG (n = 5), anti-CTLA4 (n = 7), RT (n = 10), RT/R1-ICR-5 (n=10), RT/anti-CTLA-4 (n=10) and RT/anti-CTLA-4/R1-ICR-5 (n=10). (L) Tumor growth kinetics (day 0–30) of mice treated as in (J-K), measured by area under the curve (AUC). Each point represents the AUC of individual mice, from (K). (M) Survival curves of mice treated as in (J,K). Curves are representative of one biological replicate. Median survival RT/anti-CTLA-4 = 70.5 days; RT/anti-CTLA-4/R1-ICR-5 = undefined. (N) Pie-charts depicting the response of tumor-bearing mice treated as in (I-M). Data show ± SD. P values were calculated using (C,M) Log-rank (Mantel-Cox), (D,I,N) Chi-square test (Comparing progression Vs complete response), (E-G) or Kruskal Wallis test or (L) one-way ANOVA (Bonferroni’s multiple comparison test).
Figure 7.
Figure 7.. RIPK1 PROTACs enhance response to immune checkpoint blockade
(A) Schematic depicting the treatment regimen of tumo-bearing mice. I.P, intraperitoneal injection; I.T, intratumoral injection. (B) Tumor growth curves of tumor-bearing mice treated as in (A). Thick lines represent average tumor growth. Treated mice: IgG (n = 8), R1-ICR-5 (n = 9), anti-PD-1 (n = 8), R1-ICR-5/anti-PD-1 (n=10). (C) Tumor growth kinetics (day 0–21) of mice treated as in (A), measured by area under the curve (AUC). Each point represents the AUC of individual mice, from (B). (D) Survival curves of tumor-bearing mice treated as in (A). Curves are representative of one independent experiment. R1-ICR-5 improves the median survival of mice treated with anti-PD-1 (median survival: anti-PD-1 = 28.5 days; R1-ICR-5/anti-PD-1 = 36.5 days). (E) Pie-charts depicting the response of tumor-bearing mice treated as in (A-D). Chi-square test – Captisol/IgG Vs PD-1, P=0.0209; Captisol/IgG Vs PD-1/R1-ICR-5, P=0.0073. (F) Association of RIPK1 copy number alterations (CNA) with disease free survival in TCGA patients (n=2,601) across multiple tumor types. (G) Overall survival in RIPK1-low/NK-high versus RIPK1-high/NK-low patient groups from SCAN-B TNBC dataset (n=148). (H) Gene set enrichment analysis (GSEA) of indicated gene sets in RIPK1-low/NK-high versus RIPK1-high/NK-low TNBC patients (n=148). FDR, False discovery rate q-value; NES, Normalised enrichment score. Data show ± SD. P values were calculated using (C) one-way ANOVA (Bonferroni’s multiple comparison test), (D,F,G) Logrank (Mantel-Cox) or (E) Chi-square test (Comparing progression Vs complete response).

References

    1. Medzhitov R (2008). Origin and physiological roles of inflammation. Nature 454, 428–435. 10.1038/nature07201. - DOI - PubMed
    1. Pasparakis M, and Vandenabeele P (2015). Necroptosis and its role in inflammation. Nature 517, 311–320. 10.1038/nature14191. - DOI - PubMed
    1. Rothlin CV, and Ghosh S (2020). Lifting the innate immune barriers to antitumor immunity. J Immunother Cancer 8. 10.1136/jitc-2020-000695. - DOI - PMC - PubMed
    1. Orozco S, Yatim N, Werner MR, Tran H, Gunja SY, Tait SW, Albert ML, Green DR, and Oberst A (2014). RIPK1 both positively and negatively regulates RIPK3 oligomerization and necroptosis. Cell Death Differ 21, 1511–1521. 10.1038/cdd.2014.76. - DOI - PMC - PubMed
    1. Weinlich R, and Green DR (2014). The two faces of receptor interacting protein kinase-1. Mol Cell 56, 469–480. 10.1016/j.molcel.2014.11.001. - DOI - PMC - PubMed

Publication types

Substances