. 2024 Jun 10;42(6):1086-1105.e13.
doi: 10.1016/j.ccell.2024.05.003. Epub 2024 May 23.

Olfactory neuroblastoma mimics molecular heterogeneity and lineage trajectories of small-cell lung cancer

Affiliations

Olfactory neuroblastoma mimics molecular heterogeneity and lineage trajectories of small-cell lung cancer

John B Finlay et al. Cancer Cell. .

Abstract

The olfactory epithelium undergoes neuronal regeneration from basal stem cells and is susceptible to olfactory neuroblastoma (ONB), a rare tumor of unclear origins. Employing alterations in Rb1/Trp53/Myc (RPM), we establish a genetically engineered mouse model of high-grade metastatic ONB exhibiting a NEUROD1+ immature neuronal phenotype. We demonstrate that globose basal cells (GBCs) are a permissive cell of origin for ONB and that ONBs exhibit cell fate heterogeneity that mimics normal GBC developmental trajectories. ASCL1 loss in RPM ONB leads to emergence of non-neuronal histopathologies, including a POU2F3+ microvillar-like state. Similar to small-cell lung cancer (SCLC), mouse and human ONBs exhibit mutually exclusive NEUROD1 and POU2F3-like states, an immune-cold tumor microenvironment, intratumoral cell fate heterogeneity comprising neuronal and non-neuronal lineages, and cell fate plasticity-evidenced by barcode-based lineage tracing and single-cell transcriptomics. Collectively, our findings highlight conserved similarities between ONB and neuroendocrine tumors with significant implications for ONB classification and treatment.

Keywords: ASCL1; NEUROD1; POU2F3; RPM; SCLC; esthesioneuroblastoma; neuroendocrine; olfactory neuroblastoma; plasticity; tuft.


Conflict of interest statement

Declaration of interests TGO has a patent related to SCLC subtypes and a sponsored research agreement with Auron Therapeutics, serves on the scientific advisory board (SAB) for Lung Cancer Research Foundation, and as a consulting editor for Cancer Research and Genes & Development. BJG has interest in Rhino Therapeutics and is on the SAB for Smell and Taste Association of North America. J.C. has equity in Mirati Therapeutics and provision of services for Sonata Therapeutics. D.J. has consulted for Regeneron and ST Stent.

Figures
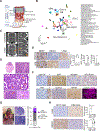
Figure 1.
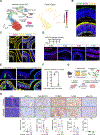
Figure 1.. Rb1/Trp53/Myc (RPM) mice develop high-grade metastatic olfactory neuroblastoma (ONB).
A) Normal cell types in the olfactory epithelium. Sus = sustentacular; MV1/2 = microvillar-1 or −2; HBCs = horizontal basal cells; BG = Bowman’s gland; OSN = olfactory sensory neuron; GBC/INP = globose basal cell / immediate neuronal precursor; OEC = olfactory ensheathing cell. B) Pan-cancer UMAP of 604 bulk RNA-seq samples from 39 tumor types. Dashed circles indicate clustering of neuroendocrine and neural tumor types corresponding with Leiden clusters in Figure S1B. C) MicroCT images of uninfected control (top) or Ad5-Cgrp-Cre-infected RPM mouse (bottom) 10 weeks post-infection in multiple planes. Orange arrows indicate tumor occluding black air space. D) Representative H&E of RPM mouse brain (top left; scale bar, 5 mm) with high magnification inset (top right). Middle panel: Arrowheads indicate rosettes. Bottom panels: RPM olfactory tumor with arrows indicating organized necrosis. Scale bars, 50 μm, unless indicated. E) Representative immunohistochemistry (IHC) of RPM lung (bottom) vs olfactory (top) tumor for indicated antibodies with H-score quantification. Scale bar, 25 μm. Mean ± standard deviation (SD); Student’s unpaired t test, **** p<0.0001, * p<0.03, not significant (ns). F) Representative IHC or IF for indicated markers (IHC scale bar, 25 μm; IF scale bar, 50 μm). Positive control (+) insets; pan-CK = kidney; P63 = Sox2LSL/LSL;Nkx2–1fl/fl;Lkb1fl/fl squamous tumor. G) Cervical lymph node (LN) metastases (mets) in an RPM GEMM (left, yellow arrows indicate tumor) and representative H&E of ONB mets (middle, top scale bar,1 mm; bottom scale bar, 50 μm). Bar graph indicates percentage of mice with ONB that have mets +/− SCLC. H) Representative IHC of primary tumors (1°) or mets in mice with SCLC (left) vs mice with ONB (right) for indicated antibodies with H-score quantification of n=5–14 tumors per category. Mean ± SD; Student’s unpaired t test, **** p<0.0001, *** p<0.0002, ** p<0.004, * p<0.03, not significant (ns). See also Figure S1 and Table S1.
Figure 2.
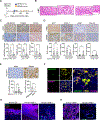
Figure 2.. Olfactory neuroblastoma can arise from GBC progenitors.
A) UMAP of scRNA-seq data from normal olfactory epithelium (OE) cells (left) and corresponding Cgrp/Calca expression (right). B) Immunofluorescence (IF) staining of CGRP (green: trigeminal nerves, white arrowheads), SOX2 (pink: HBCs, Sus cells), TUBB3 (yellow: INPs, OSNs) and Hoescht (blue: nuclei) in the normal OE of uninfected RPM mice. C) In situ tumors of RPM GEMMs emerging from the basal layer in the OE. Arrowheads indicate TUBB3+/KI67+ tumor cells invading the lamina propria. AS=nasal airspace, LP=lamina propria. D) Experimental timeline indicating Ad-Cgrp-Cre delivery to reporter mice at day 0 and collection of tissue at indicated days post-infection (dpi) (top) with IF of the normal OE for tdTomato (tdTom) (pink: Cre-mediated recombination) and Hoescht (blue: nuclei). E) IF on normal OE for tdTom (pink: Cre-mediated recombination), TUBB3 (yellow: INPs, OSNs), Hoescht (blue: nuclei) and left: ASCL1 (green: GBCs), middle: NEUROD1 (green: GBCs, INPs), or right: SOX2 (green: HBCs, Sus cells). White indicates overlap of ASCL1, NEUROD1, or SOX2 with tdTom. Arrowheads in left and middle panel indicate ASCL1+/tdTom+ or NEUROD1+/tdTom+ GBCs. Arrowheads in right panel indicate TUBB3+/tdTom+ OSNs while asterisks indicate SOX2+/tdTom+ Sus cells. F) Quantification of tdTom+ GBC vs non-GBC-derived cells in Ai9 reporter mice at Day 5–7 post-Cre (n = 3). Mean ± standard deviation (SD), Student’s unpaired t-test, *** p<0.001. G) Experimental schematic depicting 1–2) MMZ treatment of uninfected RPM mice and isolation of normal RPM GBCs, 3) ex vivo Cre-mediated transformation validated via PCR, and 4) implanting transformed, GBC-derived organoids as allografts. H) Representative H&E of primary RPM tumor (top) vs GBC-derived RPM allograft (bottom) and IHC staining of indicated antibodies with H-score quantification. Mean ± SD; Student’s unpaired t test, * p<0.02, not significant (ns). All scale bars, 50 μm. All dashed white lines indicate basal layer of OE. See also Figure S2 and Table S1.
Figure 3.
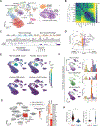
Figure 3.. Loss of ASCL1 enhances non-neuronal histopathologies.
A) Tumor latency post-Ad-Cgrp-Cre infection in RPM vs RPMA GEMMs. Triangles indicate first signs of ONB by microCT imaging in indicated numbers of RPM (blue) or RPMA (orange) GEMMs. B) Representative H&E of RPMA ONBs with glandular growth and necrosis (left) and hyperplastic seromucinous glands overlying ciliated pseudostratified epithelium (right). C) Representative IHC for indicated antibodies in RPM and RPMA ONB tumors with H-score quantification. **** p< 0.0001, * p<0.04. D) Representative IHC in RPM and RPMA ONBs with H-score quantification. ** p<0.003, * p<0.03; not significant (ns). E) Representative POU2F3 IHC in RPM and RPMA ONBs with H-score quantification by genotype (left), and by histotype in n=16 RPMA tumors (right), ** p< 0.002, * p< 0.03. F) Representative IF for NEUROD1 (green), POU2F3 (pink), TUBB3 (yellow) and Hoescht (blue: nuclei) in an RPMA ONB. G) IF of Hoescht (blue: nuclei), POU2F3 (green), and TUBB3 (pink: INPs, OSNs) on normal human OE (left) or two distinct human ONBs (middle, TUBB3-high; right, TUBB3-low). Dashed white line indicates basal lamina. H) IF of Hoescht (blue: nuclei), HES1 (green), and TUBB3 (pink: INPs, OSNs) on human ONB-1 and −2 from 3G. For all IF/IHC, scale bars are 50 μm. For all bar graphs, error bars are mean ± standard deviation (SD) with Student’s unpaired t-tests. See also Figure S3 and Table S1.
Figure 4.
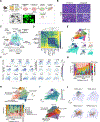
Figure 4.. Mouse ONB transcriptionally resembles human ONB.
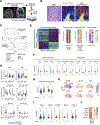
A) UMAP of tumor and non-tumor scRNA-seq data from n=1 RPM (n=3,350 cells) and n=3 RPMA (n=1,633 cells) ONBs integrated with normal mouse olfactory epithelium (OE). Inset is tumor cells only. B) Optimal transport (OT) distance matrix for 100 subsampled cells per cluster. Darker colors represent closer transcriptional distance between cell types. Dendrogram is hierarchical clustering by OT between cell types. C) Dot plot of expression of OE cell type markers in RPM vs RPMA tumor cells by scRNA-seq. D) Volcano plot of enriched genes in RPM (purple) vs RPMA (orange) ONB. E) Module scores of indicated human tumor types applied to ONB tumors and normal OE cells in 4A UMAP. F) Published module scores derived from scRNA-seq data of subtyped, human SCLC tumors applied to 4A UMAP. Bar graphs indicate average score per cell type. Error bars are 95% confidence intervals. Mann-Whitney with Bonferroni correction, ***p<0.0001. G) UMAP of scRNA-seq data from two human ONB tumors, ONB-A (red) and ONB-B (ONB-2 in 3G-H, blue) integrated with a published human OE scRNA-seq atlas,, (left). Heatmap of average gene expression per ONB tumor (right). H) RPM and RPMA ONB scores applied to human ONB-A vs -B from 4G. Mann-Whitney with Bonferroni correction, **** p<0.0001. See also Figure S4 and Tables S1 and S2.
Figure 5.
Figure 5.. GBC-derived ONB exhibits plasticity between neuronal and non-neuronal states.
A) Experimental design with representative brightfield and GFP organoid images. Scale bar, 275 μm. B) Representative H&E of RPMA primary ONB vs GBC-derived allograft tumors. Scale bars, 50 μm. C) UMAP of scRNA-seq on RPM (n=4,161) and RPMA (n=19,302) GBC-derived allograft, primary RPM and RPMA ONB, and normal OE cells. D) Optimal transport (OT) distance matrix of 100 subsampled cells per cluster. Darker colors indicate closer transcriptional distances between cell types. Dendrogram shows hierarchical clustering based on average OT distances. E) Force atlas (FA) projection of transcriptionally distinct Leiden clusters (top) from indicated samples (bottom). F) Feature plots of indicated genes in 5E FA space. G) Frequency of cells in each CellTagged clone (x-axis) or in the whole RPM or RPMA allograft sample per Leiden cluster from 5E. H) Cell state assignments based on expression of normal OE markers per Leiden cluster in 5E in UMAP (top) and frequency of cell state per clone (bottom) or per whole sample. I) Diffusion pseudotime of RPM and RPMA cells in 5E FA map (top), and predicted differentiation trajectories through cell states (bottom). J) Representative FA maps of clonally-linked cells in multiple states for indicated clones. Colors correspond with state trajectories from 5I. Clone IDs match x-axis labels in 5G-H. See also Figures S5–S6 and Tables S1 and S3.
Figure 6.
Figure 6.. Human ONB exhibits SCLC similarities in intratumoral heterogeneity, immune-cold tumor microenvironment, and therapeutic targets.
A) Schematic indicating collection of human specimens by surgical resection, formalin-fixation and paraffin embedding (FFPE), and Nanostring GeoMx profiling. B) Representative regions of interest (ROIs) in a sample including H&E staining (left), immunostains for KI-67 (pink: proliferation), TUBB3 (yellow: OSNs, tumor cells), and CD45 (green: immune cells) (middle). Representative ROI segmentation (right). Scale bar, 50 μm. C) UMAP clustering of transcriptomic profiles from all 48 ROI segments across samples. Marker expression and tumor grade per ROI indicated according to legend. Pan-negative ROI segments are negative for all three markers. D) Violin plots showing cell-type signature scores per ROI in low- (blue) vs high- (orange) grade human ONB. Each dot represents one ROI; Mann-Whitney with Bonferroni correction; *p<0.05; **p<0.01; ***p<0.001; ns = not significant. E) Leiden clustering of ROIs (excluding stromal/immune segments). Bar graphs depict proportion of ROIs per Leiden cluster 1 and 2 based on tumor grade (left), immunostain (middle), or patient ID (right). F, G) Violin plots of indicated F) non-neuronal vs neuronal genes or G) RPM vs RPMA ONB gene modules per Leiden cluster. H) ScRNA-seq expression of indicated genes in mouse RPM and RPMA tumors in 4A UMAP. I) Violin plots of indicated genes per Leiden cluster. J) Normalized expression of indicated genes in human ONB-A vs -B tumors from scRNA-seq data in 4G. For violin plots each dot represents one ROI, and edgeR quasi-likelihood F-test with Benjamini Hochberg correction was performed; *p<0.05; **p<0.01, ***p<0.001, ****p<0.0001, ns = not significant. See also Figure S7 and Table S4.

References

    1. Bell D, Brandea AI, and Hanna EY (2023). Olfactory Neuroblastoma: Morphological Reappraisal and Molecular Insights with Quantum Leap in Clinical Perspectives. Curr Oncol Rep 25, 11–18. 10.1007/s11912-022-01348-3. - DOI - PubMed
    1. Faragalla H, and Weinreb I. (2009). Olfactory Neuroblastoma: A Review and Update. Advances in Anatomic Pathology 16, 322–331. 10.1097/PAP.0b013e3181b544cf. - DOI - PubMed
    1. Thompson LDR (2009). Olfactory Neuroblastoma. Head and Neck Pathology 3, 252–259. 10.1007/s12105-009-0125-2. - DOI - PMC - PubMed
    1. Zunitch MJ, Fisch AS, Lin B, Barrios-Camacho CM, Faquin WC, Tachie-Baffour Y, Louie JD, Jang W, Curry WT, Gray ST, et al. (2023). Molecular Evidence for Olfactory Neuroblastoma as a Tumor of Malignant Globose Basal Cells. Mod Pathol 36, 100122. 10.1016/j.modpat.2023.100122. - DOI - PMC - PubMed
    1. Goshtasbi K, Abiri A, Abouzari M, Sahyouni R, Wang BY, Tajudeen BA, Hsu FPK, Cadena G, and Kuan EC (2019). Hyams grading as a predictor of metastasis and overall survival in esthesioneuroblastoma: a meta-analysis. Int Forum Allergy Rhinol 9, 1054–1062. 10.1002/alr.22373. - DOI - PMC - PubMed

MeSH terms

Substances