. 2024 Jul:264:110260.
doi: 10.1016/j.clim.2024.110260. Epub 2024 May 22.

IL-27 promotes pathogenic T cells in a mouse model of Sjögren's disease

Affiliations

IL-27 promotes pathogenic T cells in a mouse model of Sjögren's disease

Ivy L Debreceni et al. Clin Immunol. 2024 Jul.

Abstract

Sjögren's disease (SjD) is a chronic autoimmune disease characterized by focal lymphocytic inflammation in lacrimal and salivary glands. We recently identified IL-27 as a requisite signal for the spontaneous SjD-like manifestations in nonobese diabetic (NOD) mice. Here, we define T cell-intrinsic effects of IL-27 in lacrimal gland disease in NOD mice. IL-27 receptor was required by both CD4 T effector (Te) cells and CD8 T cells to mediate focal inflammation. Intrinsic IL-27 signaling was associated with PD-1 and ICOS expressing T follicular helper (Tfh)-like CD4 Te cells within lacrimal glands, including subsets defined by CD73 or CD39 expression. CD8 T cells capable of IL-27 signaling also expressed PD-1 with subsets expressing ICOS and CD73 demonstrating a T follicular cytotoxic (Tfc)-like cell phenotype and others expressing a CD39hi exhausted-like phenotype. These findings suggest IL-27 is a key early signal driving a follicular-type response in lacrimal gland inflammation in NOD mice.

Keywords: Exhausted CD8 T cells; IL-27; Sjögren's disease; T follicular cytotoxic cells; T follicular helper cells; T peripheral helper cells.


Conflict of interest statement

Declaration of competing interest All authors declare that no conflicts of interest exist.

Figures

Figure 1.
Figure 1.
Lymphocytes require IL-27 signaling to transfer lacrimal gland disease. (A) Schematic of experimental design where bulk cervical LN (cLN) cells were isolated from WT, IL-27Rα KO (Rα KO), or IL-27p28 KO (p28 KO) NOD donor mice and transferred intravenously into NOD-SCID recipients (5×10⁶ cells/recipient). (B) Quantitation of lacrimal gland inflammation of recipients of WT (n=7), Rα KO (n=6), or p28 KO (n=6) cLN cells as indicated on the x-axis. Focus scores represent the # of mononuclear cell foci per 4 mm2 of tissue, with a focus requiring a minimum of 50 mononuclear cells. Symbols represent individual mice. Lines are medians. P = 0.0004 by Kruskal-Wallis test with Dunn multiple comparisons indicated, * P = 0.014 and ** P = 0.005. (C) Representative H&E-stained histology images of each group in B with focus score indicated. Area marked with rectangle in top image is magnified in bottom image. Scale bar is 200 μm.
Figure 2.
Figure 2.
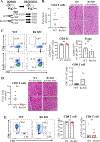
CD4 and CD8 effector T cells each require IL-27Rα to transfer disease. (A) Schematic of experimental design where cLN cells from WT or Rα KO NOD donor mice were FACS-sorted into either CD4 Te (CD8αCD4+CD25) or CD8 T cells (CD8α+CD4). Subsequently, CD4 Te (3×10⁶) or CD8 T cells (2×10⁶) were transferred intravenously into sex-matched NOD-SCID recipients. Five weeks later lacrimal glands were analyzed for inflammation. (B) Quantitation of lacrimal gland inflammation of recipients of CD4 Te donor cells as indicated on x-axis (WT n=8, Rα KO n=5). Focus scores as defined in Fig 1. Symbols represent individual mice. Lines are medians. *P=0.045 by Mann-Whitney. Representative histology H&E-stained sections from each group with focus score indicated. Area depicted by rectangle in top image is magnified in bottom image. Scale bar is 200 μm. (C) Representative density flow cytometry plots of cLN cells recovered from recipient mice gated on singlet T cells (TCRβ+CD19; top) or CD4 T cells (bottom). Graphs depict quantification of CD4 Te cells (CD4+FoxP3) as % of CD4 T cells, Tregs (CD4+FoxP3+) as % of CD4 T cells, and CD8 T cells (CD8+) as % of T cells. *P<0.05 and ns (not significant) by unpaired t-test. (D) Quantitation of lacrimal gland inflammation of recipients of CD8 donor T cells as indicated on x-axis (WT n=7, Rα KO n=9). Focus scores as in Fig 1. Symbols are individual mice. Lines are medians. **P=0.004 by Mann-Whitney. Representative histology H&E-stained sections from each group with focus score indicated. Area depicted by rectangle in top image is magnified in bottom image. Scale bar is 200 μm. (E) Representative density flow cytometry plots of cLN recovered from recipient mice gated on singlet T cells (TCRβ+CD19). Graphs depict quantification of CD8 effector T cells as % of T cells (TCRβ+CD19) (left) and CD4 T cells as % of T cells (right). ns, not significant by unpaired t-test.
Figure 3.
Figure 3.
IL-27 signaling by both CD4 Te and CD8 T cells contribute to lacrimal gland inflammation in adoptive co-transfers. (A) Schematic of experimental design where cLN cells from WT or Rα KO NOD mice were FACS-sorted based on CD8α+ (CD8 T cells) or CD4+CD25 (CD4 Te). CD4 Te and CD8 T cells from WT or KO donors were then mixed at a 3:2 ratio and transferred to sex-matched NOD-SCID recipient mice. Five weeks later lacrimal glands were analyzed for inflammation by standard focus scoring (as in Fig 1). (B) Quantitation of lacrimal gland inflammation of recipients of donor cells as indicated on x-axis. Symbols are individual mice. Lines are medians. P=0.0078 by Kruskal-Wallis test with Dunn multiple comparisons comparing each group to the WT/WT group as indicated, * P < 0.05 and ** P < 0.01. (C) Representative H&E-stained histology images of each group in B (indicated as CD4 + CD8 donor genotype) with focus score indicated. Area depicted by rectangle in top image is magnified in bottom image. Scale bar is 200 μm. (D) cLN of recipient mice were analyzed by flow cytometry to quantify T cell populations. Graphs depict quantification of CD8 T cells as % of T cells, CD4 T cells as % of T cells, CD4 Te cells (CD4+FoxP3) as % of CD4 T cells, and Tregs (CD4+FoxP3+) as % of CD4 T cells. ns, not significant by one-way ANOVA. (E) Graph depicts log-transformed ratio of CD4 Te to CD8 T cells from cLN of recipient mice from each group (x-axis). ns, indicates not significant by one-way ANOVA.
Figure 4.
Figure 4.
IL-27 signaling confers a competitive advantage for effector T cells infiltrating lacrimal glands. (A) Schematic of experimental set up depicting bulk cLN cells from CD45.1+ male Rα KO NOD mice combined with bulk cLN cells from CD45.2+ congenic male WT NOD mice and co-transferred to NOD-SCID recipient mice (n = 14 combined from three independent transfers). Seven weeks later cells were isolated from cLN and lacrimal glands of recipient mice and subjected to flow cytometry. (B-D) Representative plots (left, B-C; top, D) of cells isolated from lacrimal glands of recipient mice including (B) T cells as % of singlets, (C) CD8 T cells as % of T cells, (D) CD4 Te (CD4+FoxP3; left) and Tregs (CD4+FoxP3+; right) as % of CD4 T cells. Graphs (right, B-C; bottom, D) depict the log-transformed ratio of KO to WT demonstrating relative enrichment of KO (above x-axis) or WT (below x-axis) donor cells recovered from within recipient lacrimal glands (Gland) or cLN as indicated (x-axis). Enrichment was calculated as Log2[%CD45.1+/%CD45.2+]. P values by paired t-test, ***P<0.001, and **** P < 0.0001. Data are pooled from three independent co-transfers. Symbols represent individual mice with different symbols used for recipients of each independent transfer. Bars represent means, error bars are SD.
Figure 5.
Figure 5.
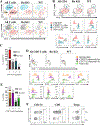
Intrinsic IL-27 signaling promotes T follicular helper (Tfh)-like CD4 T cells and exhausted-like CD8 T cells in the lacrimal glands. Bulk cLN cells from male CD45.1+ Rα KO NOD mice were co-transferred with bulk cLN cells from CD45.2+ congenic WT NOD mice into NOD-SCID recipient mice (n = 9) as in Fig 4A. Seven weeks later cells were isolated from lacrimal glands of recipient mice and subjected to flow cytometry. (A) Live, CD45+CD19TCRβ+ T cells were concatenated from all recipients and subjected to t-SNE analysis then clustered into 12 T cell populations by FlowSOM. TOP: T-SNE plots depict CD8 T cells (orange), CD4 Te (red) and Tregs (blue) from All T cells (left), Rα KO (middle) and WT (right) with populations defined by conventional gating. BOTTOM: FlowSOM-defined clusters are represented by different colors for All T cells (left), Rα KO (middle), and WT (right) T cells. Numbers indicate FlowSOM-defined populations. (B) CD4 Te populations from A (1–4) are depicted on t-SNE plot from All, Rα KO, or WT CD4 Te cells as indicated above plots. Histograms demonstrate differential expression of cell surface proteins (x-axis) in the FlowSOM-defined CD4 Te populations from All CD4 Te cells with population identities indicated (see text for details). (C) Graph depicting frequency (% of all CD4 Te) of CD4 Te populations defined in B with WT as open color and Rα KO as checkered. Fold change of enriched population indicated above bars. (D) CD8 populations from A (5–8) are depicted on t-SNE plots from All, Rα KO, or WT CD8 T cells. Histograms demonstrate differential expression of cell surface proteins (x-axis) in the FlowSOM-defined CD8 populations (5–8) from all CD8 T cells. For some plots gMFI is indicated for each population. (E) Graph depicts frequency (% of CD8 T cells) of CD8 T cell populations defined in D with WT as open color and Rα KO as checkered. Fold change of enriched population indicated above bars. (F) Contour plots demonstrate PD-1 expression on CD4 Te, CD8 T cells, and Tregs with WT (CD45.2) and Rα KO (CD45.1) separated based on CD45 isoform (y-axis). The indicated gates represent the PD-1hi expressing cells. Numbers indicate the frequency of cells within the indicated PD-1hi gates.

References

    1. Vivino FB, Bunya VY, Massaro-Giordano G, Johr CR, Giattino SL, Schorpion A et al. Sjogren’s syndrome: An update on disease pathogenesis, clinical manifestations and treatment. Clinical immunology (Orlando, Fla) 2019;203:81–121. - PubMed
    1. Verstappen GM, Kroese FGM, Bootsma H. T cells in primary Sjögren’s syndrome: targets for early intervention. Rheumatology 2021;60:3088–98. - PMC - PubMed
    1. Yao Y, Ma J-F, Chang C, Xu T, Gao C-Y, Gershwin ME et al. Immunobiology of T cells in Sjögren’s syndrome. Clinical Reviews in Allergy & Immunology 2021;60:111–31. - PubMed
    1. Singh N, Cohen PL. The T cell in Sjogren’s syndrome: force majeure, not spectateur. J Autoimmun 2012;39:229–33. - PMC - PubMed
    1. Adamson T 3rd, Fox R, Frisman D, Howell F. Immunohistologic analysis of lymphoid infiltrates in primary Sjogren’s syndrome using monoclonal antibodies. Journal of immunology (Baltimore, Md: 1950) 1983;130:203–8. - PubMed

MeSH terms