. 2024 May 24;15(1):4450.
doi: 10.1038/s41467-024-48724-0.

HDAC activity is dispensable for repression of cell-cycle genes by DREAM and E2F:RB complexes

Affiliations

HDAC activity is dispensable for repression of cell-cycle genes by DREAM and E2F:RB complexes

Alison K Barrett et al. Nat Commun. .

Abstract

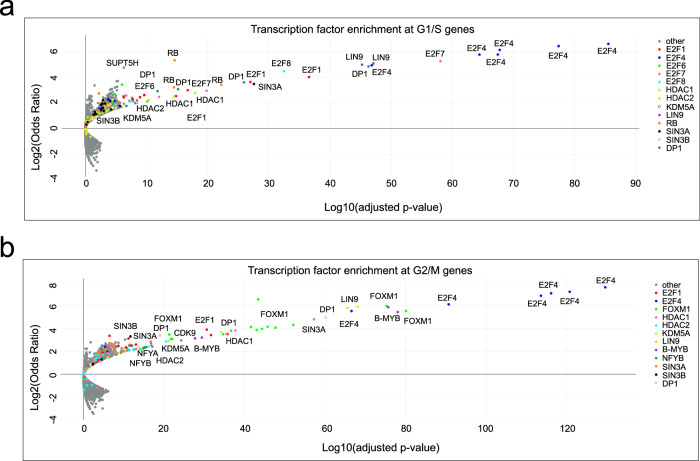
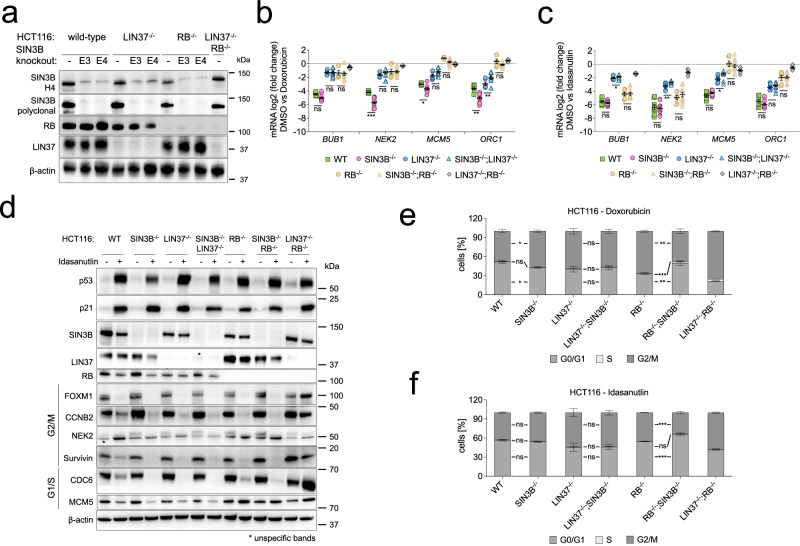
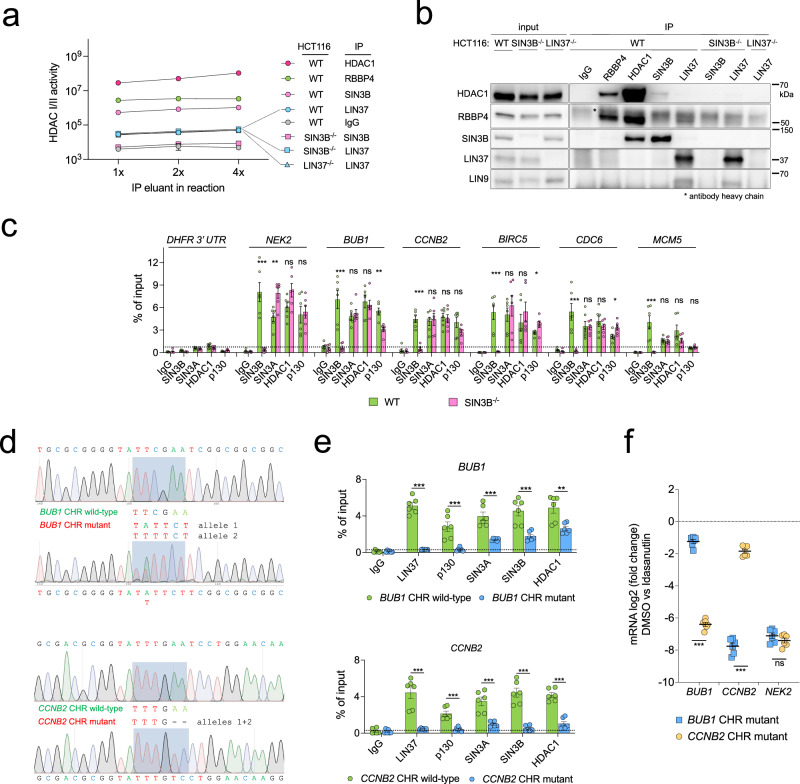
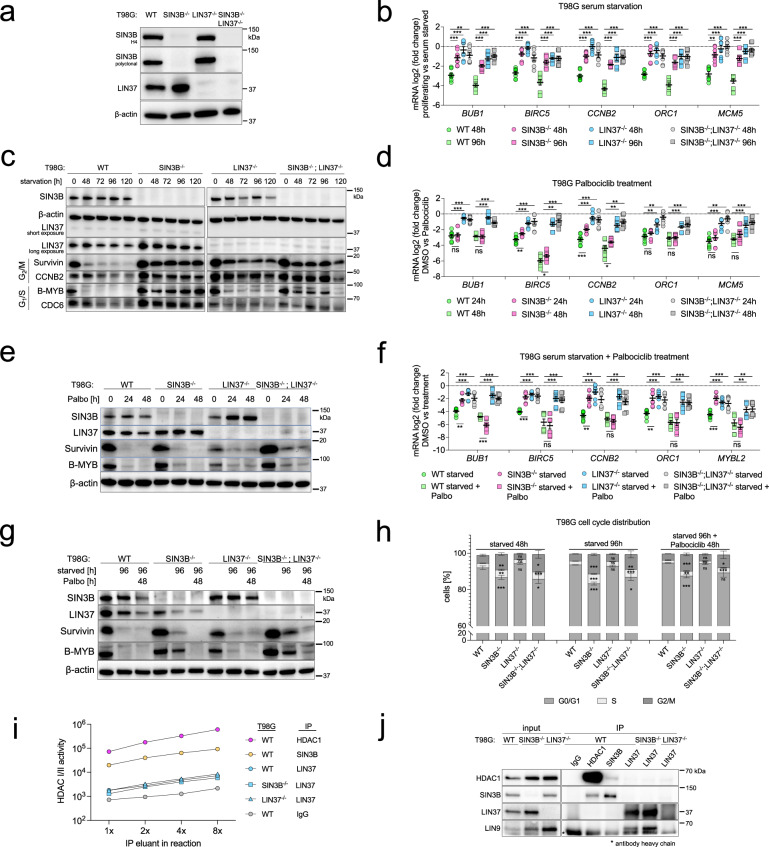
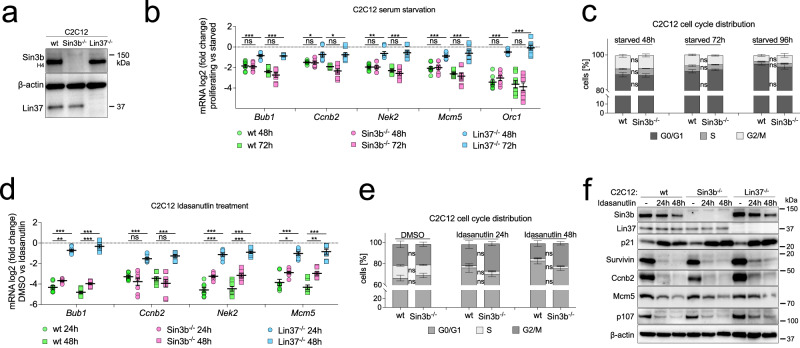
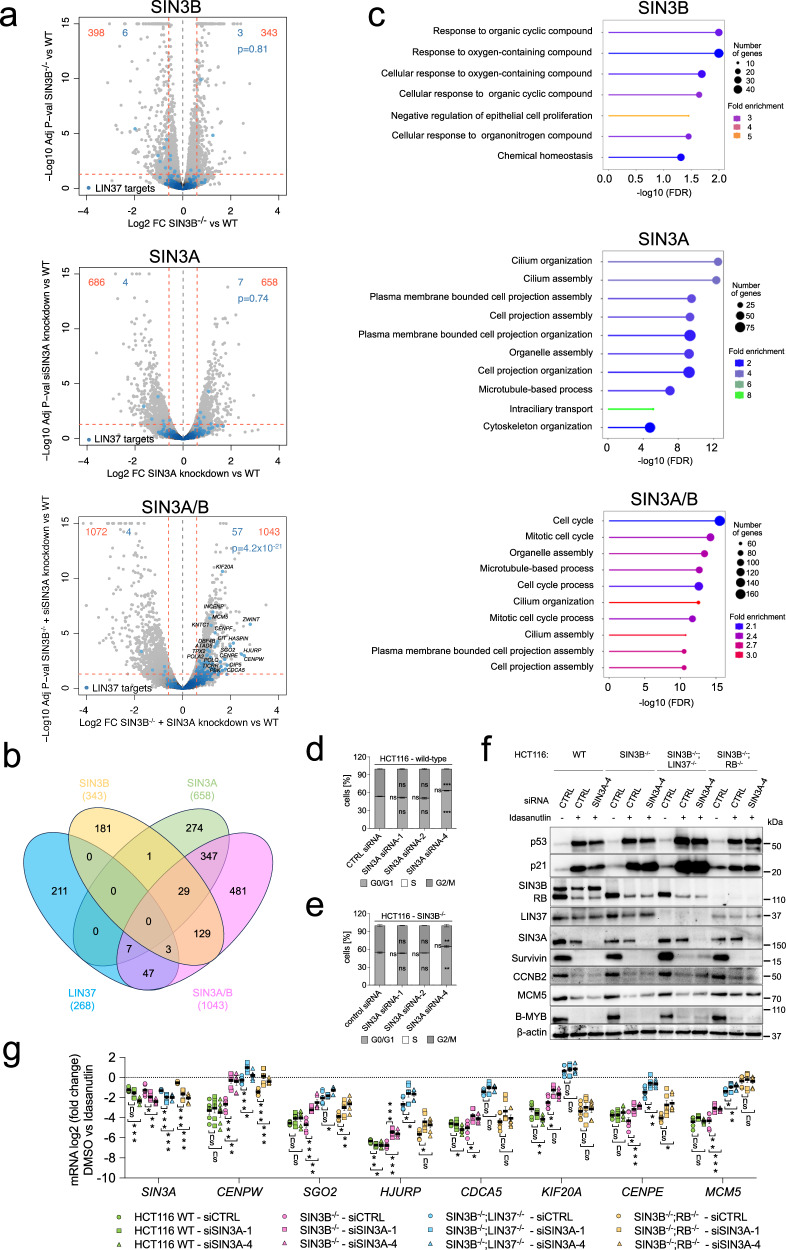
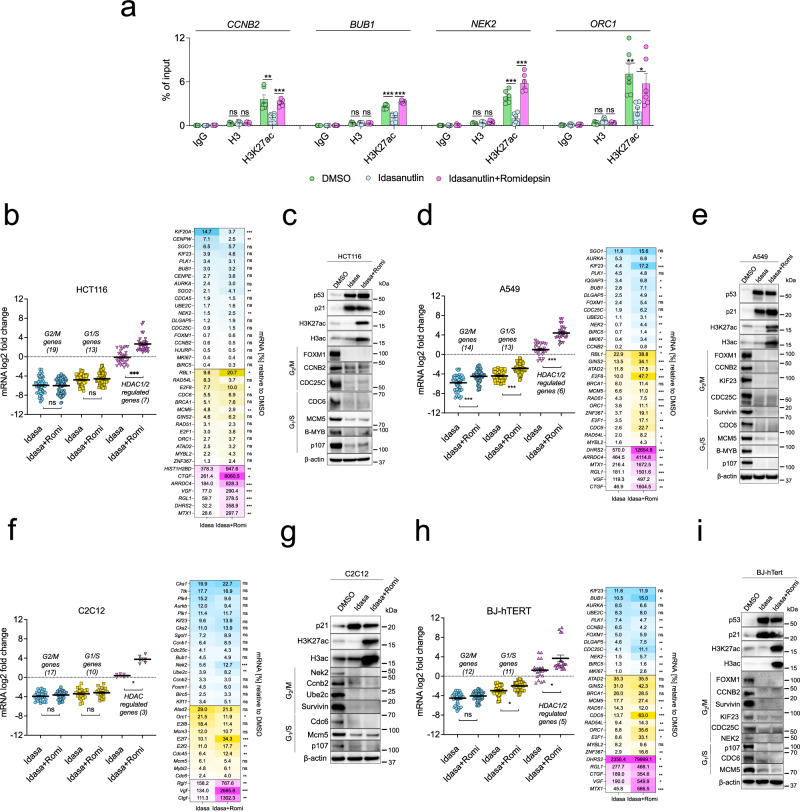
Histone deacetylases (HDACs) play a crucial role in transcriptional regulation and are implicated in various diseases, including cancer. They are involved in histone tail deacetylation and canonically linked to transcriptional repression. Previous studies suggested that HDAC recruitment to cell-cycle gene promoters via the retinoblastoma (RB) protein or the DREAM complex through SIN3B is essential for G1/S and G2/M gene repression during cell-cycle arrest and exit. Here we investigate the interplay among DREAM, RB, SIN3 proteins, and HDACs in the context of cell-cycle gene repression. Knockout of SIN3B does not globally derepress cell-cycle genes in non-proliferating HCT116 and C2C12 cells. Loss of SIN3A/B moderately upregulates several cell-cycle genes in HCT116 cells but does so independently of DREAM/RB. HDAC inhibition does not induce general upregulation of RB/DREAM target genes in arrested transformed or non-transformed cells. Our findings suggest that E2F:RB and DREAM complexes can repress cell-cycle genes without relying on HDAC activity.


Conflict of interest statement

The authors declare no competing interests.

Figures

Fig. 1
Fig. 1. In silico identification of chromatin-binding proteins enriched at the promoters of G1/S and G2/M DREAM target genes.
The TFEA.ChIP tool was utilized for screening the ReMap2022 database for chromatin-binding proteins enriched at the promoters of (a) G1/S (n = 109) or (b) G2/M (n = 132) DREAM target genes (Supplementary Data 3). TFEA.ChIP maps ChIP-Seq peaks onto regulatory regions defined by the GeneHancer database and associates these peaks with the genes regulated by those regions. The plots show Log2(Odds Ratio) versus Log10(adjusted p-value) as calculated by the TFEA.ChIP tool for each protein (represented as a single dot) in all included ChIP-Seq experiments.
Fig. 2
Fig. 2. SIN3B is not essential for the repression of G1/S and G2/M cell-cycle genes as a response to DNA damage or p53 activation in HCT116 cells.
a HCT116 cell lines negative for SIN3B were generated with a CRISPR/Cas9-nickase approach. Two pairs of guide RNAs, one targeting exon 3 and one targeting exon 4, were selected. Knockout clones were confirmed with antibodies binding epitopes within amino acids 172-228 (SIN3B-H4) or amino acids 668-758 (SIN3B polyclonal). Cells negative for SIN3B and LIN37 or RB were generated based on single knockout clones that we described earlier. b mRNA expression of G2/M (BUB1, NEK2) and G1/S (MCM5, ORC1) cell-cycle genes was analyzed by RT-qPCR in wild-type (WT) and knockout lines after 48 hours treatment with 0.5 µM Doxorubicin. The log2 fold change between untreated and treated cells is shown. Two independent SIN3B-/-, SIN3B-/-;LIN37-/-, and SIN3B-/-;RB-/- clones were compared with wild-type cells and one LIN37-/-, RB-/-, and LIN37-/-;RB-/- clone. The data set contains three biological replicates, and each one was measured with two technical replicates. c Same experimental setup as in (b), but gene repression was induced by treatment with 5 µM Idasanutlin for 48 hours. d Protein expression of HCT116 wild-type and knockout cells after treatment with DMSO or 5 µM Idasanutlin for 48 hours was analyzed by Western blotting. One representative experiment out of three replicates is shown. e Cell-cycle distribution of HCT wild-type (WT) and knockout lines after 48 hours of 0.5 µM Doxorubicin treatment was analyzed by DNA staining with propidium iodide and flow cytometry. Two independent clones for each line were measured with two biological replicates. f Same experimental setup as in (e), but cells were treated with 5 µM Idasanutlin. Data in panels (b), (c), (e), and (f) are presented as mean values ± SEM. Significances were calculated with the two-tailed Student’s T-Test (ns – not significant, * p ≤.05, ** p ≤ .01, *** p ≤ .001). Source data are provided as a Source Data file.
Fig. 3
Fig. 3. Binding of SIN3/HDAC to DREAM and cell-cycle gene promoters.
a HDACI/II activity of samples immunoprecipitated with the indicated antibodies from HCT116 wild-type and knockout cells treated with 5 µM Idasanutlin for 48 hours. Each data point contains four technical replicates ( ± SEM) of a representative experiment. Two biological replicates produced comparable results. b Protein expression and immunoprecipitation efficiency of the samples analyzed in (a) were evaluated by Western blotting. Two biological replicates produced comparable results. c ChIP-qPCR was performed to analyze the binding of SIN3B, SIN3A, HDAC1, and the DREAM component p130 to DREAM target gene promoters in wild-type and SIN3B-/-cells. A non-promoter region in the 3’ untranslated region of the DHFR gene (DHFR 3’ UTR) was amplified as a negative control. d HCT116 clonal cell lines containing a non-functional CHR element in the BUB1 or CCNB2 promoter on both alleles were created by CRISPR/Cas9-mediated knock-in. Sanger sequencing confirmed the mutation of the elements. e The binding of SIN3A, SIN3B, and HDAC1 to the BUB1 or CCNB2 promoter in the cell lines described in (d) was studied by ChIP-qPCR. Loss of DREAM binding upon mutation of the CHR was verified by analyzing the binding of the DREAM components LIN37 and p130. Note the BUB1 CHR wild-type cell line in this experiment is the CCNB2 CHR mutant line and vice versa. f mRNA expression of BUB1, CCNB2, and NEK2 was analyzed by RT-qPCR in the HCT116 clones carrying mutated CHR sites in the BUB1 or CCNB2 promoter after 48 hours treatment with 5 µM Idasanutlin. The log2 fold change between untreated and treated cells is shown. For experiments in (c), (e), and (f), averages of three independent experiments measured with two technical replicates are shown and presented as mean values ± SEM. Significances were calculated with the two-tailed Student’s T-Test (ns – not significant, * p ≤.05, ** p ≤ .01, *** p ≤ .001). Source data are provided as a Source Data file.
Fig. 4
Fig. 4. Loss of SIN3B does not phenocopy LIN37 deficiency in T98G cells.
a A CRISPR/Cas9-nickase approach to introduce mutations in exon 4 of SIN3B and exon 6 of LIN37 was applied to generate cell lines negative for SIN3B, LIN37, or both proteins. SIN3B knockout clones were confirmed with antibodies targeting amino acids 172-228 (SIN3B-H4) or amino acids 668-758 (SIN3B polyclonal). LIN37 knockout was confirmed with a polyclonal antibody raised against full-length LIN37. b mRNA expression of G2/M (BUB1, CCNB2, BIRC5) and G1/S (MCM5, ORC1) cell-cycle genes was analyzed by RT-qPCR in wild-type and knockout lines arrested by serum-starvation for 48 and 96 hours. Two independent SIN3B-/-, LIN37-/-, and SIN3B-/-;LIN37-/- clones were compared with two wild-type (WT) clones. Averages of two biological replicates measured with two technical replicates each are given. c Protein expression of one of the wild-type and knockout clones measured in (b) was analyzed by Western blotting. Samples were derived from the same experiment and blots were processed in parallel. Similarly, d mRNA expression and e protein levels of cell-cycle genes were analyzed in two wild-type or knockout lines treated with 10 µM Palbociclib for 24 or 48 hours. f Indicated wild-type and knockout lines (two clones each) were serum-starved for 96 hours with or without 10 µM Palbociclib for the final 48 hours. mRNA was measured (two biological replicates with two technical replicates each) and compared with untreated wild-type mRNA levels. g Samples shown in (f) were analyzed for protein expression by Western blotting. h Cell-cycle distribution of T98G wild-type (WT) and knockout lines was analyzed by DNA staining with propidium iodide and flow cytometry. Two independent clones for each line were measured with three biological replicates. i HDACI/II activity of samples immunoprecipitated from T98G wild-type and knockout cells serum-starved for 96 hours with the indicated antibodies. Each data point contains four technical replicates of a representative experiment. Two biological replicates produced similar results. j Protein expression and immunoprecipitation efficiency of the samples analyzed in (i) were evaluated by Western blotting. Data in Figs. (b), (d), (f), (h), and (i) are given as mean values ± SEM, and significances were calculated with the two-tailed Student’s T-Test (ns – not significant, * p ≤.05, ** p ≤ .01, *** p ≤ .001). At least two biological replicates were performed for each Western blot experiment, and the results were similar. Source data are provided as a Source Data file.
Fig. 5
Fig. 5. Sin3b knockout does not phenocopy loss of Lin37 in mouse C2C12 cells.
a A CRISPR/Cas9-nickase approach was applied to generate cell lines negative for Sin3b. Sin3b knockout clones were confirmed with antibodies targeting an epitope within amino acids 172-228 (SIN3B-H4). Lin37-/- C2C12 cells were described before (Mages et al. 2017). b mRNA expression of cell-cycle genes was analyzed by RT-qPCR in wild-type and knockout lines arrested by serum starvation over 48 and 72 hours. Two wild-type, two Lin37-/-, and two SIN3B-/- clones were measured with two biological and two technical replicates each. c Cell-cycle distribution of C2C12 wild-type (WT) and Sin3b knockout lines was analyzed by DNA staining with propidium iodide and flow cytometry. Two independent clones for each line were measured with two biological replicates. d mRNA expression of cell-cycle genes was analyzed by RT-qPCR in the same wild-type and knockout lines shown in (b) treated with 5 µM Idasanutlin for 24 and 48 hours. e Same experimental setup as in (c), but cells were arrested with Idasanutlin instead of serum-starvation. f The protein expression of one clone analyzed in (d) was studied by Western blot. Data in (b), (c), (d), and (e) are presented as mean values ± SEM. Significances were calculated with the two-tailed. Student’s T-Test (ns – not significant, * p ≤.05, ** p ≤ .01, *** p ≤ .001). Western blot experiments were performed with at least two biological replicates with similar results. Source data are provided as a Source Data file.
Fig. 6
Fig. 6. Combined depletion of SIN3A and SIN3B derepresses a subset of cell-cycle genes independently of DREAM or RB.
Transcriptome analyses were performed with HCT116 wild-type (WT) and SIN3B-/- HCT116 cells transfected either with a non-targeting siRNA or with SIN3A siRNAs for 48 hours and treated with Idasanutlin for the final 24 hours. a Volcano plots show up and downregulated genes in comparison to wild-type cells. Numbers of significantly regulated genes (p < 0.05, fold change ≥1.5) are shown in red. Genes identified as LIN37/DREAM targets before are highlighted in blue. The p-values indicate the probability that the respective overlap between LIN37 and SIN3-regulated genes could be observed by chance (hypergeometric test). b The number and overlap of LIN37 target genes identified in Uxa et al. and genes upregulated (p < 0.05; FC ≥ 1.5) in Idasanutlin-treated HCT116 cells depleted of SIN3A, SIN3B, or both proteins. c GO analyzes (biological processes) of significantly upregulated (p < 0.05; FC ≥ 1.5) genes. The top ten hits based on their false discovery rate (FDR, as calculated by ShinyGo) are shown. Cell-cycle distributions of d HCT116 wild-type and e SIN3B knockout lines were analyzed 48 hours after transfection with a control (CTRL) siRNA or three SIN3A siRNAs and Idasanutlin treatment for the final 24 hours. DNA was stained with propidium iodide and analyzed by flow cytometry. Averages of three biological replicates ± SEM are shown. f Wild-type, SIN3B-/-, SIN3B-/-;LIN37-/-, and SIN3B-/-;RB-/- knockout lines were transfected with non-targeting or SIN3A siRNAs for 48 hours, and Idasanutlin was applied for the final 24 hours. Protein levels were analyzed by Western blotting. A representative blot of cells transfected with either a non-silencing control RNA (CTRL) or SIN3A siRNA 1 is shown. A biological replicate with SIN3A siRNA 4 produced similar results. g mRNA levels of genes identified as significantly upregulated in SIN3A/B-depleted cells in the transcriptome analysis were evaluated by RT-qPCR. Cells were treated as described in (f) but additionally transfected with SIN3A siRNA 4. Averages (mean values ± SEM) of three biological and two technical replicates are given. Significances were calculated with the two-tailed Student’s T-Test (ns – not significant, * p ≤.05, ** p ≤ .01, *** p ≤ .001). Source data are provided as a Source Data file.
Fig. 7
Fig. 7. HDAC activity is not generally required for cell-cycle gene repression in arrested cells.
In all the following experiments, cells were treated with 5 µM Idasanutlin for 48 hours and 4 nM Romidepsin for the final 24 hours. a H3K27 acetylation at cell-cycle gene promoters in HCT116 cells was analyzed by ChIP-qPCR. Three biological replicates with two technical replicates (mean values ± SEM) are shown. Changes in mRNA levels are presented as gene-set clusters (left) and individual genes (right) for experiments performed with b HCT116, d A549, f C2C12, and h BJ-hTERT cells. The datasets contain two biological replicates with two technical replicates each. Mean values ± SEM are shown, and significances were calculated with the two-tailed Students T-Test (ns – not significant, * p ≤.05, ** p ≤ .01, *** p ≤ .001). Protein expression and histone acetylation were evaluated via Western blotting with the indicated antibodies using (c) HCT116, e A549, g C2C12, and i BJ-hTERT cells. An additional biological replicate for each Western blot experiment produced similar results. Source data are provided as a Source Data file.

Update of

Similar articles

Cited by

References

    1. Falkenberg KJ, Johnstone RW. Histone deacetylases and their inhibitors in cancer, neurological diseases and immune disorders. Nat. Rev. Drug Discov. 2014;13:673–691. doi: 10.1038/nrd4360. - DOI - PubMed
    1. Shvedunova M, Akhtar A. Modulation of cellular processes by histone and non-histone protein acetylation. Nat. Rev. Mol. Cell Biol. 2022;23:329–349. doi: 10.1038/s41580-021-00441-y. - DOI - PubMed
    1. Morgan MAJ, Shilatifard A. Reevaluating the roles of histone-modifying enzymes and their associated chromatin modifications in transcriptional regulation. Nat. Genet. 2020;52:1271–1281. doi: 10.1038/s41588-020-00736-4. - DOI - PubMed
    1. Kelly RD, Cowley SM. The physiological roles of histone deacetylase (HDAC) 1 and 2: complex co-stars with multiple leading parts. Biochem Soc. Trans. 2013;41:741–749. doi: 10.1042/BST20130010. - DOI - PubMed
    1. Emmett MJ, Lazar MA. Integrative regulation of physiology by histone deacetylase 3. Nat. Rev. Mol. Cell Biol. 2019;20:102–115. doi: 10.1038/s41580-018-0076-0. - DOI - PMC - PubMed

MeSH terms

Substances