. 2024 May 24;15(1):4434.
doi: 10.1038/s41467-024-48331-z.

Hyperactivity of indirect pathway-projecting spiny projection neurons promotes compulsive behavior

Affiliations

Hyperactivity of indirect pathway-projecting spiny projection neurons promotes compulsive behavior

Sean C Piantadosi et al. Nat Commun. .

Abstract

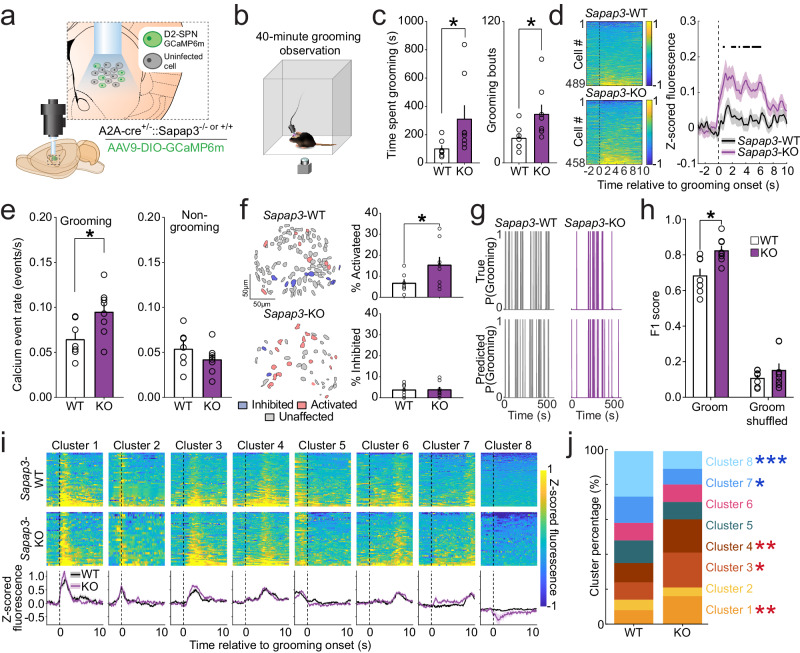
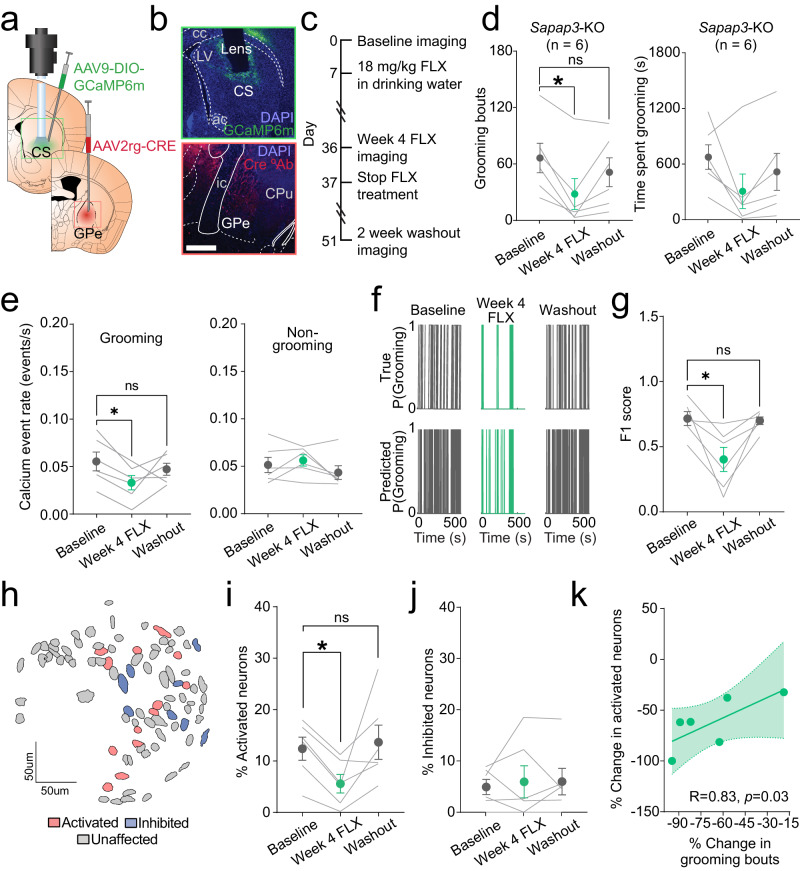
Compulsive behaviors are a hallmark symptom of obsessive compulsive disorder (OCD). Striatal hyperactivity has been linked to compulsive behavior generation in correlative studies in humans and causal studies in rodents. However, the contribution of the two distinct striatal output populations to the generation and treatment of compulsive behavior is unknown. These populations of direct and indirect pathway-projecting spiny projection neurons (SPNs) have classically been thought to promote or suppress actions, respectively, leading to a long-held hypothesis that increased output of direct relative to indirect pathway promotes compulsive behavior. Contrary to this hypothesis, here we find that indirect pathway hyperactivity is associated with compulsive grooming in the Sapap3-knockout mouse model of OCD-relevant behavior. Furthermore, we show that suppression of indirect pathway activity using optogenetics or treatment with the first-line OCD pharmacotherapy fluoxetine is associated with reduced grooming in Sapap3-knockouts. Together, these findings highlight the striatal indirect pathway as a potential treatment target for compulsive behavior.


Conflict of interest statement

The authors declare no competing interests.

Figures

Fig. 1
Fig. 1. Central striatum is hyperactive in Sapap3-KO mice during grooming.
a Experimental design for imaging central striatal (CS) neurons (left) and representative histological image of GCaMP6m expression and lens placement in CS (right). Brain atlas overlay used with permission of Elsevier Science and Technology Journals from Paxinos and Franklin’s the Mouse Brain in Stereotaxic Coordinates, Franklin Keith B.J., Paxinos, George, volume 5, copyright year 2019; permission conveyed through Copyright Clearance Center, Inc. b Schematic of behavioral apparatus. c Sapap3-KO mice (n = 11, 6 male / 5 female) spend significantly more time grooming (left; two-tailed unpaired t-test, t(18) = 3.51, p = 0.003) and engage in significantly more grooming bouts (right; two-tailed unpaired, t-test t(18) = 2.56, p = 0.02) than Sapap3-WT mice (n = 8, 5 male/3 female). d Contour map of putative CS neurons overlayed on peak-to-noise ratio image (left). Individual traces of selected neurons in field of view (FOV) overlayed on top of grooming (blue) behavior (right). e Probability of grooming in a representative Sapap3-WT (left, n = 8, 5 male / 3 female) and Sapap3-KO mouse (right, n = 11, 6 male/5 female). Top traces represent real grooming behavior; bottom represents grooming predicted via RUSBoost decoder. SPN population F1 score 2 x (precision x recall) / (precision + recall) is greater for grooming than for shuffled grooming behavior [two-way repeated measures ANOVA; main effect of behavior type; F(1,17) = 81.41, p < 0.0001]. Main effect of genotype [F(1,17) = 3.57, p = 0.001]. Interaction between genotype and behavior type [F(1,17) = 0.78, p = 0.04]. Grooming F1 score was improved in Sapap3-KOs (teal) relative to -WTs (white) [Sidak’s multiple comparisons test, t(34) = 3.69, p = 0.002]. f Trial averaged activity aligned to grooming start across all cells in Sapap3-WT (top; n = 1176 neurons) and Sapap3-KO mice (bottom; n = 1403 neurons). Black dotted line indicates groom start. CS neurons display elevated activity at grooming start in Sapap3-KOs compared to Sapap3-WTs (two-tailed unpaired t-test, all significant t(2577) ≥ 3.61, p ≤ 0.00038; thick black line in figure). Shading indicates ±SEM. g Mean Z-score fluorescence during pre-grooming (open circles) and grooming (closed circles) periods for Sapap3-KO (teal, n = 11, 6 male/5 female) and -WT (black, n = 8, 5 male / 3 female) mice. Significant main effects of time [Two-way repeated measures ANOVA; F(1,17) = 16.43, p = 0.0008] and genotype [F(1,17) = 8.97, p = 0.008] and an interaction between time and genotype [F(1,17) = 7.16, p = 0.016] were detected. No difference between pre-grooming and grooming mean fluorescence was detected for WT mice (p = 0.61), while a significant increase in grooming fluorescence relative to pre-grooming was observed for KOs [t(17) = 5.19, p = 0.0001]. h Calcium event rates are elevated during compulsive grooming in Sapap3-KOs (n = 11, 6 male/5 female) relative to -WT (n = 8, 5 male/3 female) mice (two-tailed unpaired t-test, t(17) = 2.31, p = 0.033). No difference in calcium event rates for all other times during the session (two-tailed unpaired t-test, t(17) = 1.07, p = 0.30). i Representative traces of cells classified as grooming-onset activated (red), grooming-onset inhibited (blue), and unaffected at grooming onset (grey) in a Sapap3-WT (left) and Sapap3-KO mouse (right). j Representative contour maps of individual CS neurons colored according to (i). k Sapap3-KO mice (n = 11, 6 male/5 female) have a significantly greater percentage of CS neurons activated at grooming onset compared to Sapap3-WT mice (n = 8, 5 male/3 female, two-tailed unpaired t-test, t(17) = 4.56, p = 0.0003). No difference in percentage of grooming-onset inhibited cells between genotypes (p = 0.08). ***p ≤ 0.001, **p ≤ 0.01, *p ≤ 0.05. Data are presented as mean values +/− SEM. Source data are provided as a Source Data file.
Fig. 2
Fig. 2. D1-SPNs are not hyperactive at grooming onset in Sapap3-KO mice.
a Experimental design for selective imaging of D1-SPNs. Brain atlas overlay used with permission of Elsevier Science and Technology Journals from Paxinos and Franklin’s the Mouse Brain in Stereotaxic Coordinates, Franklin Keith B.J., Paxinos, George, volume 5, copyright year 2019; permission conveyed through Copyright Clearance Center, Inc. b Schematic of behavioral apparatus. c Sapap3-KO (n = 6: 4 male / 2 female) mice spend significantly more time grooming (left; two-tailed Mann-Whitney test, U = 8, p = 0.04) and engage in significantly more grooming bouts (right, two-tailed Mann-Whitney test, U = 5, p = 0.01) than Sapap3-WT (n = 8: 3 male/5 female) mice. d Trial averaged activity aligned to grooming start across all cells in Sapap3-WT (top; n = 1064) and Sapap3-KO mice (bottom; n = 691). Black dotted line indicates groom start. No significant difference between Sapap3-WTs and Sapap3-KOs in overall grooming onset D1-SPN activity (two-tailed unpaired t-test, all t(1753) ≤ 2.81, p ≥ 0.00038). Shading indicates ±SEM. e D1-SPN calcium event rates are not significantly different during grooming (left) and non-grooming (right) periods in Sapap3-KOs (n = 6: 4 male / 2 female) compared to -WT (n = 8: 3 male / 5 female) mice (two-tailed Mann-Whitney test, p = 0.41). f Contour map of D1-SPNs colored according to their activity (red=activated, blue=inhibited, grey=unaffected) at onset of grooming (left). Average percentage of activated and inhibited D1-SPNs in -WT (n = 8: 3 male/5 female) and Sapap3-KO (n = 6: 4 male/2 female) mice (two-tailed Mann-Whitney test, p = 0.30 and p = 0.56, respectively). g Probability of grooming in a representative Sapap3-WT (left) and Sapap3-KO mouse (right). Top traces represent real grooming behavior; bottom represents grooming predicted via RUSBoost decoder based on D1-SPN population activity. h D1-SPN population decoding F1 score is greater for grooming than for shuffled grooming (Two-way repeated measures ANOVA, main effect of behavior type; F(1,12) = 566.9, p < 0.0001). No main effect of genotype (F(1,12) = 3.17, p = 0.10) or interaction between genotype and behavior type was observed (F(1,12) = 2.25, p = 0.16). i Functional clustering of trial averaged grooming-onset activity in D1-SPNs in -WT (top, n = 8: 3 male / 5 female) and Sapap3-KO mice (middle, n = 6: 4 male /2 female) represented as a heatmap. Functional clustering identified 8 distinct functional clusters (bottom). Mean grooming-onset activity of each cluster in -WT (black) and Sapap3-KOs (orange). Black dotted line indicates grooming. j Compared to -WTs, Sapap3-KOs have a greater proportion of Cluster 3 (Chi-square test of proportions, X2(1) = 4.77, p = 0.03) and Cluster 8 (X2(1) = 8.76, p = 0.003) D1-SPNs; a significantly lower proportion of Cluster 2 (X2(1) = 3.62, p = 0.05) and Cluster 6 (X2(1) = 16.53, p = 0.0001) D1-SPNs; and no changes in Clusters 1, 4, 5, and 7. ***p ≤ 0.001, **p ≤ 0.01, *p ≤ 0.05. Data are presented as mean values +/− SEM. Source data are provided as a Source Data file.
Fig. 3
Fig. 3. D2-SPNs are hyperactive at grooming onset in Sapap3-KO mice.
a Experimental design for selective imaging of D2-SPNs. Brain atlas overlay used with permission of Elsevier Science and Technology Journals from Paxinos and Franklin’s the Mouse Brain in Stereotaxic Coordinates, Franklin Keith B.J., Paxinos, George, volume 5, copyright year 2019; permission conveyed through Copyright Clearance Center, Inc. b Schematic of behavioral apparatus. c Sapap3-KO (n = 8: 6 male/ 2 female) mice spend more time grooming (left; two-tailed Mann-Whitney test, U = 8, p = 0.02) and engage in significantly more grooming bouts (right; two-tailed Mann-Whitney test, U = 9, p = 0.03) than Sapap3-WT (n = 7: 5 male/ 2 female) mice. d Trial averaged activity aligned to grooming start across all cells in Sapap3-WT (top; n = 489) and Sapap3-KO mice (bottom; n = 458). Black dotted line indicates groom start. Median grooming bout duration for WTs (4.4 s) and KOs (6.1 s) two-tailed Mann-Whitney test (U = 11, p = 0.06). Groom-start aligned D2-SPN activity is significantly elevated in Sapap3-KOs compared to -WTs (all significant t(945) ≥ ± 3.58, p ≤ 0.00038; thick black lines in figure). Shading indicates ±SEM. e D2-SPN calcium event rates are elevated during grooming (left; two-tailed Mann-Whitney test, U = 7, p = 0.01) and unchanged during non-grooming (right; p = 0.33) periods in Sapap3-KOs (n = 8: 6 male/ 2 female) compared to -WT (n = 7: 5 male/ 2 female) mice (f) Contour map of D2-SPNs colored according to their activity (red=activated, blue=inhibited, grey=unaffected) at the onset of grooming (left). Sapap3-KOs (n = 8: 6 male/ 2 female) have a greater proportion of groom-onset activated D2-SPNs than -WT (n = 7: 5 male/ 2 female) mice (Mann-Whitney test, U = 13, p = 0.05), with no changes in the proportion of inhibited neurons (p = 0.49). g Probability of grooming in a representative Sapap3-WT (left) and Sapap3-KO mouse (right). Top traces represent real grooming behavior; bottom represents grooming predicted via an RUSBoost classifier based on D2-SPN population activity. h D2-SPN population decoding F1 score is greater for grooming than for shuffled grooming [Two-way repeated measures ANOVA, main effect of behavior type; F(1,13) = 826.0, p < 0.0001]. A main effect of genotype [F(1,13) = 6.04, p = 0.03] and significant interaction between genotype and behavior type was observed [(F(1,13) = 4.98, p = 0.04]. Classifier accuracy was higher during excessive grooming in Sapap3-KOs (n = 8: 6 male/ 2 female) compared to -WT (n = 7: 5 male/ 2 female) mice [Sidak’s multiple comparisons test, t(26) = 3.24, p = 0.007], with no difference when the classifier was trained on shuffled data (p = 0.54). i Functional clustering of trial averaged grooming-onset activity in D2-SPNs in -WT (top) and Sapap3-KO mice (middle) represented as a heatmap. Functional clustering identified 8 distinct functional clusters (bottom). Black dotted line indicates groom start. Mean grooming-onset activity of each cluster in -WT (black) and Sapap3-KO mice (purple). j Compared to -WTs, Sapap3-KO have a greater proportion of Cluster 1 (Chi-square test of proportions, X2(1) = 6.75, p = 0.01), Cluster 3 (X2(1) = 5.076, p = 0.024) and Cluster 4 (X2(1) = 7.65, p = 0.006) D2-SPNs; a significantly lower proportion of Cluster 7 (X2(1) = 5.52, p = 0.02) and Cluster 8 (X2(1) = 27.09, p < 0.0001) D2-SPNs; and no changes in Clusters 2, 5, and 6. ***p ≤ 0.001, **p ≤ 0.01, *p ≤ 0.05. Data are presented as mean values +/− SEM. Source data are provided as a Source Data file.
Fig. 4
Fig. 4. Inhibition of striatopallidal iSPNs reduces compulsive grooming behavior.
a Schematic of strategy for assessing iSPN expression of dopamine D1 and D2 receptors. Retrograde AAV2-CRE-eGFP was injected into globus pallidus external segment (GPe) and in situ hybridization performed 10 weeks later in CS for eGFP, Drd1a and Drd2. Brain atlas overlay used with permission of Elsevier Science and Technology Journals from Paxinos and Franklin’s the Mouse Brain in Stereotaxic Coordinates, Franklin Keith B.J., Paxinos, George, volume 5, copyright year 2019; permission conveyed through Copyright Clearance Center, Inc. b In situ hybridization image for retrograde eGFP (grey), Drd1a (green), and Drd2 (red). Arrows indicate eGFP+ neurons overlapping with Drd1a (green), Drd2 (red), or both Drd1a and Drd2 (yellow). Scale bar = 100 um. c Average percentage of eGFP+ neurons expressing Drd1a (25%), Drd2 (65%), or both (10%) in CS (n = 4 CS slices from 4 Sapap3-WT mice). d Schematic for inhibition of iSPNs. Retrograde AAV2-CRE-eGFP was injected bilaterally into GPe and AAV5-CAG-DIO-ArchT-tdTomato or AAV5-DIO-tdTomato was injected bilaterally into CS of WT and KO mice. Brain atlas overlay used with permission of Elsevier Science and Technology Journals from Paxinos and Franklin’s the Mouse Brain in Stereotaxic Coordinates, Franklin Keith B.J., Paxinos, George, volume 5, copyright year 2019; permission conveyed through Copyright Clearance Center, Inc. e 200 um optic fibers were placed bilaterally into CS; scale bar = 2 mm. f Mice received 20 trials of 30 s of 532 nm laser stimulation followed by 60 s of no laser, while behavior was recorded from a bottom view camera. g Raster plots of grooming bouts (black tic marks) during laser trials in representative Sapap3-KO tdTomato (top) and ArchT (bottom) mice. Green shading indicates duration of laser illumination (30 s). h No effect of laser illumination on number of grooming bouts in Sapap3-KOs expressing tdTomato control virus (n = 7, 2 male/5 female; Two-sided Wilcoxon matched-pairs signed rank test, p = 0.23). In Sapap3-KO mice expressing ArchT in iSPNs, laser illumination significantly reduced number of grooming bouts (n = 6, 2 male/4 female; Two-sided Wilcoxon matched-pairs signed rank test, p = 0.031). *p ≤ 0.05. Green shading indicates laser illumination. Data are presented as mean values +/− SEM. Source data are provided as a Source Data file.
Fig. 5
Fig. 5. Fluoxetine reduces compulsive grooming behavior and iSPN hyperactivity.
a Schematic of strategy for assessing effect of fluoxetine on iSPN activity during compulsive grooming. Retrograde AAV2-CRE was injected unilaterally into GPe and AAV9-DIO-GCaMP6m into ipsilateral CS followed by GRIN lens placement. Brain atlas overlay used with permission of Elsevier Science and Technology Journals from Paxinos and Franklin’s the Mouse Brain in Stereotaxic Coordinates, Franklin Keith B.J., Paxinos, George, volume 5, copyright year 2019; permission conveyed through Copyright Clearance Center, Inc. b (top) GCaMP6m expression in iSPNs and GRIN lens track in CS. (bottom) Immunohistochemical stain for Cre-recombinase (red) in GPe. Scale bar = 1 mm. c Timeline for experiments evaluating effect of fluoxetine on compulsive grooming behavior and iSPN activity. d (left) Fluoxetine significantly reduced number of grooming bouts in Sapap3-KOs [n = 6: 6 female mice; Friedman test (Fr(3,6) = 7.0, p = 0.03); Dunn’s multiple comparisons test, Baseline vs. Week 4 FLX (Z = 2.6, p = 0.03); Baseline vs. Washout (Z = 0.86, p = 0.99); Week 4 FLX vs. Washout (Z = 1.7, p = 0.25)]. (right) No effect of treatment on time spent grooming [Friedman test (Fr(3,6) = 6.3, p = 0.052)]. e (left) Fluoxetine treatment significantly reduced calcium event rates during grooming in KOs [n = 6, Friedman test (Fr(3,6) = 9.0, p = 0.008); Dunn’s multiple comparisons test, Baseline vs. Week 4 FLX (X = 2.6, p = 0.02)]. (right) No effect of fluoxetine on iSPN event rate during non-grooming time [Friedman test (Fr(3,6) = 4.3, p = 0.14)]. f (top) True grooming behavior during Baseline, Week 4 Fluoxetine, and Washout sessions in representative animal. (bottom) RUSBoost-predicted grooming based on iSPN population activity across days. g F1 score for RUSBoost classification of grooming behavior during Baseline, Week 4 Fluoxetine, and Washout sessions [n = 6, Friedman test (Fr(3,7) = 7.0, p = 0.03); Dunn’s multiple comparisons test, Baseline vs. Week 4 Fluoxetine, (X = 2.6, p = 0.03); Week 4 Fluoxetine vs. Washout (X = 2.6, p = 0.03); Baseline vs. Washout (X = 0.00, p = 0.99)]. h Contour map of striatopallidal iSPNs from representative KO colored according to baseline activity at grooming onset (red= activated, blue= inhibited, grey= unaffected). i Fluoxetine reduces percentage of grooming-onset activated striatopallidal iSPNs [n = 6, Friedman test (Fr(3,6) = 9.33,p = 0.006); Dunn’s multiple comparisons test, Baseline vs. Week 4 FLX (Z = 2.9, p = 0.01); Week 4 FLX vs. Washout (Z = 2.31, p = 0.06); Baseline vs. Washout (Z = 0.6, p = 0.99)]. j No effect of treatment on percentage of grooming-onset inhibited striatopallidal iSPNs [n = 6, Friedman test (Fr(3,6) = 0.09, p = 0.99)]. k Positive correlation between the percent change in grooming bouts and percent change in activated neurons following fluoxetine treatment in KO mice (Spearman R = 0.83, p = 0.03). **p ≤ 0.01,*p ≤ 0.05. cc=corpus callosum, LV=lateral ventricle, ac=anterior commissure, ic=internal capsule, CPu=caudate/putamen. Data are presented as mean values +/− SEM. Source data are provided as a Source Data file.

References

    1. Figee M, et al. Deep brain stimulation restores frontostriatal network activity in obsessive-compulsive disorder. Nat. Neurosci. 2013;16:386–387. doi: 10.1038/nn.3344. - DOI - PubMed
    1. Harrison BJ, et al. Altered corticostriatal functional connectivity in obsessive-compulsive disorder. Arch. Gen. Psychiatry. 2009;66:1189–1200. doi: 10.1001/archgenpsychiatry.2009.152. - DOI - PubMed
    1. Menzies L, et al. Integrating evidence from neuroimaging and neuropsychological studies of obsessive-compulsive disorder: the orbitofronto-striatal model revisited. Neurosci. Biobehav. Rev. 2008;32:525–549. doi: 10.1016/j.neubiorev.2007.09.005. - DOI - PMC - PubMed
    1. Rauch SL, Savage CR, Alpert NM, Fischman AJ, Jenike MA. The functional neuroanatomy of anxiety: a study of three disorders using positron emission tomography and symptom provocation. Biol. Psychiatry. 1997;42:446–452. doi: 10.1016/S0006-3223(97)00145-5. - DOI - PubMed
    1. Saxena S, Rauch SL. Functional neuroimaging and the neuroanatomy of obsessive-compulsive disorder. Psychiatr. Clin. North Am. 2000;23:563–586. doi: 10.1016/S0193-953X(05)70181-7. - DOI - PubMed

MeSH terms