Meta-Analysis
. 2024 May 24;15(1):4417.
doi: 10.1038/s41467-024-48394-y.

Validation of human telomere length multi-ancestry meta-analysis association signals identifies POP5 and KBTBD6 as human telomere length regulation genes

Rebecca Keener  1 Surya B Chhetri  1 Carla J Connelly  2 Margaret A Taub  3 Matthew P Conomos  4 Joshua Weinstock  1 Bohan Ni  5 Benjamin Strober  6 Stella Aslibekyan  7 Paul L Auer  8 Lucas Barwick  9 Lewis C Becker  10 John Blangero  11 Eugene R Bleecker  12   13 Jennifer A Brody  14 Brian E Cade  15   16 Juan C Celedon  17 Yi-Cheng Chang  18   19   20 L Adrienne Cupples  21   22 Brian Custer  23   24 Barry I Freedman  25 Mark T Gladwin  26 Susan R Heckbert  27 Lifang Hou  28 Marguerite R Irvin  29 Carmen R Isasi  30 Jill M Johnsen  31 Eimear E Kenny  32   33 Charles Kooperberg  34 Ryan L Minster  35 Take Naseri  36   37 Satupa'itea Viali  38   39   40 Sergei Nekhai  41 Nathan Pankratz  42 Patricia A Peyser  43 Kent D Taylor  44 Marilyn J Telen  45 Baojun Wu  46 Lisa R Yanek  47 Ivana V Yang  48 Christine Albert  49   50 Donna K Arnett  51 Allison E Ashley-Koch  45 Kathleen C Barnes  52 Joshua C Bis  14 Thomas W Blackwell  53   54 Eric Boerwinkle  55 Esteban G Burchard  56   57 April P Carson  58 Zhanghua Chen  59 Yii-Der Ida Chen  44 Dawood Darbar  60 Mariza de Andrade  61 Patrick T Ellinor  62 Myriam Fornage  63 Bruce D Gelb  64 Frank D Gilliland  59 Jiang He  65 Talat Islam  59 Stefan Kaab  66 Sharon L R Kardia  67 Shannon Kelly  23   68 Barbara A Konkle  69 Rajesh Kumar  70   71 Ruth J F Loos  32 Fernando D Martinez  72 Stephen T McGarvey  73 Deborah A Meyers  12   13 Braxton D Mitchell  74 Courtney G Montgomery  75 Kari E North  76 Nicholette D Palmer  77 Juan M Peralta  11 Benjamin A Raby  78   79 Susan Redline  15   16 Stephen S Rich  80 Dan Roden  81 Jerome I Rotter  44 Ingo Ruczinski  3 David Schwartz  82 Frank Sciurba  83 M Benjamin Shoemaker  84 Edwin K Silverman  15 Moritz F Sinner  66 Nicholas L Smith  65 Albert V Smith  85 Hemant K Tiwari  86 Ramachandran S Vasan  87 Scott T Weiss  15   49 L Keoki Williams  46 Yingze Zhang  88 Elad Ziv  56 Laura M Raffield  89 Alexander P Reiner  34 NHLBI Trans-Omics for Precision Medicine (TOPMed) ConsortiumTOPMed Hematology and Hemostasis Working GroupTOPMed Structural Variation Working GroupMarios Arvanitis  90 Carol W Greider  91   92 Rasika A Mathias  93 Alexis Battle  94   95   96   97   98
Affiliations
Meta-Analysis

Validation of human telomere length multi-ancestry meta-analysis association signals identifies POP5 and KBTBD6 as human telomere length regulation genes

Rebecca Keener et al. Nat Commun. .

Abstract

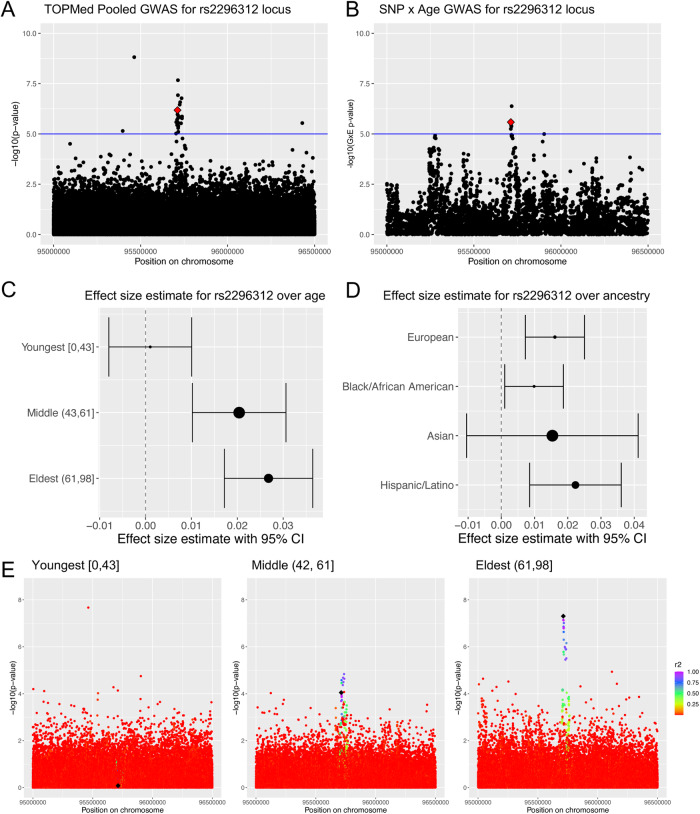
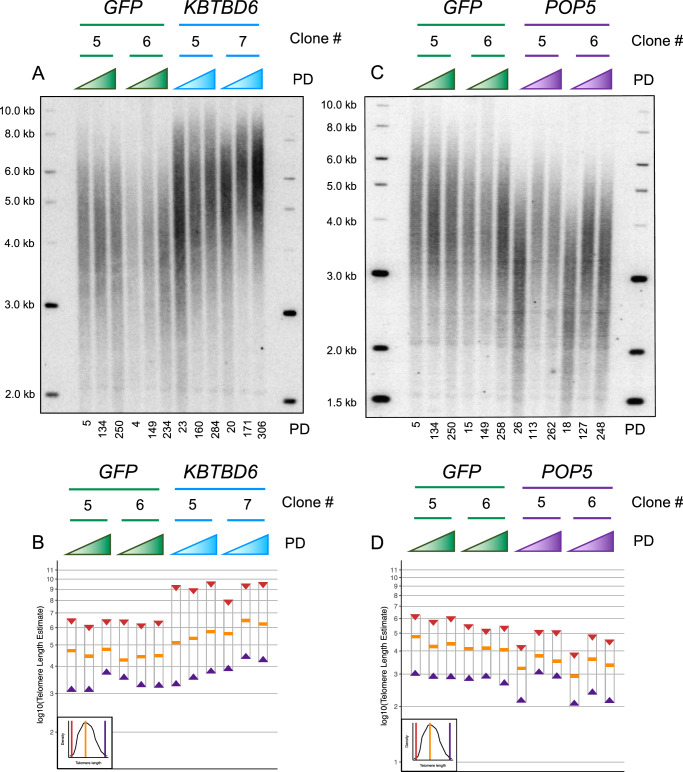
Genome-wide association studies (GWAS) have become well-powered to detect loci associated with telomere length. However, no prior work has validated genes nominated by GWAS to examine their role in telomere length regulation. We conducted a multi-ancestry meta-analysis of 211,369 individuals and identified five novel association signals. Enrichment analyses of chromatin state and cell-type heritability suggested that blood/immune cells are the most relevant cell type to examine telomere length association signals. We validated specific GWAS associations by overexpressing KBTBD6 or POP5 and demonstrated that both lengthened telomeres. CRISPR/Cas9 deletion of the predicted causal regions in K562 blood cells reduced expression of these genes, demonstrating that these loci are related to transcriptional regulation of KBTBD6 and POP5. Our results demonstrate the utility of telomere length GWAS in the identification of telomere length regulation mechanisms and validate KBTBD6 and POP5 as genes affecting telomere length regulation.


Conflict of interest statement

The authors declare the following competing interests: Juan C. Celedon received inhaled steroids from Merck for an NIH_funded study, unrelated to this work. Ivana V. Yang is a consultant for Eleven P15, a company focused on the early diagnosis and treatment of lung fibrosis. Dr. Patrick T. Ellinor receives sponsored research support from Bayer AG, IBM Research, Bristol Myers Squibb and Pfizer; he has also served on advisory boards or consulted for Bayer AG, MyoKardia and Novartis. Dr. David Schwartz is a founder and chief scientific officer of Eleven P15, a company focused on the early diagnosis and treatment of lung fibrosis. Laura M. Raffield is a consultant for the TOPMed Admistrative Coordinating Center (through Westat). Alexis Battle is a shareholder in Alphabet, Inc.; consultant for Third Rock Ventures, LLC; and founder of CellCipher, Inc. The views expressed in this manuscript are those of the authors and do not necessarily represent the views of the National Heart, Lung, and Blood Institute; the National Institutes of Health; or the U.S. Department of Health and Human Services. The remaining authors declare no competing interests.

Figures

Fig. 1
Fig. 1. Multi-ancestry meta-analysis of leukocyte telomere length identifies 5 novel signals.
Manhattan plot showing the results from the GWAS meta-analysis. SNPs with p-value < 0.1 are plotted. The novel signals are shown in blue. Red line indicates genome-wide significance after multiple testing correction (p < 5 × 10⁻⁸). The blue horizontal line indicates a suggestive threshold (p < 5 × 10⁻⁵). N = 211,369 individuals. The inset pie chart displays the proportion of broad ancestry groups used in the meta-analysis (Supplementary Data 1 and Source Data are provided as a Source Data file).
Fig. 2
Fig. 2. Fine-mapping analyses nominate putative causal variants and genes affecting telomere length.
A Colocalization events between a meta-analysis signal and a QTL for any gene across QTL datasets. B Colocalization of meta-analysis signals with any gene QTL in any cell type. C Manhattan plots for the meta-analysis signal near rs10111287 colored by r2 with the lead SNP (black diamond) and VIRMA eQTLs in three GTEx tissues. Colocalization results for each eQTL with the meta-analysis signal are indicated in the top right corner. Colocalization analysis between the eQTLs suggests there are shared causal SNPs: thyroid eQTL with stomach eQTL PPH3 = 0.090 PPH4 = 0.906, thyroid eQTL with whole blood eQTL PPH3 = 0.144 PPH4 = 0.745, stomach eQTL with whole blood eQTL PPH3 = 0.190 PPH4 = 0.655. D Manhattan plot for the meta-analysis signal near rs7193541 colored by r2 with the lead SNP (black diamond) and RFWD3 sQTL. Colocalization results for the QTL with the meta-analysis signal are in the top right corner. In the LeafCutter splicing cluster diagram gray boxes represent the RFWD3 exons involved in the splicing cluster, the central exon is exon 14 (hg38: chr16:74630780-74630957). Curved lines represent the average number of reads spanning each exon-exon junction across individuals. Thinner, purple curves represent lower expressed exon-exon junctions and thicker, pink/red curves represent higher expressed exon-exon junctions. The vertical gray line indicates the location of the lead SNP. The line at the bottom shows the linear base pair position of each exon and intron depicted in the plots. TT N = 167, TC N = 236, and CC N = 80. E. Manhattan plot showing the SuSiE 95% credible sets for the signal led by rs12637184. Credible set 1 (black diamonds, 10 SNPs) and credible set 2 (black squares, 4 SNPs). r2 is calculated with respect to the lead SNP. Source data are provided as a Source Data file.
Fig. 3
Fig. 3. Enrichment analysis of transcription factor binding sites of transcription factors with roles in telomere length regulation highlights a PAX5 binding site near PSMB4.
A Enrichment of 95% credible set SNPs across all transcription factors with ChIP-seq data available from ENCODE using a one-sided binomial test (Methods). Red points represent transcription factors with known roles in regulating telomere length maintainence (TLM) genes and blue points represent transcription factors with known roles in the alternative telomere lengthening (ALT) pathway. There were 320 transcription factors plotted (28 red, 8 blue, 284 gray). There were 18 transcription factors that fall at the (0,0) coordinate that are not plotted for the sake of clarity; one (XRCC3) had known roles in ALT. A complete list of transcription factors is provided in Supplementary Data 9 and source data are provided as a Source Data file. B ChIP-seq data for the indicated DNA binding factor (red) or histone mark (blue) was generated by ENCODE and downloaded as bigwig files from the UCSC genome browser. The gene structure and genomic coordinates are depicted below the ChIP-seq data.
Fig. 4
Fig. 4. TCL1A 95% credible set SNPs are more strongly associated with telomere length in older individuals.
A, B Manhattan plot for the region around rs2296312 (red diamond) using (A) summary statistics from TOPMed Pooled GWAS (B) summary statistics from age and genotype interaction GWAS. The log10(p-value) for the interaction covariate is plotted on the y-axis. C, D 95% confidence interval for the effect size estimate is shown and the size of the data point reflects the standard error. C Effect size estimate for rs2296312 (tested, minor allele = C) across age groups from the age-stratified GWAS. D Effect size estimate for rs2296312 across ancestry groups from ancestry-stratified GWAS. European MAC = 16,443; Black/ African MAC = 19,963; Asian MAC = 5,683; Hispanic/Latino MAC = 18,019. E Manhattan plots for the rs2296312 (black diamond) locus in age-stratified GWAS. Color indicates r2 calculated with respect to rs2296312. Source data for Fig. 4 are provided as a Source Data file.
Fig. 5
Fig. 5. Blood and immune cells are a key cell type for telomere length.
A Hierarchical clustering of the enrichment of meta-analysis lead SNPs in predicted states using the Roadmap Epigenomics 25 state chromHMM model (p-values from a one-sided binomial test). Dark red cells indicate the strongest enrichment, largely in predicted state 3: PromD1 (Promoter Downstream TSS 1) and largely for rows corresponding to Blood and T-cell samples. B, C Stratified LDSC was conducted on 130,246 meta-analyzed European individuals , using the 1000 Genomes European linkage disequilibrium reference panel. Each dot represents a cell type assigned to the broader tissue categories specified on the x-axis by Finucane et al. 2018. The gray dotted line represents the significance threshold of FDR < 0.05 at –log10(p-value) = 2.75. Source data for Fig. 5 are provided as a Source Data file.
Fig. 6
Fig. 6. Overexpression of POP5 or KBTBD6 increases telomere length in HeLa-FRT cells.
KBTBD6, POP5, or GFP was constitutively overexpressed from the CMV promoter in HeLa-FRT cells using the FLP-in system. A, C Telomere Southern blots showing the bulk telomere length from a population of cells. Molecular weight standards were run alongside the samples and their size is indicated in kilobases (kb). Three time points are shown for each clone and the estimated number of population doublings (PD) for each timepoint are indicated below the Southern blot. Each clone has the opportunity to form a distinct starting telomere length distribution which is why the first timepoint for some clones appear to have distinct telomere length distributions, for example the starting timepoint for the POP5 clones compared to the GFP clones. All transfection experiments began from the same population of HeLa-FRT cells. Three biological replicates/clones for each overexpression gene were tested and the trends shown here were consistent across all clones in all cases. B, D The Southern blot densitometry was analyzed using ImageQuant TL to generate line plots of the pixel density. The software estimated the median telomere length (orange bar) as the pixels with greatest density and estimated a molecular weight for that position taking into account the molecular weight standards on both sides of the gel. The ImageQuant TL line plots (Supplementary Fig. 7) were used to estimate the minimum (purple triangle) and maximum (red triangle) telomere lengths in the bulk telomere band. A simulated diagram in the bottom left of the plot representing the ImageQuant TL plots is provided as a guide for the source of these values. The y-axis is plotted on a log10 scale to better estimate how linear DNA moves through an agarose gel at a rate inversely proportional to its length. Source data for Fig. 6 are provided as a Source Data file.
Fig. 7
Fig. 7. CRISPR removal of KBTBD6 and POP5 regulatory regions reduced expression of each gene.
A Knock-out N = 9, control N = 17. One-sided t test p-value = 0.047 (*). Boxplot center is the mean and box bounds represent the 25th and 75th percentiles. Source data are provided as a Source Data file. B A Manhattan plot of the 99% SuSiE credible set colored by r2 with the lead SNP. Black diamonds: SNPs in credible set 1. Black boxes: SNPs in credible set 2. Source data are provided as a Source Data file. C ATAC-seq peak regions are represented as boxes. Points above the plot area represent SNPs 99% credible set (red = rs9525462). NK cell = natural killer cell. D Roadmap chromatin ChIP-seq for hg19 chr13:41768158-41769095 (yellow). Samples: E044, E039, and E047. E, F Boxplot center is the mean and box bounds represent the 25th and 75th percentiles. E Knock-out N = 20, control N = 11. One-sided t test p-value = 0.003037 (**). Source data are provided as a Source Data file. F Knock-out N = 18, control N = 9. One-sided t test p-value = 2.093 × 10⁻⁵ (***). Source data are provided as a Source Data file.

References

    1. Stanley SE, Armanios M. The short and long telomere syndromes: paired paradigms for molecular medicine. Curr. Opin. Genet. Dev. 2015;33:1–9. doi: 10.1016/j.gde.2015.06.004. - DOI - PMC - PubMed
    1. Alder JK, et al. Telomere phenotypes in females with heterozygous mutations in the dyskeratosis congenita 1 (DKC1) gene. Hum. Mutat. 2013;34:1481–1485. doi: 10.1002/humu.22397. - DOI - PMC - PubMed
    1. Stuart BD, et al. Exome sequencing links mutations in PARN and RTEL1 with familial pulmonary fibrosis and telomere shortening. Nat. Genet. 2015;47:512–517. doi: 10.1038/ng.3278. - DOI - PMC - PubMed
    1. Gable DL, et al. ZCCHC8, the nuclear exosome targeting component, is mutated in familial pulmonary fibrosis and is required for telomerase RNA maturation. Genes Dev. 2019;33:1381–1396. doi: 10.1101/gad.326785.119. - DOI - PMC - PubMed
    1. Weiner, D. J. et al. Polygenic architecture of rare coding variation across 394,783 exomes. Nature614, 492–499 (2023). - PMC - PubMed

Publication types

Grants and funding