. 2024 May 24;15(1):4430.
doi: 10.1038/s41467-024-48715-1.

H2AX promotes replication fork degradation and chemosensitivity in BRCA-deficient tumours

Affiliations

H2AX promotes replication fork degradation and chemosensitivity in BRCA-deficient tumours

Diego Dibitetto et al. Nat Commun. .

Abstract

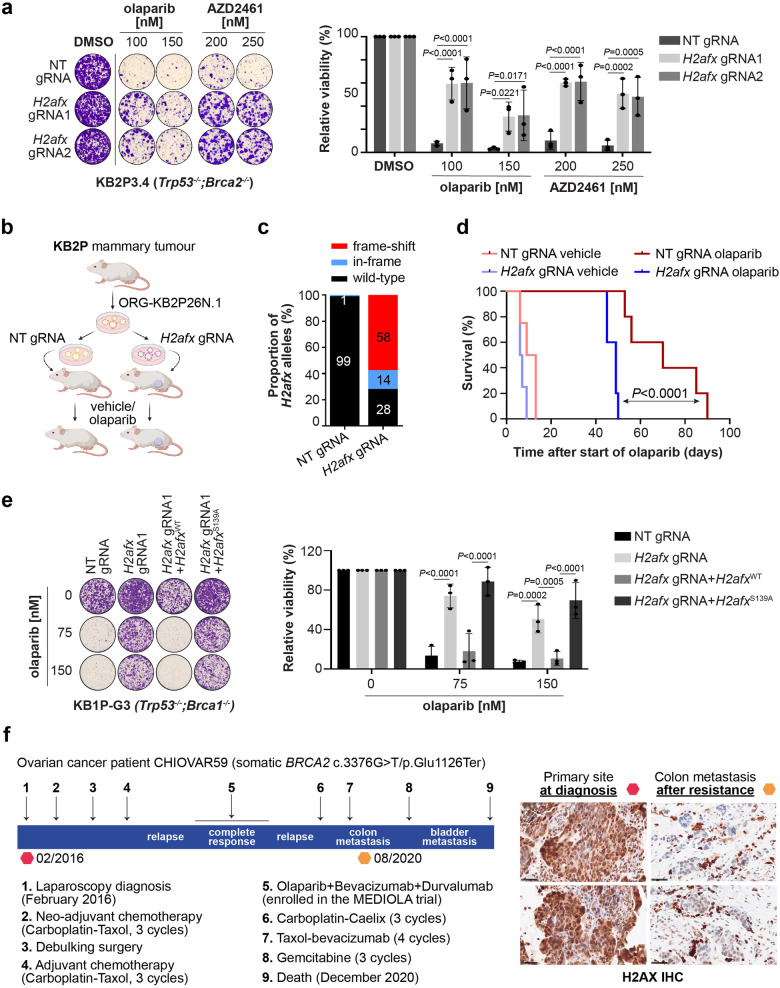
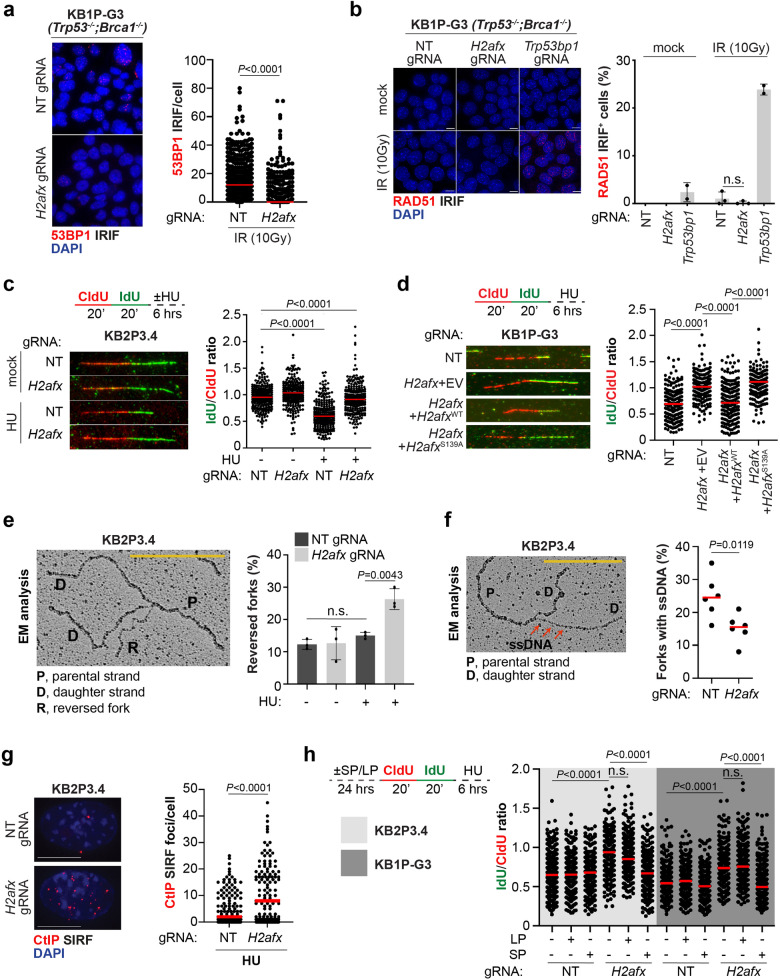
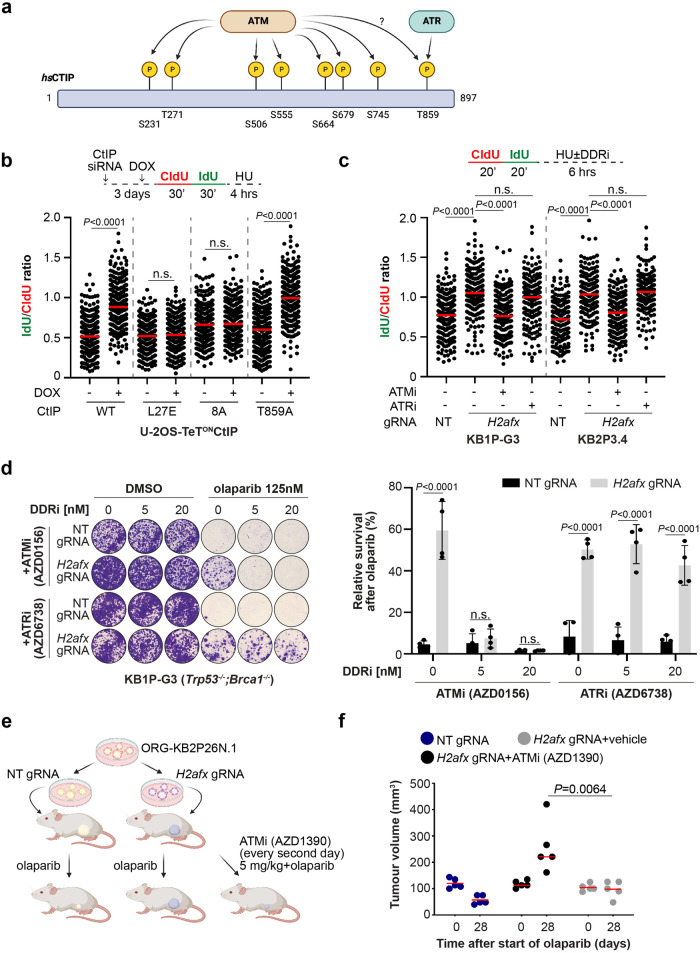
Histone H2AX plays a key role in DNA damage signalling in the surrounding regions of DNA double-strand breaks (DSBs). In response to DNA damage, H2AX becomes phosphorylated on serine residue 139 (known as γH2AX), resulting in the recruitment of the DNA repair effectors 53BP1 and BRCA1. Here, by studying resistance to poly(ADP-ribose) polymerase (PARP) inhibitors in BRCA1/2-deficient mammary tumours, we identify a function for γH2AX in orchestrating drug-induced replication fork degradation. Mechanistically, γH2AX-driven replication fork degradation is elicited by suppressing CtIP-mediated fork protection. As a result, H2AX loss restores replication fork stability and increases chemoresistance in BRCA1/2-deficient tumour cells without restoring homology-directed DNA repair, as highlighted by the lack of DNA damage-induced RAD51 foci. Furthermore, in the attempt to discover acquired genetic vulnerabilities, we find that ATM but not ATR inhibition overcomes PARP inhibitor (PARPi) resistance in H2AX-deficient tumours by interfering with CtIP-mediated fork protection. In summary, our results demonstrate a role for H2AX in replication fork biology in BRCA-deficient tumours and establish a function of H2AX separable from its classical role in DNA damage signalling and DSB repair.


Conflict of interest statement

S.T.D. and J.V.F. are or were full time employees and stockholders of AstraZeneca at the time of this study. The remaining authors declare no competing interests.

Figures

Fig. 1
Fig. 1. H2AX loss is frequently observed in BRCA-deficient mammary tumours with acquired PARPi resistance.
a Design of the genome-wide CRISPR-Cas9 genetic screen carried out in KB2P3.4 cells treated with the poly(ADP-ribose) polymerase (PARP) inhibitor AZD2461. b Venn diagram showing the overlap of potential gene candidates identified in each individual screen. c Violin plots showing the Z-Normalized Beta-Enrichment Score from 5 different genetic screens for chemoresistance carried out in different BRCA1/2-deficient cell lines. Data were all analyzed using the MAGeCK MLE algorithm to allow for cross comparison. d Design of an in vivo pipeline to query for genetic alterations and Homologous Recombination (HR) restoration in PARPi-resistant mammary tumours from KB1/2P mice. e Pie charts showing 45 and 34 PARPi-resistant mammary tumours from KB1P and KB2P mice, respectively. Tumours are grouped based on RAD51 IRIF+, Parg mutational status and H2afx gene expression (see Methods text).
Fig. 2
Fig. 2. H2AX depletion leads to PARPi resistance in vitro and in vivo.
a Clonogenic survival assay of KB2P3.4-derived cells treated, or mock treated, with the indicated concentrations of the PARPi olaparib and AZD2461 for 12 days. Plotted values express the mean ± SD of clonogenic survival (n = 3 independent experiments). P-values were calculated with two-way Anova test and adjusted for multiple comparisons. Source data are provided as a Source Data file. b Schematic design of the in vivo experiment. c Allelic modification rate of H2AX-deficient ORG-KB2P26N.1 organoids evaluated by TIDE analysis prior to transplantation. d Kaplan-Meier curves showing the survival of vehicle- or olaparib-treated mice bearing H2AX-proficient or deficient KB2P tumours. Each group contained 5 animals. P-value was calculated with the Mantel-Cox test. Source data are provided as a Source Data file. e Clonogenic survival assay of KB1P-G3-derived cells expressing the indicated H2AX variants and treated as in (a). Plotted values express the mean ± SD of clonogenic survival (n = 3 independent experiments). P-values were calculated with two-way Anova test and adjusted for multiple comparisons. Source data are provided as a Source Data file. f Therapy history of the CHIOVAR59 patient. On the right, H2AX IHC was performed on two tissue biopsies, primary tumour at diagnosis and colon metastasis after therapy resistance. Two areas of the slide are shown for each biopsy. Scale bar is 50 µm.
Fig. 3
Fig. 3. H2AX depletion restores replication fork protection.
a 53BP1 Ionizing Radiation-Induced Foci (IRIF) analysis in KB1P-G3 cells 4 h after 10 Gy exposure. Plotted values show the median of 53BP1 IRIF/cell from at least 600 cells (n = 2 independent experiments). P-values were calculated with one-way Anova test. Source data are provided as a Source Data file. b RAD51 IRIF analysis in KB1P-G3 cells treated as in (a). The presented data are the mean ± SD (n = 2 and n = 3 independent experiments for 53bp1-depleted and the other cell lines, respectively). Source data are provided as a Source Data file. c DNA fiber analysis in KB2P3.4 cells treated according to the depicted scheme. Hydroxyurea (HU) was used at 8 mM for 6 h. Plotted values show the median of individual IdU/CldU ratios from at least 200 fibers (n = 3 independent experiments). P-values were calculated with one-way Anova test and adjusted for multiple comparisons. Source data are provided as a Source Data file. d DNA fiber analysis in the indicated KB1P-G3 cells treated as in (c). Plotted values show the median of individual IdU/CldU ratios from at least 300 fibers (n = 3 independent experiments). P-values were calculated with two-way Anova test and adjusted for multiple comparisons. Source data are provided as a Source Data file. e Electron Microscopy (EM) analysis of reversed fork intermediates following HU treatment as in (c). The electron micrograph represents a reversed replication fork. P parental strand, D daughter strand, R regressed arm. The presented data are the mean ± SD (n = 3 independent experiments). P-values were calculated with the unpaired two-tailed Student’s t-test. Source data are provided as a Source Data file. f EM analysis showing the median number of forks with detectable ssDNA at the junction in cells treated as in (e). P-value was calculated with the unpaired two-tailed Student’s t-test. Source data are provided as a Source Data file. g CtIP SIRF in KB2P3.4-derived cells treated as in (c). Plotted values show the median of CtIP SIRF foci/cell from at least 140 cells (n = 3 independent experiments). P-values were calculated with one-way Anova test. Source data are provided as a Source Data file. h KB2P3.4 and KB1P-G3-derived cells were pretreated for 24 h with the indicated CtIP peptides prior to analog in vivo labeling according to the depicted scheme. HU was used at 8 mM and the CtIP peptides were used at 10 µM. Plotted values show the median of individual IdU/CldU ratios from at least 250 fibers (n = 2 independent experiments). P-values were calculated with one-way Anova test and adjusted for multiple comparisons. Source data are provided as a Source Data file.
Fig. 4
Fig. 4. ATM inhibition restores PARPi sensitivity in H2AX-deficient mammary tumours.
a Human CtIP protein map with highlighted the 8 ATM and ATR phosphorylation sites. b DNA fiber analysis in U-2OS-derived cells transfected with CtIP siRNA and treated according to the depicted scheme. 24 h before the experiment, CtIPWT, CtIPL27E, CtIP8A or CtIPT859A expression was induced by doxycycline treatment. Plotted values show the median of individual IdU/CldU ratios from at least 300 fibers (n = 2 independent experiments). P-values were calculated with one-way Anova test and adjusted for multiple comparisons. Source data are provided as a Source Data file. c DNA fiber analysis in KB1P-G3 and KB2P3.4-derived cells treated according to the depicted scheme. HU was used at 8 mM, AZD0156 and AZD6738 were used at 10 µM. Plotted values show the median of individual IdU/CldU ratios from at least 170 fibers (n = 3 independent experiments). P-values were calculated with one-way Anova test and adjusted for multiple comparisons. Source data are provided as a Source Data file. d Clonogenic survival assay of KB1P-G3-derived cells treated, or mock treated, with the indicated concentrations of olaparib, AZD0156, and AZD6738 for 12 days. Plotted values express the mean ± SD of clonogenic survival (n = 4 independent experiments). P-values were calculated with two-way Anova test and adjusted for multiple comparisons. Source data are provided as a Source Data file. e Schematic design of the in vivo experiment with the ATMi AZD1390. f Plotted values express the median size (mm3) of individual tumours from five animals transplanted with the indicated organoid lines and subjected to the indicated treatment for 28 consecutive days after tumour formation. P-values were calculated with two-way Anova test corrected with the Bartlett’s test. Source data are provided as a Source Data file.

References

    1. Lord CJ, Ashworth A. PARP inhibitors: synthetic lethality in the clinic. Science. 2017;1158:1152–1158. doi: 10.1126/science.aam7344. - DOI - PMC - PubMed
    1. Prakash R, Zhang Y, Feng W, Jasin M. Homologous recombination and human health: the roles of BRCA1, BRCA2, and associated proteins. Cold Spring Harb. Perspect. Biol. 2015;7:1–27. doi: 10.1101/cshperspect.a016600. - DOI - PMC - PubMed
    1. Farmer H, et al. Targeting the DNA repair defect in BRCA mutant cells as a therapeutic strategy. Nature. 2005;434:917–921. doi: 10.1038/nature03445. - DOI - PubMed
    1. Bryant HE, et al. Specific killing of BRCA2-deficient tumours with inhibitors of poly(ADP-ribose) polymerase. Nature. 2005;434:913–917. doi: 10.1038/nature03443. - DOI - PubMed
    1. Gogola E, Rottenberg S, Jonkers J. Resistance to PARP inhibitors: lessons from preclinical models of BRCA-associated cancer. Annu Rev. Cancer Biol. 2019;3:235–254. doi: 10.1146/annurev-cancerbio-030617-050232. - DOI

MeSH terms