. 2024 May 24;15(1):4427.
doi: 10.1038/s41467-024-48764-6.

Hybrid architectures for terahertz molecular polaritonics

Affiliations

Hybrid architectures for terahertz molecular polaritonics

Ahmed Jaber et al. Nat Commun. .

Abstract

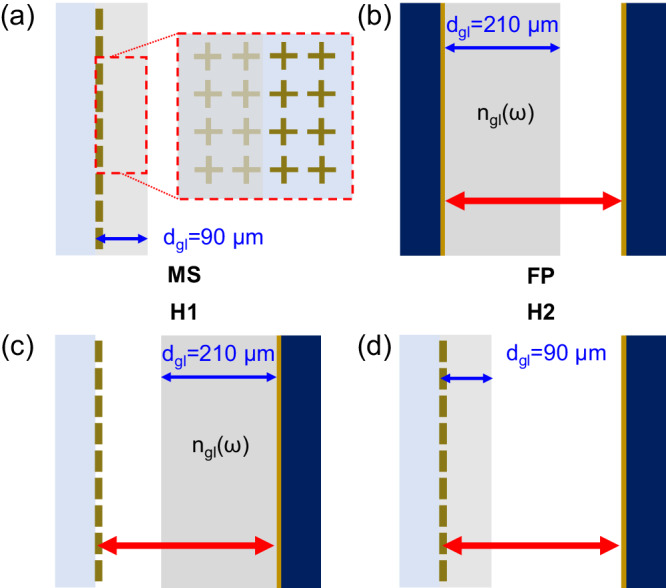
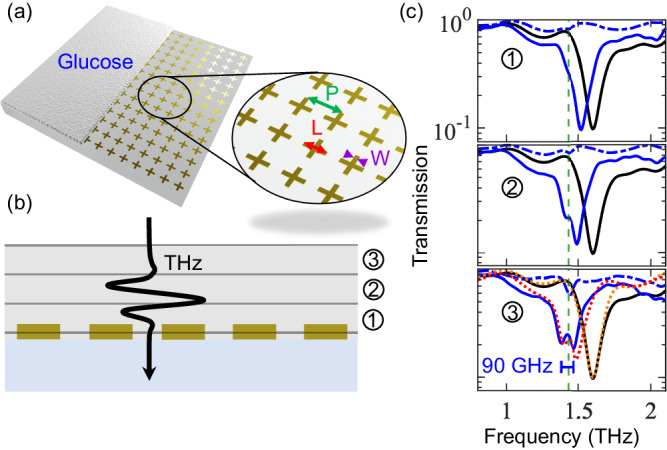
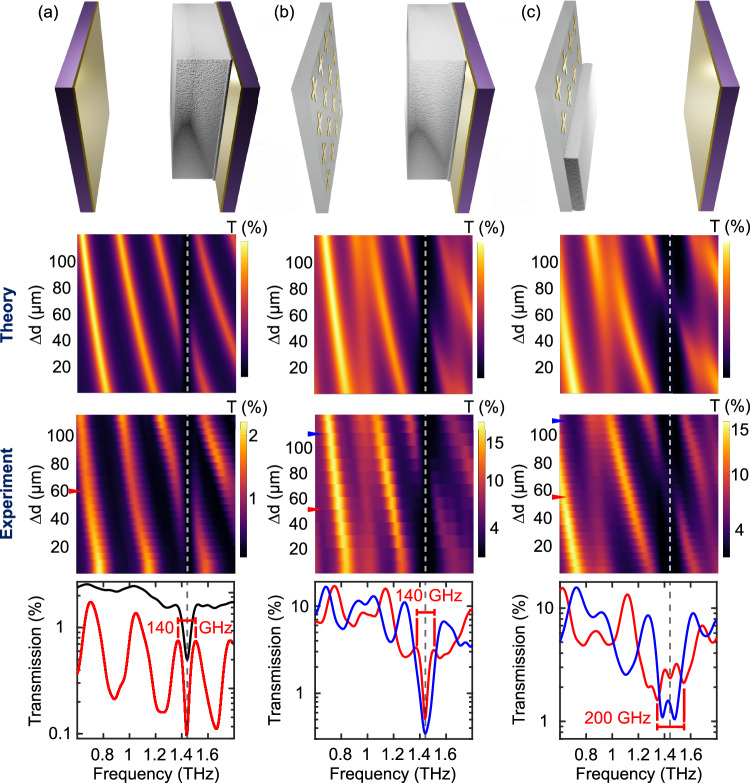
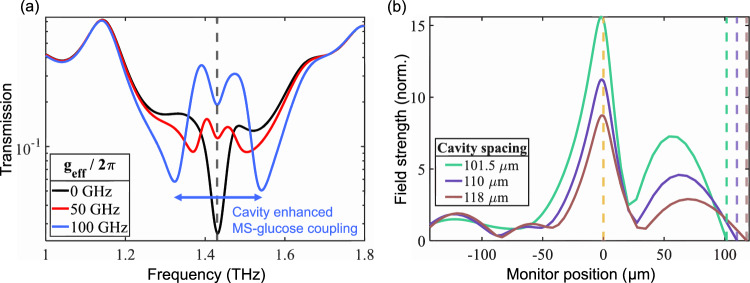
Atoms and their different arrangements into molecules are nature's building blocks. In a regime of strong coupling, matter hybridizes with light to modify physical and chemical properties, hence creating new building blocks that can be used for avant-garde technologies. However, this regime relies on the strong confinement of the optical field, which is technically challenging to achieve, especially at terahertz frequencies in the far-infrared region. Here we demonstrate several schemes of electromagnetic field confinement aimed at facilitating the collective coupling of a localized terahertz photonic mode to molecular vibrations. We observe an enhanced vacuum Rabi splitting of 200 GHz from a hybrid cavity architecture consisting of a plasmonic metasurface, coupled to glucose, and interfaced with a planar mirror. This enhanced light-matter interaction is found to emerge from the modified intracavity field of the cavity, leading to an enhanced zero-point electric field amplitude. Our study provides key insight into the design of polaritonic platforms with organic molecules to harvest the unique properties of hybrid light-matter states.


Conflict of interest statement

The authors declare no competing interests.

Figures

Fig. 1
Fig. 1. Hybrid architectures for light–matter coupling.
a Plasmonic metasurface (MS) as an array of cross-shaped metal elements coated with a (90 ± 10) μm-thick glucose layer. b Fabry–Perot (FP) cavity where one mirror is coated with a (210 ± 10) μm-thick glucose layer. c and d Hybrid cavity designs in which one mirror of the FP cavity is replaced by a MS, and where the glucose layer either covers the mirror (H1) or the MS (H2). The glucose thickness is labeled as dgl and the corresponding refractive index is labeled as ngl(ω).
Fig. 2
Fig. 2. THz-TDS setup and the THz absorption coefficient of glucose.
Schematic of the THz time-resolved spectroscopy setup. An ultrafast laser source is used to generate THz through optical rectification in a GaP crystal. The detection process uses a partially reflected pulse from the same optical source to perform standard electro-optic sampling (EOS) inside another GaP crystal. In brief, the THz electric field is revealed by resolving THz-induced birefringence in the near-infrared gating pulse, which is monitored as a function of time delay with the THz pulse with a quarter-wave plate (λ/4), Wollaston prism (WP) and a pair of balanced photodiodes (PD). (Inset) Absorption spectrum of a 300 μm-thick glucose (C6H12O6) pellet measured with time-resolved THz spectroscopy and featuring a prominent vibrational resonance at 1.43 THz.
Fig. 3
Fig. 3. Strong light–matter coupling with glucose-coated MS.
a Schematic of an MS designed from an array of cross-shaped aluminum elements (shown in dark yellow color for clarity) with a glucose coating covering half the structure. The inset is a zoom-in defining the structural dimensions: the periodicity (P), cross-arm length (L), and cross-arm width (W), which are optimized to provide a narrow plasmonic resonance. b A cross-sectional schematic of the MS with three thicknesses of glucose layers: (1) 30 μm, (2) 60 μm, and (3) 90 μm, deposited with successive spray coating passes. c THz-TDS measurements taken of these three structures (blue line) and the glucose layer on the bare substrate (without the MS) (blue dashed line). The transmission spectrum of the uncoated MS is provided for comparison (black line). The vertical green dashed line shows the vibrational resonance frequency of the targeted glucose mode. In (3), we overlap transfer matrix calculations over the coupled metasurface and bare metasurface experimental measurements (red and orange dotted lines, respectively).
Fig. 4
Fig. 4. Strong light–matter coupling with FP and hybrid cavity architectures.
Transmission spectra for a standard FP cavity, b H1 and c H2. Top to bottom row shows the schematics of the cavity architectures, the 2D transmission map calculated with the transfer matrix approach as a function of relative cavity spacing and frequency, the experimentally acquired transmission maps of the cavities, and cross sections through the transmission profile of the experimental results. In the plots at the bottom, the black curve in a shows the transmission of a glucose-coated gold mirror, while the red and blue curves show the transmission for different cavity lengths (on-resonance/off-resonance), as indicated by the arrows in the transmission map above. The H2 architecture leads to an enhanced polaritonic response, showing a substantially broader Rabi splitting when a cavity mode is overlapping with the polaritons of the coupled MS.
Fig. 5
Fig. 5. Transfer matrix and FDTD simulations of the hybrid cavity.
a Transfer matrix simulation of cavity transmission (on-resonance) for different glucose–MS coupling strengths geff and dgl = 100 μm. The arrows indicate the enhanced Rabi splitting of the MS–glucose interaction due to the cavity configuration. The vertical dashed line shows the location of the glucose resonance. When geff > 0, the glucose–MS polaritons are dominant, and the transmission result resembles experimental observations of the H2 configuration. Otherwise, when geff = 0, only the cavity–glucose interaction remains, and the transmission result resembles the H1 configuration. b A FDTD investigation of an empty hybrid cavity. The position of the mirror, relative to the array interface (0 μm, orange dashed line), determines the cavity spacing and, thus, the cavity resonance. Reducing the cavity spacing (from brown to purple to green) allows one to bring the cavity mode in resonance with the MS mode. The electric field magnitude within (>0 μm) and outside (<0 μm) of the cavity is monitored in one dimension and normalized to the incident field. The green curve shows the field profile obtained when the plasmonic and cavity modes are resonant with each other. The corresponding vertical dashed lines show the positions of the mirror. The enhancement of the field amplitude is consistent with the modified Rabi splitting showcased in (a).

References

    1. Orgiu E, et al. Conductivity in organic semiconductors hybridized with the vacuum field. Nat. Mater. 2015;14:1123. doi: 10.1038/nmat4392. - DOI - PubMed
    1. Hagenmüller D, Schachenmayer J, Schütz S, Genes C, Pupillo G. Cavity-enhanced transport of charge. Phys. Rev. Lett. 2017;119:223601. doi: 10.1103/PhysRevLett.119.223601. - DOI - PubMed
    1. Hutchison JA, Schwartz T, Genet C, Devaux E, Ebbesen TW. Modifying chemical landscapes by coupling to vacuum fields. Angew. Chem. Int. Ed. 2012;51:1592. doi: 10.1002/anie.201107033. - DOI - PubMed
    1. Munkhbat B, Wersäll M, Baranov DG, Antosiewicz TJ, Shegai T. Suppression of photo-oxidation of organic chromophores by strong coupling to plasmonic nanoantennas. Sci. Adv. 2018;4:eaas9552. doi: 10.1126/sciadv.aas9552. - DOI - PMC - PubMed
    1. Cang H, Liu Y, Wang Y, Yin X, Zhang X. Giant suppression of photobleaching for single molecule detection via the Purcell effect. Nano Lett. 2013;13:5949. doi: 10.1021/nl403047m. - DOI - PubMed