. 2024 May 24;15(1):4426.
doi: 10.1038/s41467-024-48847-4.

Phosphorus deficiency alleviates iron limitation in Synechocystis cyanobacteria through direct PhoB-mediated gene regulation

Affiliations

Phosphorus deficiency alleviates iron limitation in Synechocystis cyanobacteria through direct PhoB-mediated gene regulation

Guo-Wei Qiu et al. Nat Commun. .

Abstract

Iron and phosphorus are essential nutrients that exist at low concentrations in surface waters and may be co-limiting resources for phytoplankton growth. Here, we show that phosphorus deficiency increases the growth of iron-limited cyanobacteria (Synechocystis sp. PCC 6803) through a PhoB-mediated regulatory network. We find that PhoB, in addition to its well-recognized role in controlling phosphate homeostasis, also regulates key metabolic processes crucial for iron-limited cyanobacteria, including ROS detoxification and iron uptake. Transcript abundances of PhoB-targeted genes are enriched in samples from phosphorus-depleted seawater, and a conserved PhoB-binding site is widely present in the promoters of the target genes, suggesting that the PhoB-mediated regulation may be highly conserved. Our findings provide molecular insights into the responses of cyanobacteria to simultaneous iron/phosphorus nutrient limitation.


Conflict of interest statement

The authors declare no competing interests.

Figures

Fig. 1
Fig. 1. Phosphorus starvation enhances the growth of Fe-limited cyanobacteria.
a The growth curve of Synechocystis under different iron and phosphorus availabilities. Values are mean ± SD of three independent biological replicates. Asterisks indicate a significant difference between −Fe+P and −Fe−P using the two-sided Student’s t-test. *P < 0.05, **P < 0.01, with exact P-values provided as source data. bc Image of the culture and biomass of Synechocystis after 4 days of growth. The biomass shown in (c) was the pellets obtained from 100 mL of cells after centrifugation. The experiment was repeated with similar results three times. d Growth rates of Synechocystis grown under +Fe+P, −Fe+P, and −Fe−P conditions. Values are mean ± SD of three independent biological replicates. e Room temperature absorption spectra of Synechocystis grown under +Fe+P, −Fe+P, and −Fe−P conditions for 4 days. Data shown are from representative sample of three independent biological replicates. f Changes in Fv/Fm values of Synechocystis after 4 days of growth under +Fe+P, −Fe+P, and −Fe−P conditions. Values are mean ± SD of three independent biological replicates. g The violin plot showing the distribution of the cell diameter data points, while the embedded line and triangle in the boxplot mark the mean and median cell diameter, respectively. The upper and lower edges of the box indicate the first and third quartiles, and the whiskers extend to 1.5 × the interquartile range beyond the first and third quartiles. Data shown are measured from three independent biological replicates with the total number of at least 150 cells. Letters above bars indicate statistical significance (P < 0.05) calculated by one-way ANOVA across all treatments. For d and f line segments and corresponding P-values represent statistical significance calculated by two-sided Student’s t-test. Source data are provided as a Source Data file.
Fig. 2
Fig. 2. sodB responds positively to phosphorus starvation.
a The intracellular ROS accumulation of Synechocystis after 4 days of growth under different iron and phosphorus availabilities. Values are mean ± SD of three independent biological replicates, and the results were normalized to the ROS level of +Fe+P treatment. b Relative mRNA abundance of sodB in Synechocystis after 4 days of growth under +Fe+P, +Fe−P, −Fe+P, and −Fe−P conditions. Data shown are mean ± SD of three independent biological replicates, and the results were normalized to the transcript levels measured under +Fe+P conditions. c SOD activity of Synechocystis determined by in-gel activity staining. Samples were loaded on an equal total protein basis. Similar results were obtained from three independent biological replicates. d The SOD activity detected from (c) was quantified with ImageJ software. Data shown are mean ± SD of three independent biological replicates and values are given relative to SOD activities of +Fe+P samples. Letters above bars indicate statistical significance (P < 0.05) calculated by one-way ANOVA across all treatments. Line segments and corresponding P-values represent statistical significance calculated by two-sided Student’s t-test. Source data are provided as a Source Data file.
Fig. 3
Fig. 3. Distribution of sods amongst marine ecosystems.
a Whisker box plots showing gene abundance of different sod isoforms of cyanobacteria in metagenomes (orange, nmg = 139) and metatranscriptomes (dark cyan, nmt = 162) generated from TARA oceans global marine survey. Data are presented by Pi (<0.1 µM, nmg = 39, nmt = 40; 0.1 ~ 0.5 µM, nmg = 49, nmt = 60; 0.5 ~ 1.0 µM, nmg = 26, nmt = 34; >1.0 µM, nmg = 25, nmt = 28) concentrations. The abundance of each sod was calculated by dividing the sum of the abundances of their homologs by the sum of total gene abundance from all reads in the sample. The whiskers extend to 1.5 × the interquartile range beyond the first and third quartiles (boxes). Exclusive median (line), average (triangle), and atypical values (circles) are also indicated. Different letters above the bars represent statistical significance (P < 0.05) calculated by Kruskal-Wallis between treatments. b Plots of the relative sods abundance in metatranscriptomes vs. the relative level of pstS transcripts. The data were plotted on a logarithmic scale. The red lines indicate linear regressions of the data points, and the significance of each regression is shown in each panel. Source data are provided as a Source Data file.
Fig. 4
Fig. 4. Phosphorus starvation enhances the resistance of Fe-limited cyanobacteria to O2 stress.
a The photosynthetic electron transport rate of Synechocystis grown in the presence (+MV) and absence (−MV) of 0.3 µM methyl viologen measured by PAM fluorometry. Values are mean ± SD of three independent biological replicates. Asterisks indicate a significant difference between two treatments using the two-sided Student’s t-test. *P < 0.05; **P < 0.01. b Representative gating of low auto-fluorescence cells. The change of auto-fluorescence intensity of Synechocystis cells was analyzed by flow cytometry with an excitation wavelength of 488 nm and an emission wavelength of 700 ± 54 nm. Data shown are from representative sample of three independent biological replicates. Low-fl, low auto-fluorescence; FSC, forward scatter. Source data are provided as a Source Data file.
Fig. 5
Fig. 5. PhoB regulates the expression of sodB.
a Verification of the interaction between the cis-acting element pro-sodB and the transcription factor PhoB by Y1H assay. b Interaction analysis between pro-sodB and PhoB by EMSA. The concentration of PhoB added into each mixture is shown. Unlabeled DNA (SC) and poly (dI-dC) (NSC) were added to examine the specificity of the binding reactions. Similar results were obtained from three independent experiments. c The relative transcript levels of sodB in the WT strain and phoB mutant after 4 days of growth under different Fe and P availabilities. Values are mean ± SD of three independent biological replicates, and the results were normalized to the transcript levels measured under +Fe+P conditions. d Intracellular ROS content of WT and the phoB mutant after 4 days of growth under +Fe+P, +Fe−P, −Fe+P, and −Fe−P conditions. Data shown are mean ± SD of three independent biological replicates, and the results were normalized to the ROS level of +Fe+P treatment. e Representative images of each strain grown in the absence and presence of 0.3 µM MV. The experiment was repeated with similar results three times. For c and d letters above bars indicate statistical significance (P < 0.05) calculated by one-way ANOVA across all treatments. Source data are provided as a Source Data file.
Fig. 6
Fig. 6. PhoB regulates the expression of slr1908.
a Verification of the interaction between the cis-acting element pro-slr1908 and the transcription factor PhoB by Y1H assay. b Interaction analysis between pro-slr1908 and PhoB by EMSA. The concentration of PhoB added into each mixture is shown. Unlabeled DNA (SC) and poly (dI-dC) (NSC) were added to examine the specificity of the binding reactions. Similar results were obtained from three independent experiments. c qRT-PCR analysis of slr1908 in WT strains and phoB mutants after 4 days of growth under different Fe and P availabilities. Values are mean ± SD of three independent biological replicates, and the results were normalized to the transcript levels measured under +Fe+P conditions. d Growth rates of the WT and slr1908KD strains grown under −Fe+P and −Fe−P conditions. Values are mean ± SD of three independent biological replicates. Line segments and corresponding P-values represent statistical significance calculated by two-sided Student’s t-test. For c and d letters above bars indicate statistical significance (P < 0.05) calculated by one-way ANOVA across all treatments. Source data are provided as a Source Data file.
Fig. 7
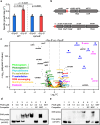
Fig. 7. PhoB regulates chemotaxis and exotoxin related genes.
a Growth rates of the WT and phoB mutants grown under −Fe+P and −Fe−P conditions. Values are mean ± SD of three independent biological replicates. Letters above bars indicate statistical significance (P < 0.05) calculated by one-way ANOVA across all treatments. Line segments and corresponding P-values represent statistical significance calculated by two-sided Student’s t-test. b The schematic representation of the organization of sll1552 and sll1291 gene clusters. The location of the putative PhoB binding sites were labeled by red. c Global expression analysis of genes in response to −Fe−P relative to −Fe+P. Differential expression testing was carried out using DEseq2 package, and two-tailed P-values were adjusted for multiple testing using the BH method. Broken lines indicate the adjusted P-value threshold of 0.05 and FC thresholds of 1 and −1. Functional groups are color coded and genes without significant differences in expression are shown in light gray. Detailed numeric values are presented in Supplementary Data 2. d and e Interaction analysis between pro-sll1552, pro-sll1291 and PhoB by EMSA. The concentration of PhoB added into each mixture is shown. Unlabeled DNA (SC) and poly (dI-dC) (NSC) were added to examine the specificity of the binding reactions. Similar results were obtained from three independent experiments. Source data are provided as a Source Data file.
Fig. 8
Fig. 8. A model of PhoB-mediated Fe/P co-limitation acclimation network.
The cellular components potentially regulated by PhoB are shown in color. Transport pathways and reactions up-regulated under Fe/P co-limitation conditions are shown in bold arrows. The figure was created with BioRender.com, and released under a Creative Commons Attribution-NonCommercial-NoDerivs 4.0 International license.

Similar articles

Cited by

References

    1. Moore CM, et al. Processes and patterns of oceanic nutrient limitation. Nat. Geosci. 2013;6:701–710. doi: 10.1038/ngeo1765. - DOI
    1. Browning TJ, et al. Nutrient co-limitation at the boundary of an oceanic gyre. Nature. 2017;551:242–246. doi: 10.1038/nature24063. - DOI - PubMed
    1. Duhamel S, et al. Phosphorus as an integral component of global marine biogeochemistry. Nat. Geosci. 2021;14:359–368. doi: 10.1038/s41561-021-00755-8. - DOI
    1. Nussaume L, Desnos T. ‘Je t’aime moi non plus’: a love-hate relationship between iron and phosphate. Mol. Plant. 2022;15:1–2. doi: 10.1016/j.molp.2021.11.011. - DOI - PubMed
    1. Shaked Y, et al. Co-acquisition of mineral-bound iron and phosphorus by natural Trichodesmium colonies. Limnol. Oceanogr. 2023;5:1064–1077. doi: 10.1002/lno.12329. - DOI

MeSH terms