. 2024 May 24;8(1):118.
doi: 10.1038/s41698-024-00612-y.

Pharmacological inhibition of the LIF/LIFR autocrine loop reveals vulnerability of ovarian cancer cells to ferroptosis

Affiliations

Pharmacological inhibition of the LIF/LIFR autocrine loop reveals vulnerability of ovarian cancer cells to ferroptosis

Behnam Ebrahimi et al. NPJ Precis Oncol. .

Abstract

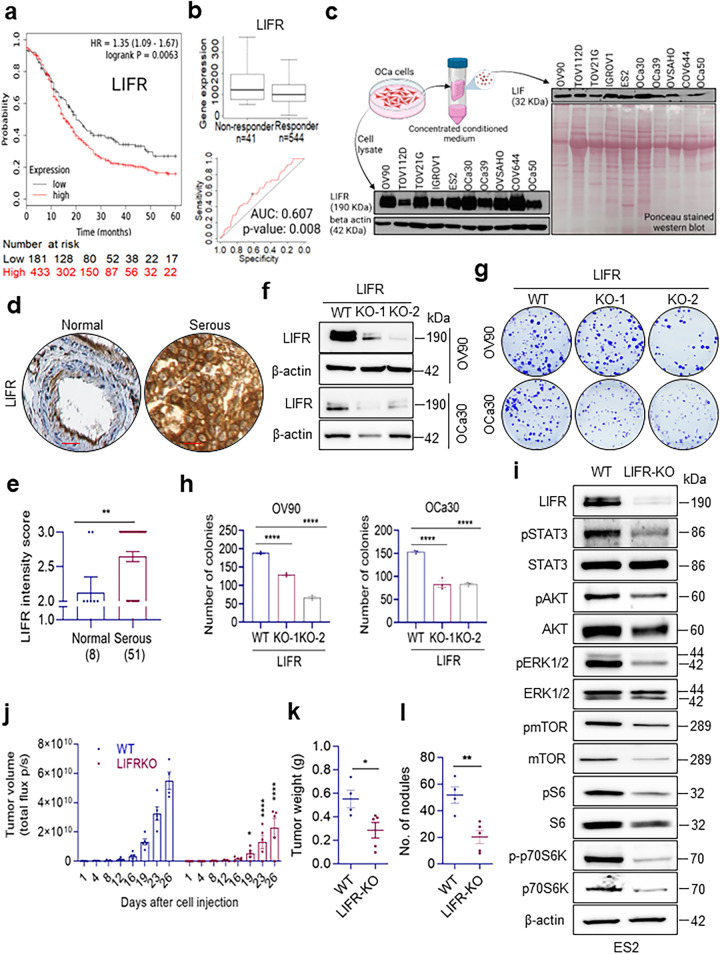
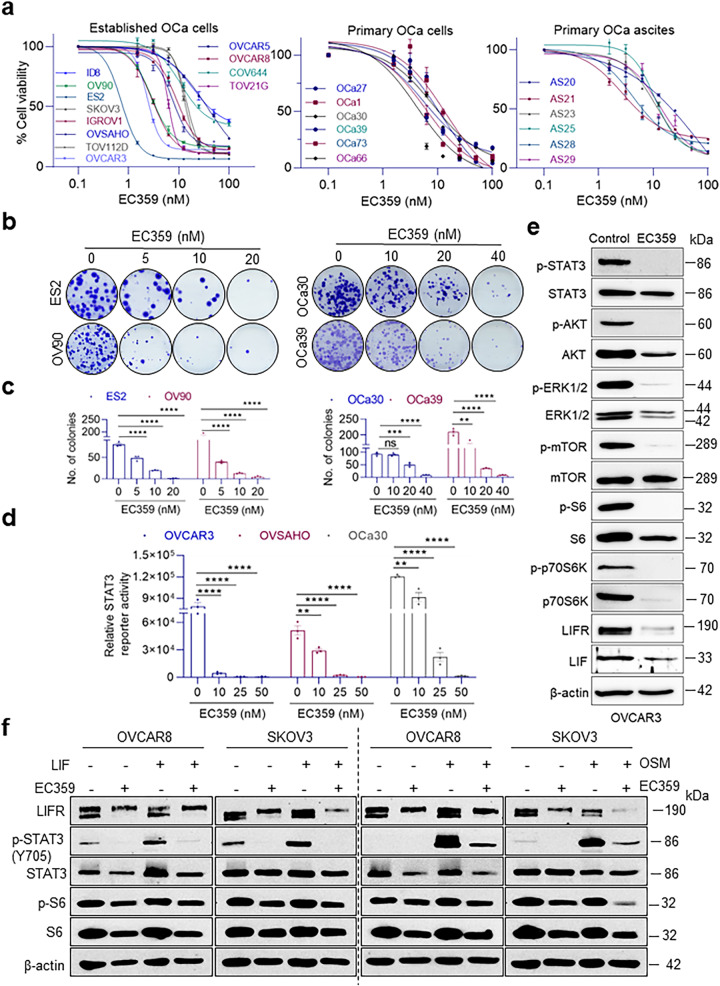
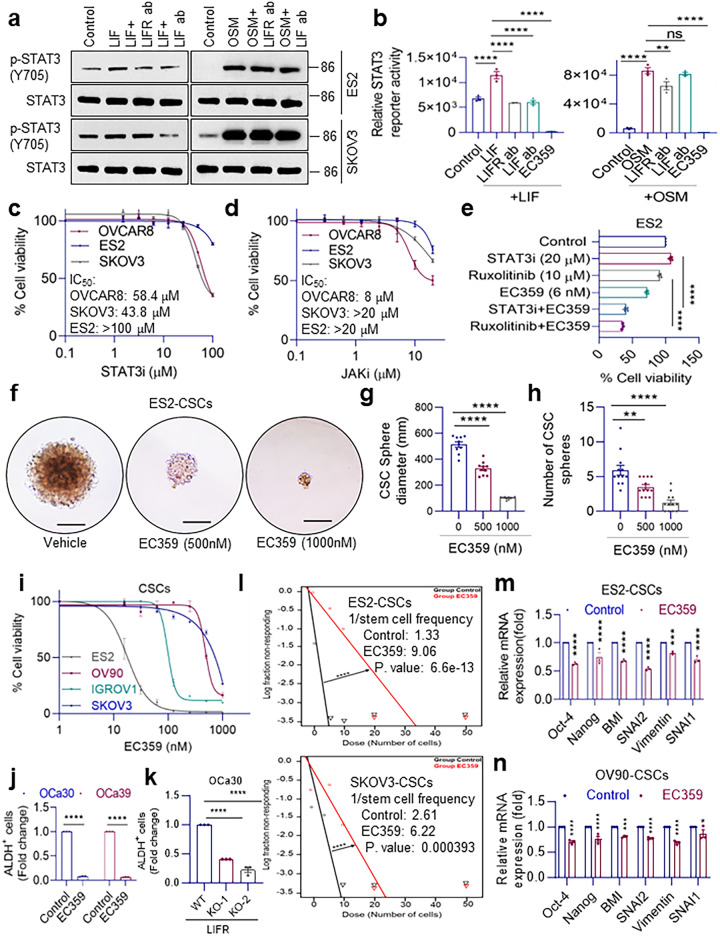
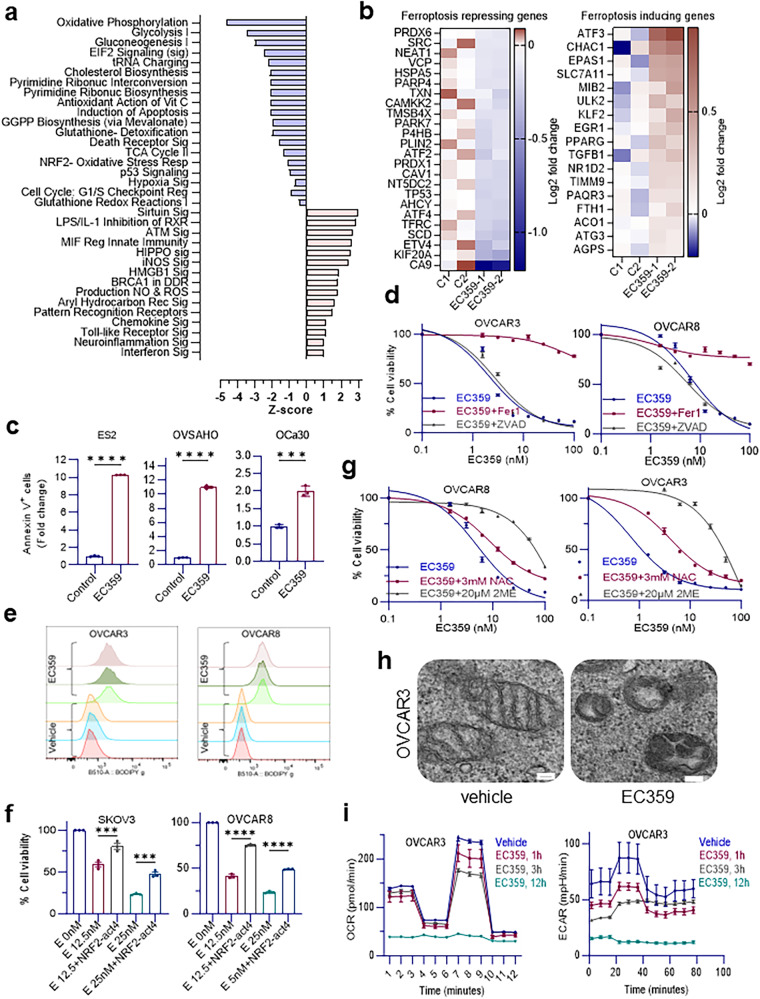
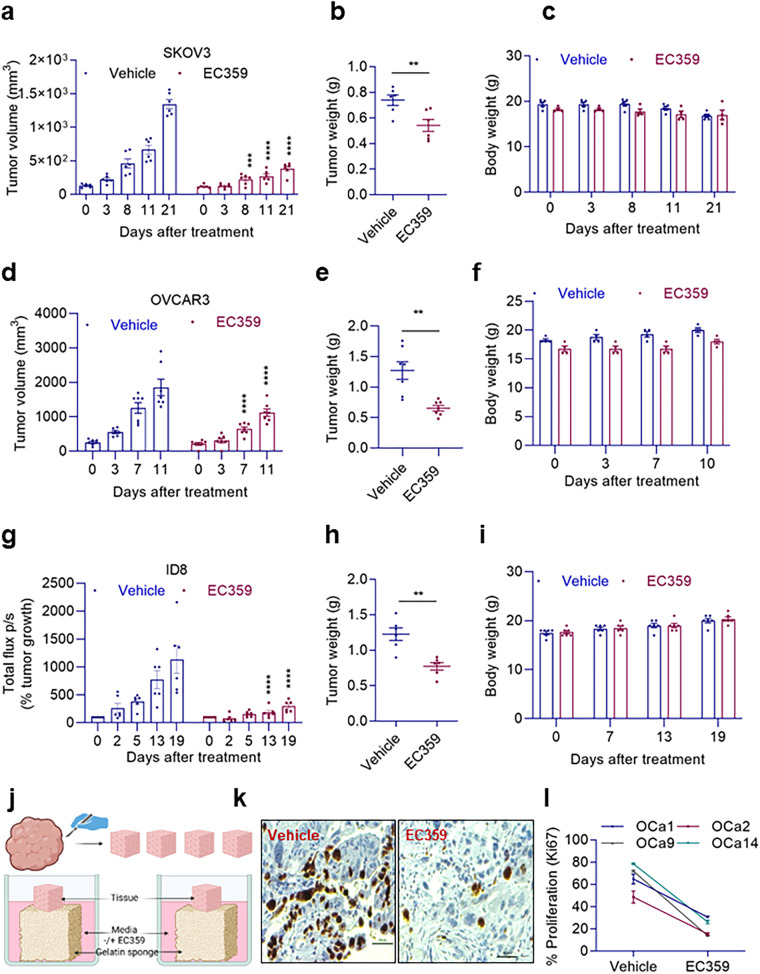
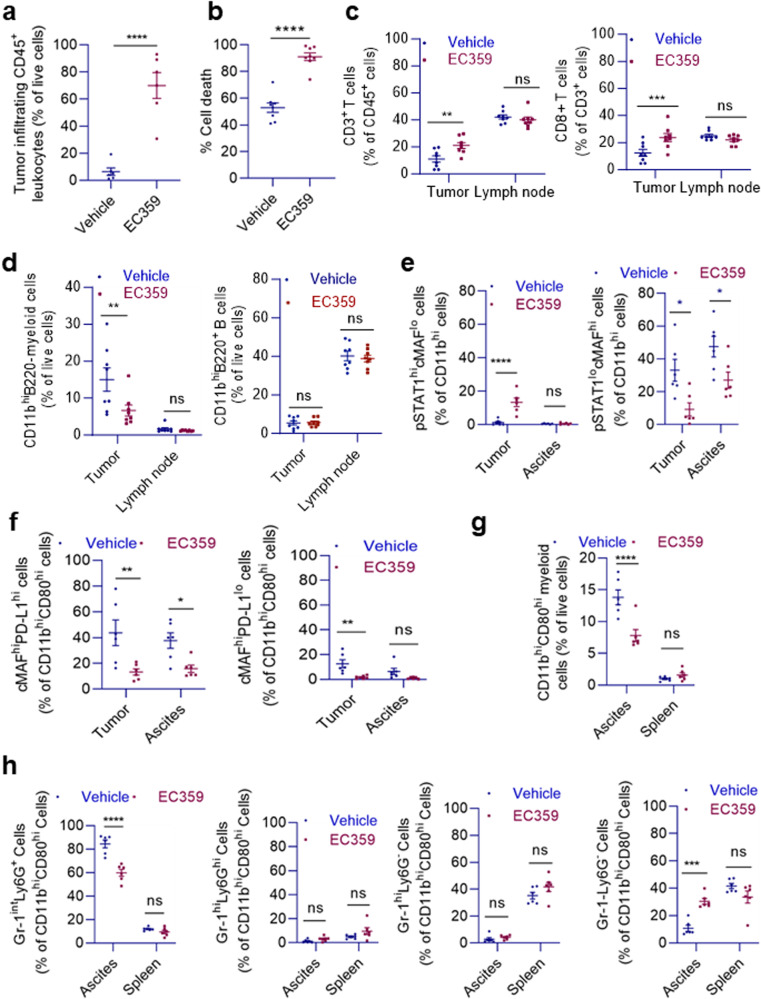
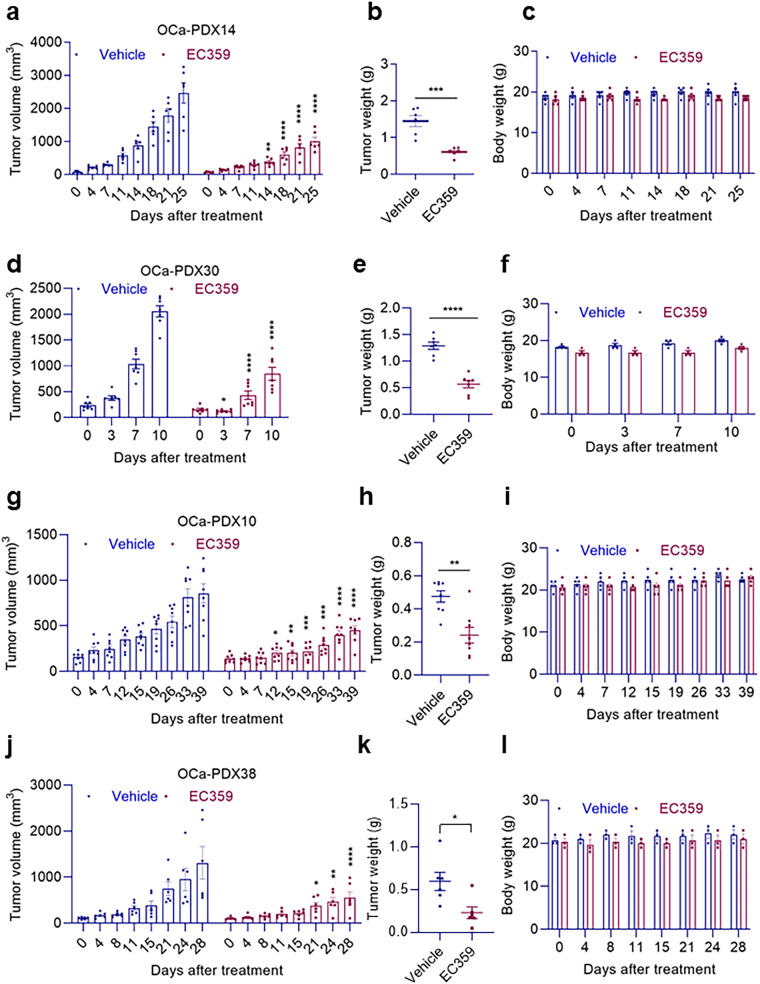
Of all gynecologic cancers, epithelial-ovarian cancer (OCa) stands out with the highest mortality rates. Despite all efforts, 90% of individuals who receive standard surgical and cytotoxic therapy experience disease recurrence. The precise mechanism by which leukemia inhibitory factor (LIF) and its receptor (LIFR) contribute to the progression of OCa remains unknown. Analysis of cancer databases revealed that elevated expression of LIF or LIFR was associated with poor progression-free survival of OCa patients and a predictor of poor response to chemotherapy. Using multiple primary and established OCa cell lines or tissues that represent five subtypes of epithelial-OCa, we demonstrated that LIF/LIFR autocrine signaling is active in OCa. Moreover, treatment with LIFR inhibitor, EC359 significantly reduced OCa cell viability and cell survival with an IC50 ranging from 5-50 nM. Furthermore, EC359 diminished the stemness of OCa cells. Mechanistic studies using RNA-seq and rescue experiments unveiled that EC359 primarily induced ferroptosis by suppressing the glutathione antioxidant defense system. Using multiple in vitro, ex vivo and in vivo models including cell-based xenografts, patient-derived explants, organoids, and xenograft tumors, we demonstrated that EC359 dramatically reduced the growth and progression of OCa. Additionally, EC359 therapy considerably improved tumor immunogenicity by robust CD45+ leukocyte tumor infiltration and polarizing tumor-associated macrophages (TAMs) toward M1 phenotype while showing no impact on normal T-, B-, and other immune cells. Collectively, our findings indicate that the LIF/LIFR autocrine loop plays an essential role in OCa progression and that EC359 could be a promising therapeutic agent for OCa.


Conflict of interest statement

B.S., S.K., and H.B.N., are employees of Evestra Inc. The remaining authors declare no potential conflicts of interest.

Figures

Fig. 1
Fig. 1. OCa upregulates an autocrine loop of LIF/LIFR.
a Kaplan-Meier survival analysis of OCa stratified by LIFR gene expression levels. b Box plots and ROC curves of LIFR were generated using progression free survival (PFS) at 6-month cohort. Only samples with serous histology (grade 3) and those treated with platinum and taxane combined therapy were included in the analysis. c Western blot analysis of concentrated conditioned media of OCa cells cultured in serum free RPMI-1640 demonstrating the presence of LIF and total cellular lysates of OCa cells cultured in RPMI-1640 supplemented with 10% FBS showing LIFR expression. Ponceau stained nitrocellulose membrane is shown as loading control for the conditioned media. d Representative IHC images of LIFR expression in normal and serous OCa on OCa tissue array (OVC2281, TissueArray.Com LLC) showing higher expression of LIFR in OCa compared to normal tissues of the ovary. Scale bar represents 100 µm. e Quantitation of LIFR expression in normal (n = 8) and serous OCa (n = 51) from OCa tissue array. Data presented as mean ± S.E.M., significance was determined by Two-tailed Unpaired t test. f Representation of expression of LIFR in OV90, and OCa30-WT cells, stably expressing LIFR targeting sgRNA-1 and 2. g The effect of LIFR-KO on the long-term colony formation in OV90 and OCa30 cell lines. h Bar chart represents quantification of the colonies. Data presented as mean ± S.E.M., n = 3 biologically independent samples. Significance was determined by one-way ANOVA followed by Uncorrected Fisher’s LSD. i Western blot analysis of the LIFR-KO and WT ES2 cells presenting inhibitory effect of LIFR-KO on LIFR downstream pathways including STAT3, AKT, ERK, and mTOR. Uncropped blots are provided. j ES2-WT and LIFR-KO cells (1 × 105) labeled with luciferase were injected into the peritoneal cavity of female SCID mice. Tumor progression was monitored using Xenogen imaging system. k and l display the tumor weight and number of nodules respectively. Data presented as mean ± S.E.M., For tumor volume data, significance was determined by two-way ANOVA followed by Uncorrected Fisher’s LSD. For tumor weight and number of nodules data, n = 4 mice for WT and 5 mice for LIFR-KO; significance was determined by Two-tailed Unpaired t test. Experiments shown in (c, f, i, j, k, l) were done once. Numerical source data for (e, h, j, k, l) are provided. *p < 0.05, **p < 0.01, ****p < 0.0001.
Fig. 2
Fig. 2. EC359 inhibits proliferation of OCa cells and LIFR downstream signaling.
a Effect of EC359 treatment for four days on cell viability of different established and primary OCa cell lines isolated from solid tumor tissues or ascites of patients. Data presented as mean ± S.E.M., n = 3 biologically independent samples. b Images of the effect of different doses of EC359 on long-term clonogenic potential of OCa cells when 500 cells (ES2 and OV90) or 200 cells (OCa30 and OCa39) were treated with vehicle or EC359 for 4 days and then cultured for 10 days without the inhibitor. c represents quantification of colonies of ES2, OV90, OCa30, and OCa39 cells treated with vehicle or EC359. Data presented as mean ± S.E.M., n = 3 biologically independent samples. d STAT3 reporter assay displaying inhibitory effect of EC359 on the activity of STAT3 reporter in OVCAR3, OVSAHO, and OCa30 cell lines. Data presented as mean ± S.E.M., n = 3 biologically independent samples. For Fig, (c, d), significance was determined by two-way ANOVA followed by Uncorrected Fisher’s LSD. e Inhibitory effect of EC359 (60 nM) for 6 h on activation of LIFR-downstream signaling including STAT3, AKT, ERK, and mTOR on OVCAR3 cells determined by western blotting. f OVCAR8 and SKOV3 cells were serum starved for 24 h, pretreated with ± EC359 100 nM for 1 h and then treated with LIF (100 ng/ml) or OSM (10 ng/ml) for 10 h. LIFR downstream signaling was analyzed by western blotting. Western blots in each panel are derived from the same experiment and processed in parallel. Western blot experiments were repeated twice independently, with similar results. Numerical source data for (a, c, d) are provided. ns, not significant; **p < 0.01, ***p < 0.001, ****p < 0.0001.
Fig. 3
Fig. 3. EC359 is more effective in blocking LIFR signaling compared to anti LIF antibody and STAT3/JAK inhibitors and suppresses stemness properties of OCa cells.
a Changes in the phospho-STAT3 levels in ES2 and SKOV3 cells when treated with recombinant human LIF (100 ng/ml) or recombinant human Oncostatin M (OSM) (10 ng/ml) in the presence or absence of anti-LIFR (10 µg/ml) or anti-LIF (100 ng/ml) antibodies for 10 h. Western blots in each panel are derived from the same experiment and processed in parallel. b Reporter assay of SKOV3 cells stably expressing STAT3-Luciferase treated with human recombinant LIF (100 ng/ml), or recombinant human OSM (10 ng/ml) in the presence or absence of anti-LIFR (10 µg/ml) or anti-LIF (100 ng/ml) antibodies or EC359 (100 nM) for 20 h. c Cell viability analysis of OVCAR8, ES2, and SKOV3 cells treated with a serial dilution of STAT3 inhibitor NSC-74859 using MTT assay. IC50 values for each cell line are noted on the graph. d MTT assay measuring the effect of JAK inhibitor Ruxolitinib on cell viability of OVCAR8, ES2, and SKOV3 cells. IC50 values for each cell line for Ruxolitinib are stated on the graph. e Comparison of the effects of STAT3i NSC-74859 and JAKi Ruxolitinib alone or in combination with EC359 on cell viability of ES2 cells using MTT assay. f Representative sphere images of ES2 CSCs treated with vehicle or EC359 for two weeks performed by sphere formation assay. Scale bar represents 200 µm. g Bar graphs presenting quantification of spheres dimension, and (h) number of spheres formed. i SKOV3, OV90, ES2, and IGROV1 CSCs (ALDH+) were treated with EC359, and the cell viability was quantitated using CellTiter-Glo® assay. j Primary OCa cells (OCa30 and OCa39) were treated with EC359 (500 nM) for 24 h and the percentages of ALDH+ cells were determined using flow cytometry. k WT and LIFR-KO OCa30 cells were stained for ALDH+ cells and the percentages of ALDH+ cells were determined using flow cytometry. l Graphs displaying extreme limiting dilution assays. Stem cell frequency estimates (with confidence intervals) of ES2-CSCs and SKOV3-CSCs treated with vehicle or EC359 (1 µM) for 2 weeks generated through ELDA. Relative expression of stemness and EMT-related genes in ES2-CSCs (m) and OV90 CSCs (n) treated with EC359 (1 µM) for 24 h compared to the control groups. Data presented as mean ± S.E.M., n = 3 biologically independent samples. Significance was determined by two-way ANOVA followed by Uncorrected Fisher’s LSD. Numerical source data for (be, gn) and uncropped Western blot images for (a) are provided. ns not significant; *p < 0.05, **p < 0.01, ***p < 0.001, ****p < 0.0001.
Fig. 4
Fig. 4. EC359 induces cell death through ferroptosis.
a IPA of ES2 cells treated with EC359 (10 nM) for 12 h connotates downregulation of oxidative phosphorylation, glutathione-mediated detoxification, and NRF2-mediated oxidative stress response. b Heatmap visualization of data from RNA-Seq of ES2 cells treated with EC359 representing upregulation of ferroptosis inducing genes and downregulation of ferroptosis-repressing genes. n = 2 biologically independent samples. c Annexin V flow cytometry analysis of ES2, OVSAHO, and OCa30 cells treated with 100 nM of EC359 for 24 h shows induction of cell death by disruption of cell membrane integrity compared to the control groups. Data presented as mean ± S.E.M., n = 3 biologically independent samples. Significance was determined by Two-tailed Unpaired t test. d Cell viability assay of OVCAR3 and OVCAR8 cells treated with EC359 alone or in combination with ferroptosis and apoptosis inhibitors, Ferrostatin-1 (2 µM) and Z-VAD-FMK (10 µM) respectively for four days using MTT reagent. Data presented as mean ± S.E.M., n = 3 biologically independent samples. e Flow cytometric detection of lipid peroxidation using BODIPY™ 581/591 C11 probe in OVCAR3 and OVCAR8 cells treated with vehicle or EC359 (20 nM) for 12 h showing an increase in the green fluorescent (∼510 nm) intensity in EC359 treated cells. n = 3 biologically independent samples. f Cell viability measurement of SKOV3 and OCVAR3 cell lines treated with Vehicle (E 0 nM), or EC359 (E 12.5 nM, E 25 nM) in combination with NRF2-activator-4 (2 µM). g Cell viability assay of OVCAR3 and OVCAR8 cells subjected to EC359 treatment alone or in combination with NAC (3 mM) or 2 ME (20 µM) over a 4-day period using MTT reagent. Data presented as mean ± S.E.M., n = 3 biologically independent samples. Significance was determined by two-way ANOVA followed by Uncorrected Fisher’s LSD. h Transmission Electron Microscopy images of OVCAR3 cells treated with vehicle or 100 nM EC359 for 9 h. Scale bar = 100 nm. i Oxygen consumption rate (OCR) and extracellular acidification rate (ECAR) of OVCAR3 cells treated with vehicle or 100 nM of EC359 for 1, 3, or 12 h. Data presented as mean ± S.E.M., n = 3 biologically independent samples. Numerical source data for Fig. (ag, i) and uncropped images for (h) are provided. ns not significant; ***p < 0.001, ****p < 0.0001.
Fig. 5
Fig. 5. EC359 reduces tumor progression in cell-derived xenograft mouse models.
Bar graphs presenting tumor volume of SKOV3 (a) and OVCAR3 (d) xenografts that were treated with vehicle or EC359 (5 mg/kg/day/s.c./5 days/week and 10 mg/kg/day/i.p./3 days/week respectively). Tumor weights of SKOV3 and OVCAR3 xenografts presented in (b and e) and changes in body weight for SKOV3 and OVCAR3 bearing SCID mice were shown in (c and f), respectively. Data presented as mean ± SEM, n = 6 tumors per group for (a), and n = 7 tumors per group for (d). Significance was determined by two-way ANOVA followed by Uncorrected Fisher’s LSD. Murine luciferase labeled ID8 OCa xenografts injected i.p., in syngeneic mice was treated with vehicle or EC359 (10 mg/kg/day/i.p). Tumor progression was monitored using Xenogen imaging system (g). h and i show tumor weight and body weight measurements of vehicle and EC359 treated mice. Data presented as mean ± SEM, n = 6 mice per group. Significance was determined by two-way ANOVA followed by Uncorrected Fisher’s LSD. j Schematic representation of ex vivo explant assay created with BioRender.com. k IHC image of tumor tissues treated with vehicle or EC359 and subjected to Ki67 immunostaining. l A quantification of the changes in the percentage of Ki67 positive cells in primary ovarian tumor tissue explants treated with vehicle or EC359 for 72 h. Data presented as mean ± SEM, n = 3 tumors per group. Numerical source data for (ai), and (l) are provided. **p < 0.01, ***p < 0.001, ****p < 0.0001.
Fig. 6
Fig. 6. EC359 treatment induces lymphocyte alterations in the tumor microenvironment in a syngeneic OCa mouse model.
a Flow cytometry analysis of (CD45+) leukocyte infiltration into ID8 tumors in vehicle-treated C57BL/6 mice or residual tumors in EC359-treated mice without prior leukocyte enrichment. b Flow cytometry analysis of the proportion of dead (FVD+) cells among GFP+ cells in OCa tumors, as derived from ID8 cells stably expressing GFP through lentiviral transduction, in mice treated with vehicle or EC359. c Flow cytometry analysis of the proportion of CD3+ T cells within (CD45+) leukocytes that infiltrated into (residual) ID8 tumor-infiltrating leukocytes (after pre-enrichment with Ficoll-Paque) or were present in draining mesenteric lymph node, as indicated, as well as the proportion of CD8+ T cells within CD3+ cells (right panels) in mice treated with vehicle or EC359. d Flow cytometry analysis of the proportion of CD11bhiB220 myeloid cells and CD11bB220+ B cells in (CD45+) leukocytes in ID8 tumors or lymph node, as in (c). e Flow cytometry analysis of the proportion of CD11b+ cells that expressed phosphorylated STAT1 (pSTAT1), a hallmark transcription factor of pro-inflammatory M1 macrophages, or cMAF, a hallmark transcription factor of anti-inflammatory M2 macrophages, in (residual) ID8 tumors (after pre-enrichment with Ficoll-Paque) or ascites in mice treated with vehicle or EC359. f Flow cytometry analysis of the expression of cMAF and the PD-L1 immune checkpoint in CD11b+CD80hi myeloid cells in ID8 tumors or ascites, as in (e). g, h Flow cytometry analysis of the proportion of CD11b+CD80hi myeloid cells in ascites and the spleen as well as the proportion of the four subsets based on the expression of Gr1 and Ly6G, as indicated, and their respective PD-L1 expression levels (bottom left) in ID8 cell-engrafted mice treated with vehicle or EC359. The Gr-1intLy6G+ subset displayed the highest proportion and PD-L1 expression in ascites. Data presented as mean ± SEM, n = 6 mice per group. Significance was determined by Unpaired t test for (a, b) and two-way ANOVA followed by Šídák’s multiple comparisons test for (cg ns not significant; Numerical source data for (ag) are provided. *p < 0.05, **p < 0.01, ***p < 0.001, ****p < 0.0001.
Fig. 7
Fig. 7. EC359 hinders tumor growth in patient-derived xenograft models.
a, d, g, and j show tumor volume measurements in four different experiments of mice bearing four different PDX tumors (OCa-PDX14, OCa-PDX30, OCa-PDX10, and OCa-PDX38) treated with vehicle or EC359 (OCa-PDX14: 7.5 mg/kg/s.c./once/week; OCa-PDX30: 10 mg/kg/oral/3 days/week; OCa-PDX10: 2.5 mg/kg/i.p./every day; OCa-PDX38: 5 mg/kg/i.p./3 days/week). b, e, h, and k display changes in tumor weight at the end of the in vivo studies. Changes in the body weight of the four different in vivo PDX experiments are presented in (c, f, i and l). Data presented as mean ± SEM, n = 6 tumors per group for (a), n = 7 tumors per group for (d), n = 8 tumors per group for (g) and n = 6 tumors per group for (j). Significance was determined by two-way ANOVA followed by Uncorrected Fisher’s LSD. Numerical source data for (al) are provided. *p < 0.05, **p < 0.01, ***p < 0.001, ****p < 0.0001.

References

    1. Bowtell DD, et al. Rethinking ovarian cancer II: reducing mortality from high-grade serous ovarian cancer. Nat. Rev. Cancer. 2015;15:668–679. doi: 10.1038/nrc4019. - DOI - PMC - PubMed
    1. Lheureux S, Braunstein M, Oza AM. Epithelial ovarian cancer: Evolution of management in the era of precision medicine. CA Cancer J. Clin. 2019;69:280–304. doi: 10.3322/caac.21559. - DOI - PubMed
    1. Torre LA, et al. Ovarian cancer statistics, 2018. CA Cancer J. Clin. 2018;68:284–296. doi: 10.3322/caac.21456. - DOI - PMC - PubMed
    1. Prat J. Ovarian carcinomas: five distinct diseases with different origins, genetic alterations, and clinicopathological features. Virchows Arch. 2012;460:237–249. doi: 10.1007/s00428-012-1203-5. - DOI - PubMed
    1. Bast RC, Jr., et al. Critical questions in ovarian cancer research and treatment: report of an American Association for Cancer Research Special Conference. Cancer. 2019;125:1963–1972. doi: 10.1002/cncr.32004. - DOI - PMC - PubMed

LinkOut - more resources