. 2024 Jul;21(7):707-722.
doi: 10.1038/s41423-024-01165-7. Epub 2024 May 24.

Neutrophils disrupt B-1a cell homeostasis by targeting Siglec-G to exacerbate sepsis

Affiliations

Neutrophils disrupt B-1a cell homeostasis by targeting Siglec-G to exacerbate sepsis

Chuyi Tan et al. Cell Mol Immunol. 2024 Jul.

Abstract

B-1a cells, an innate-like cell population, are crucial for pathogen defense and the regulation of inflammation through their release of natural IgM and IL-10. In sepsis, B-1a cell numbers are decreased in the peritoneal cavity as they robustly migrate to the spleen. Within the spleen, migrating B-1a cells differentiate into plasma cells, leading to alterations in their original phenotype and functionality. We discovered a key player, sialic acid-binding immunoglobulin-like lectin-G (Siglec-G), which is expressed predominantly on B-1a cells and negatively regulates B-1a cell migration to maintain homeostasis. Siglec-G interacts with CXCR4/CXCL12 to modulate B-1a cell migration. Neutrophils aid B-1a cell migration via neutrophil elastase (NE)-mediated Siglec-G cleavage. Human studies revealed increased NE expression in septic patients. We identified an NE cleavage sequence in silico, leading to the discovery of a decoy peptide that protects Siglec-G, preserves peritoneal B-1a cells, reduces inflammation, and enhances sepsis survival. The role of Siglec-G in inhibiting B-1a cell migration to maintain their inherent phenotype and function is compromised by NE in sepsis, offering valuable insights into B-1a cell homeostasis. Employing a small decoy peptide to prevent NE-mediated Siglec-G cleavage has emerged as a promising strategy to sustain peritoneal B-1a cell homeostasis, alleviate inflammation, and ultimately improve outcomes in sepsis patients.

Keywords: B-1a cells; CXCL12; CXCR4; Neutrophil elastase; Neutrophils; Sepsis; Siglec-G.


Conflict of interest statement

The authors declare no competing interests.

Figures
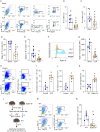
Fig. 1
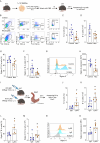
Fig. 1
Siglec-G deficiency causes a more pronounced decrease in the number of peritoneal B-1a cells in sepsis. C57BL/6 mice were subjected to a sham operation or CLP-induced sepsis. After 20 h of CLP, the percentages of B-1a cells (CD19+CD23-B220loCD5+) and Siglec-G+ B-1a cells in the peritoneal cavity (PerC) were determined by flow cytometry. A Representative flow cytometry gating of PerC B-1a cells and B, C bar graphs of the percentage (%) and number of PerC B-1a cells are shown. D, E Bar graphs of the percentage and number of Siglec-G+ PerC B-1a cells are shown. F, G Siglec-G expression in PerC B-1a cells was analyzed, and the mean fluorescence intensity (MFI) of Siglec-G expression is presented in the bar graph. n = 9 mice/group. The experiments were performed three times, and all the data were analyzed. The data are expressed as the means ± SE. The groups were compared by unpaired two-tailed Student’s t test. *p < 0.05 vs. Sham. HJ Primary mouse PerC B-1a cells (1 × 106) were stained with cell tracker dye. Cells were injected into the PerC of WT mice after treatment with LPS (5 mg/kg, i.p.). After 20 h, the number of B-1a cells in the spleen positive for the cell tracker dye was determined by flow cytometry. H Representative flow cytometry gating and I, J bar graph of the percentage and number of B-1a cells positive for the cell tracker dye are shown. n = 6/group. The data are expressed as the means ± SE. The groups were compared by unpaired two-tailed Student’s t test. *p < 0.05 vs. control. The data are representative of two independent experiments. KN WT and Siglec-G−/− PerC B-1a cells were isolated with a MACS kit. K In vitro transmigration of WT and Siglec-G−/− PerC B-1a cells to rmCXCL12 (500 ng/mL) for 4 h was assessed in 24-well Transwell chemotaxis chambers. WT: n = 6, Siglec-G−/−: n = 8. The experiments were performed three times, and all the data were analyzed. The data are expressed as the means ± SE. The groups were compared by unpaired two-tailed Student’s t test. *p < 0.05 vs. WT. L WT and Siglec-G−/− PerC B-1a (1 × 106) cells were stained with cell tracker dye and injected into the PerC of WT mice, followed by treatment with LPS (5 mg/kg, i.p.). After 20 h, the percentage of B-1a cells in the PerC that were positive for the cell tracker dye was determined by flow cytometry. M Representative flow cytometry gating and N a bar diagram of the percentage of PerC B-1a cells positive for the cell tracker dye are shown. n = 6/group. The experiments were performed two times, and all the data were analyzed. The data are expressed as the means ± SE. The groups were compared by unpaired two-tailed Student’s t test. *p < 0.05 vs. WT
Fig. 2
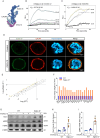
Fig. 2
Siglec-G modulates B-1a cell migration by interacting with CXCL12 and CXCR4. A Computational model of the interaction between mouse Siglec-G (blue) and CXCL12 (purple) and CXCR4 (light green). B Biacore analysis demonstrating the binding of rmSiglec-G to rmCXCL12 with a KD of 2.37 × 10−8. C Biacore analysis demonstrating the binding of rmSiglec-G to huCXCR4 with a KD of 1.49 × 10−9. D PerC B-1a cells from normal WT mice were treated with or without rmCXCL12 (500 ng/mL). After 4 h, the B-1a cells were fixed and stained with an anti-CXCR4 Ab (red), an anti-Siglec-G Ab (green), and DNA (Hoechst 33342, blue), and the images were captured by confocal microscopy. Scale bar: 2 µm. Original magnification: 630×. The data are representative of three independent experiments. E, F WT and Siglec-G−/− PerC B-1a cells were isolated with a MACS kit. WT and Siglec-G−/− PerC B-1a cells (1 × 106) were treated with rmCXCL12 (500 ng/mL) for 2 h. After stimulation, the cells were collected, and total RNA was extracted for cell mobility PCR array analysis. E Scatter plots representing the fold change in the expression of all genes compared to that in WT mice. F Bar diagram representing the fold change in the expression of the indicated genes compared to that in WT mice. The experiments were performed three times, and all the data were used for analysis. GI Expression of the Rac1, phosphorylated (p)-ERK, and total (T)-ERK proteins in WT and Siglec-G−/− PerC B-1a cells treated with or without rmCXCL12, as determined by Western blotting. β-actin served as an internal/loading control. G Representative Western blot images and H, I quantitative bar diagrams are shown. WT: n = 4, Siglec-G−/−: n = 4. The experiments were performed two times, and all the data were analyzed. The data are expressed as the means ± SE. The groups were compared by unpaired two-tailed Student’s t test. *p < 0.05 vs. WT
Fig. 3
Fig. 3
Neutrophils downregulate Siglec-G expression, promoting PerC B-1a cell migration. A Bone marrow-derived neutrophils (BMDMs) were stimulated with LPS (100 ng/mL) for 4 h and then injected into the PerC of WT mice. After 20 h, the percentages of PerC B-1a cells and Siglec-G+ B-1a cells in the PerC were determined by flow cytometry. B Representative flow cytometry gating and C, D bar diagrams of the percentages and numbers of PerC B-1a cells are shown. E, F Bar graphs of the percentage and number of Siglec-G+ PerC B-1a cells are shown. G, H Siglec-G expression in PerC B-1a cells was analyzed, and the MFI of Siglec-G expression is presented in the bar graph. n = 7 mice/group. The experiments were performed three times, and all the data were analyzed. The data are expressed as the means ± SE. The groups were compared by unpaired two-tailed Student’s t test. *p < 0.05 vs. Control. Neu, neutrophils. I Neutrophils were depleted by administering 400 μg of anti-Ly6G depleting antibody i.p. once 24 h prior to CLP surgery. A rat IgG2a isotype antibody was used as a negative control. After 20 h of CLP, the percentages of PerC B-1a cells and Siglec-G+ B-1a cells in the PerC were determined by flow cytometry. J, K Bar graph of the percentage and number of PerC B-1a cells are shown. L, M Bar graph of the percentage and number of Siglec-G+ PerC B-1a cells are shown. N, O Siglec-G expression in PerC B-1a cells was analyzed, and the MFI of Siglec-G expression is presented in the bar graph. n = 6 mice/group. The experiments were performed two times, and all the data were analyzed. The data are expressed as the means ± SE. The groups were compared by unpaired two-tailed Student’s t test. *p < 0.05 vs. IgG
Fig. 4
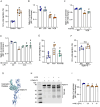
Fig. 4
Neutrophil elastase cleaves Siglec-G to promote PerC B-1a cell migration. A Primary WT mouse PerC B-1a cells and BMDNs were isolated. PerC B-1a cells were cocultured with LPS-stimulated BMDCs, and then an in vitro transmigration assay of PerC B-1a cells to rmCXCL12 (500 ng/mL) was performed for 4 h in a 24-well Transwell chemotaxis chamber. Control: n = 5, Neutrophils (Neu): n = 8. The experiments were performed two times, and all the data were analyzed. The data are expressed as the means ± SE. The groups were compared by unpaired two-tailed Student’s t test. *p < 0.05 vs. Control. B Siglec-G expression in PerC B-1a cells cocultured with LPS-stimulated BMDNs, neutrophil-conditioned medium (NCM) or normal medium (NM) for 24 h was analyzed, and the MFI of Siglec-G expression is presented in the bars. n = 4/group. Representative data from three independent experiments are shown. The data are expressed as the means ± SE and were compared by one-way ANOVA and Dunnett’s test. *p < 0.05 vs. NM. C Primary PerC B-1a cells from WT and Siglec-G−/− mice were cocultured with NCM. In vitro transmigration of PerC B-1a cells to rmCXCL12 (500 ng/mL) for 4 h was assessed in 24-well Transwell chemotaxis chambers. n = 5/group. The experiments were performed two times, and all the data were used for analysis. The groups were compared by unpaired two-tailed Student’s t test. *p < 0.05 vs. WT. D Primary WT mouse PerC B-1a cells were cocultured with NM or NCM with or without neutrophil elastase neutralized antibody (anti-NE) treatment at 5 μg/mL for 24 h. Siglec-G expression on B-1a cells was assessed by flow cytometry. n = 4/group. The data are representative of three independent experiments. The data are expressed as the means ± SE and were compared by one-way ANOVA and Tukey’s test. *p < 0.05 vs. NM+anti-NE (−), #p < 0.05 vs. NCM+anti-NE (−). E Primary WT mouse PerC B-1a cells were cocultured with NM or NCM and treated with or without NE inhibitor (NEi) at different dosages for 20 h. Siglec-G expression on B-1a cells was assessed by flow cytometry. n = 3–4/group. The data are representative of three independent experiments. The data are expressed as the means ± SE and were compared by one-way ANOVA and Tukey’s test. *p < 0.05 vs. NM+NEi (−), #p < 0.05 vs. NCM+NEi (−). F Primary WT mouse PerC B-1a cells were cocultured with NCM and treated with or without NEi at 20 μM. In vitro transmigration of PerC B-1a cells to rmCXCL12 (500 ng/mL) for 4 h was assessed in 24-well Transwell chemotaxis chambers. n = 6/group. The experiments were performed three times, and all the data were used for analysis. The data are expressed as the means ± SE and were compared by one-way ANOVA and Tukey’s test. *p < 0.05 vs. NM, #p < 0.05 vs. NCM. G Computational model of the interaction between mouse Siglec-G (blue) and NE (green). H Coincubation of rmSiglec-G and rmNE at 37 °C for 30 min. Cleavage of rmSiglec-G by rmNE was assessed by Western blotting. A representative Western blot image of three independent experiments is shown. I Primary WT mouse PerC B-1a cells were treated with or without rmNE at different dosages for 24 h. Siglec-G expression on B-1a cells was assessed by flow cytometry. n = 3/group. The data are representative of three independent experiments. The data are expressed as the means ± SE and were compared by one-way ANOVA and Dunnett’s test. *p < 0.05 vs. rmNE (−). N.S. nonsignificant
Fig. 5
Fig. 5
A small decoy peptide targeting the NE-Siglec-G interaction attenuates sepsis. A Computational model of the interaction between the Siglec-G-derived decoy peptide (SDP) (purple) and NE (blue). B, C Primary mouse PerC B-1a cells were cocultured with NCM and treated with or without SDP at different indicated doses for 24 h. Siglec-G expression on B-1a cells was assessed by flow cytometry, and the MFI of Siglec-G expression is presented in the bar graph. n = 4/group. The data are representative of three independent experiments. The data are expressed as the means ± SE and were compared by one-way ANOVA and Tukey’s test. *p < 0.05 vs. NM + SDP (−), #p < 0.05 vs. NCM + SDP (−). DL C57BL/6 mice were subjected to sham or CLP-induced sepsis and treated with SDP (10 mg/kg, i.p.) or vehicle (volume equivalent). After 20 h, the percentages of B-1a cells (CD19+CD23-B220loCD5+) and Siglec-G+ PerC B-1a cells were determined by flow cytometry. D, E Bar graph of the percentage and number of PerC B-1a cells are shown. F, G Bar graph of the percentage and number of Siglec-G-expressing B-1a cells are shown. H Siglec-G expression in PerC B-1a cells as determined by MFI is presented in the bar graph. IK Plasma was analyzed for I IL-10, J TNF-α, and K IL-6 by ELISA. SV: n = 7; SP: n = 3; CV, n = 7; CP: n = 8. The experiments were performed three times, and all the data were used for analysis. The data are expressed as the means ± SE and were compared by one-way ANOVA and Tukey’s test. *p < 0.05 vs. SV; #p < 0.05 vs. CV. SV, sham+vehicle; SP, sham+SDP; CV, CLP+vehicle; CP, CLP + SDP. L A 10-day survival study of septic mice induced by CLP plus SDP (10 mg/kg, i.p.) or vehicle (volume equivalent) at the end of the procedure. n = 25 mice/group. Survival rates were analyzed by the Kaplan‒Meier method using a log-rank test. *p < 0.05 vs. vehicle
Fig. 6
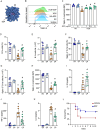
Fig. 6
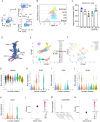
Neutrophils downregulate Siglec-G expression in human cells. AC Human CD19+ B cells and neutrophils were isolated from healthy donors. Primary human B cells were cultured with NM or NCM and treated with or without NEi at the different indicated doses for 24 h. A Representative flow cytometry gating of human B-1 cells (CD20+CD43+CD27+). B, C Siglec-10 expression in human B-1 cells was assessed by flow cytometry, and the MFI of Siglec-G expression is presented in the bar graph. n = 3/group. The data are representative of three independent experiments. The data are expressed as the means ± SE and were compared by one-way ANOVA and Tukey’s test. *p < 0.05 vs. NM+NEi (−), #p < 0.05 vs. NCM+NEi (−). D Computational model of the interaction between human Siglec-10 (blue) and CXCL12 (purple) and CXCR4 (green). E scRNA-seq data on PBMCs from control (n = 4) and sepsis (n = 3) patients were analyzed and projected with uniform manifold approximation and projection (UMAP) plots with colors and the number in parentheses indicating the identified cell cluster. F UMAP representation of B-cell clusters identified in healthy controls and septic patients. GK Annotation of B-lymphocyte subsets was performed manually using MS4A1 (CD20) G, CD27 H, SPN (CD43) I, CD38 J, and CD70 K expression. L SIGLEC-10 expression in cluster #0 in B lymphocyte subsets from healthy controls and septic patients. M CEACAM8 (CD66b) expression in different cell subsets. N ELANE expression in neutrophils from healthy controls and septic patients
Fig. 7
Fig. 7
Summary of findings. Bacterial sepsis or endotoxemia triggers an influx of neutrophils into the peritoneal cavity (PerC). These activated neutrophils play a critical role by releasing neutrophil elastase (NE), which in turn cleaves Siglec-G on PerC B-1a cells. This cleavage disrupts the interaction among Siglec-G, CXCL12, and CXCR4 on B-1a cells. This disruption initiates the activation of the CXCL12-CXCR4-mediated pathway, promoting PerC B-1a cell migration. The safeguarding of Siglec-G using an NE inhibitor or the Siglec-G-derived decoy peptide SDP has emerged as a protective strategy. By maintaining the integrity of Siglec-G, these interventions help sustain peritoneal B-1a cell homeostasis, diminish inflammation, and ameliorate sepsis

Similar articles

Cited by

References

    1. Singer M, Deutschman CS, Seymour CW, Shankar-Hari M, Annane D, Bauer M, et al. The third international consensus definitions for sepsis and septic shock (Sepsis-3) Jama. 2016;315:801–10. - PMC - PubMed
    1. Denning NL, Aziz M, Gurien SD, Wang P. DAMPs and NETs in sepsis. Front Immunol. 2019;10:2536. - PMC - PubMed
    1. Aziz M, Holodick NE, Rothstein TL, Wang P. The role of B-1 cells in inflammation. Immunol Res. 2015;63:153–66. - PMC - PubMed
    1. Aziz M, Holodick NE, Rothstein TL, Wang P. B-1a cells protect mice from sepsis: Critical role of CREB. J Immunol. 2017;199:750–60. - PMC - PubMed
    1. Griffin DO, Holodick NE, Rothstein TL. Human B1 cells in umbilical cord and adult peripheral blood express the novel phenotype CD20+ CD27+ CD43+ CD70. J Exp Med. 2011;208:67–80. - PMC - PubMed

Substances

LinkOut - more resources