. 2024 Jun;31(6):964-976.
doi: 10.1038/s41594-024-01311-9. Epub 2024 May 24.

Tead4 and Tfap2c generate bipotency and a bistable switch in totipotent embryos to promote robust lineage diversification

Affiliations

Tead4 and Tfap2c generate bipotency and a bistable switch in totipotent embryos to promote robust lineage diversification

Meng Zhu et al. Nat Struct Mol Biol. 2024 Jun.

Abstract

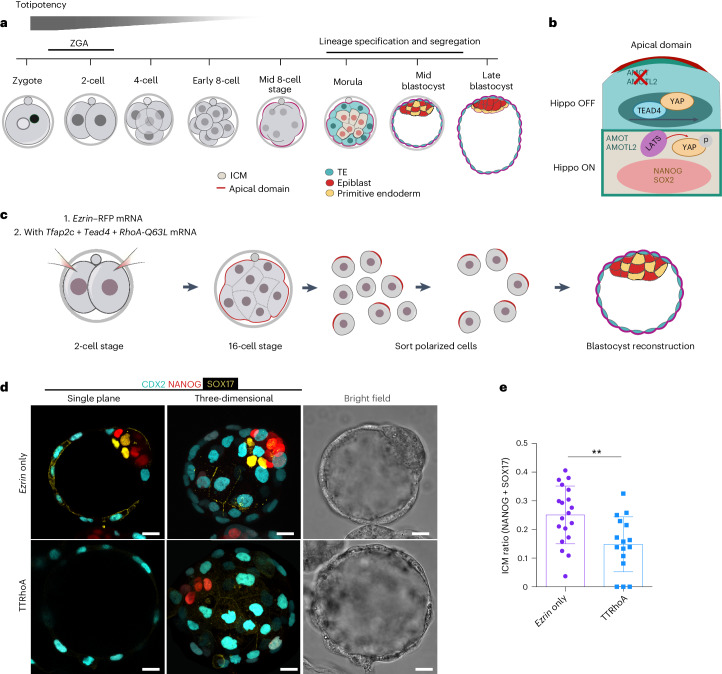
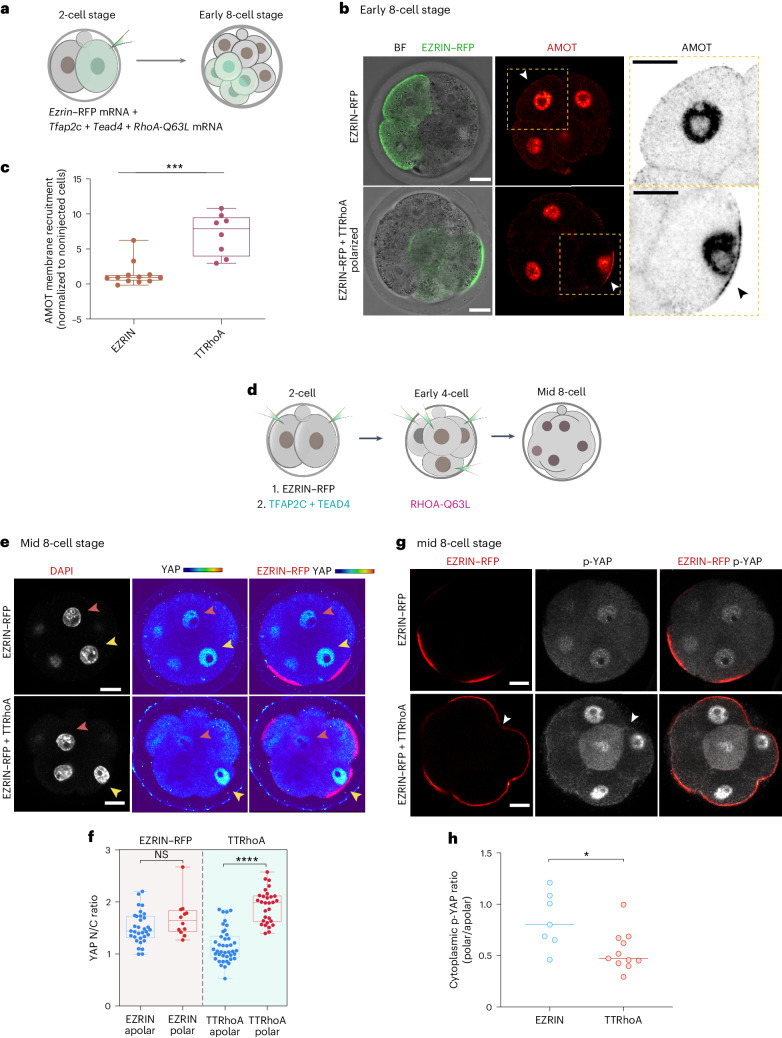
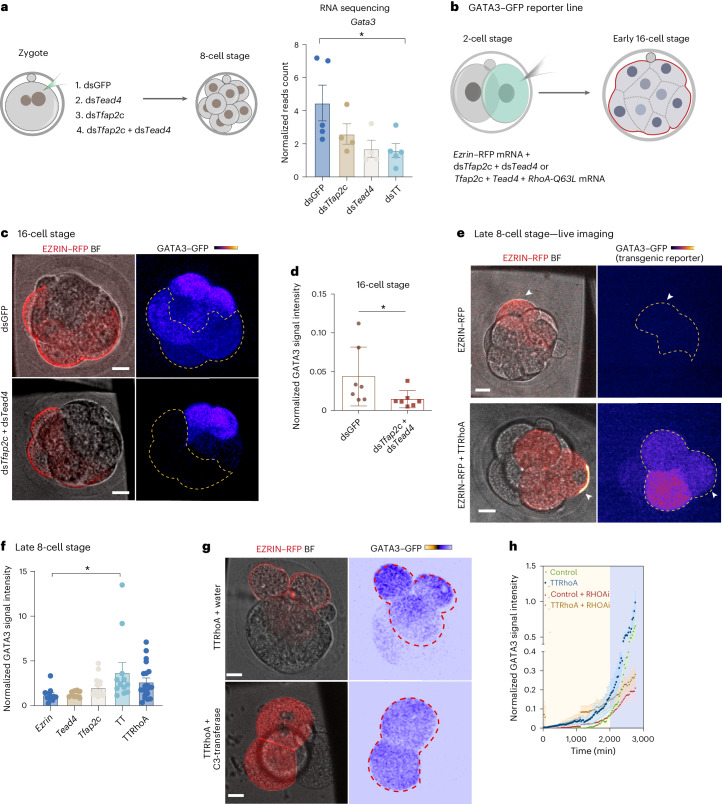
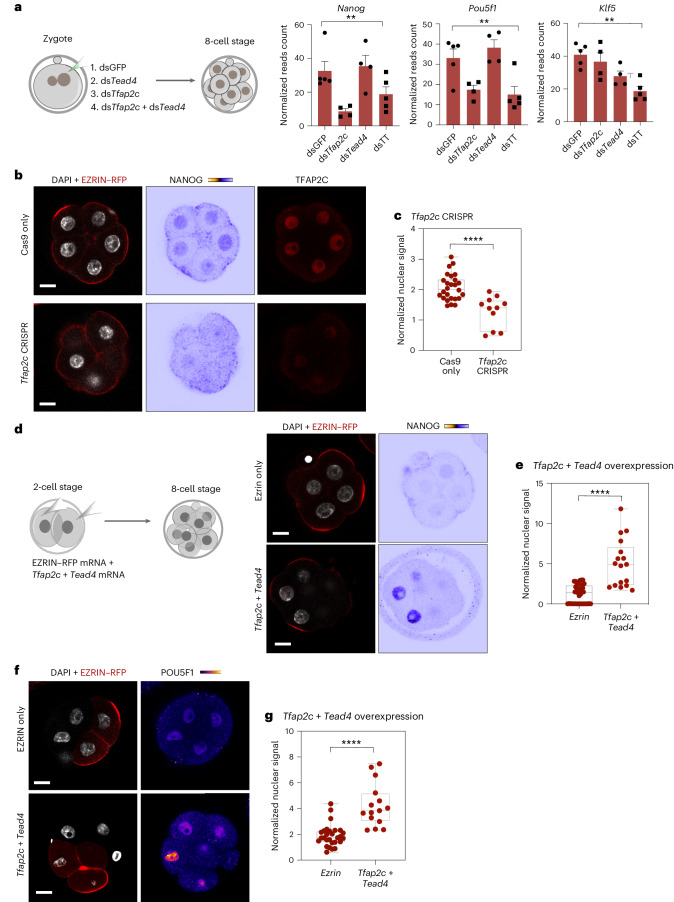
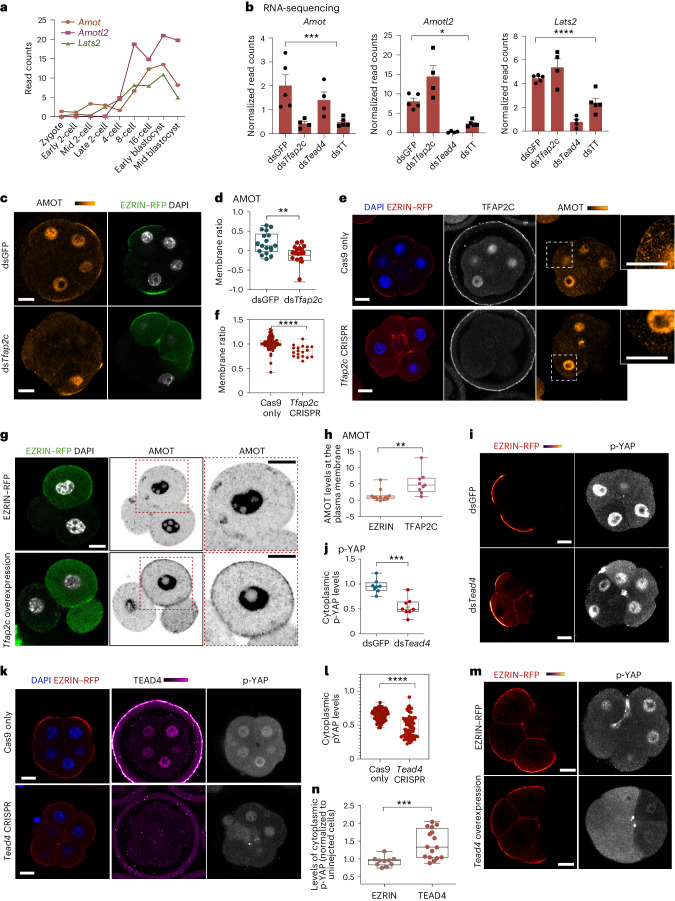
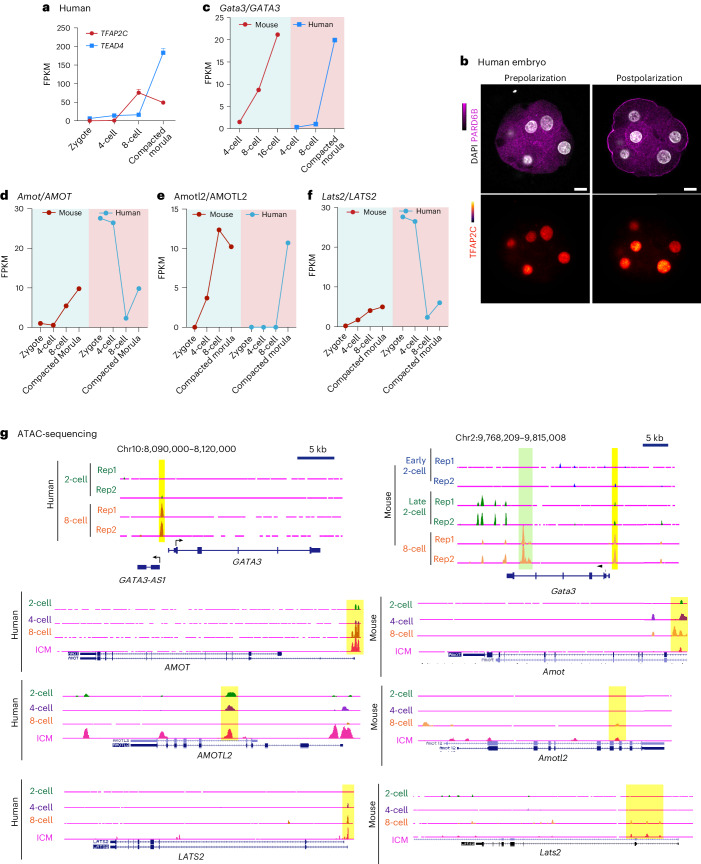
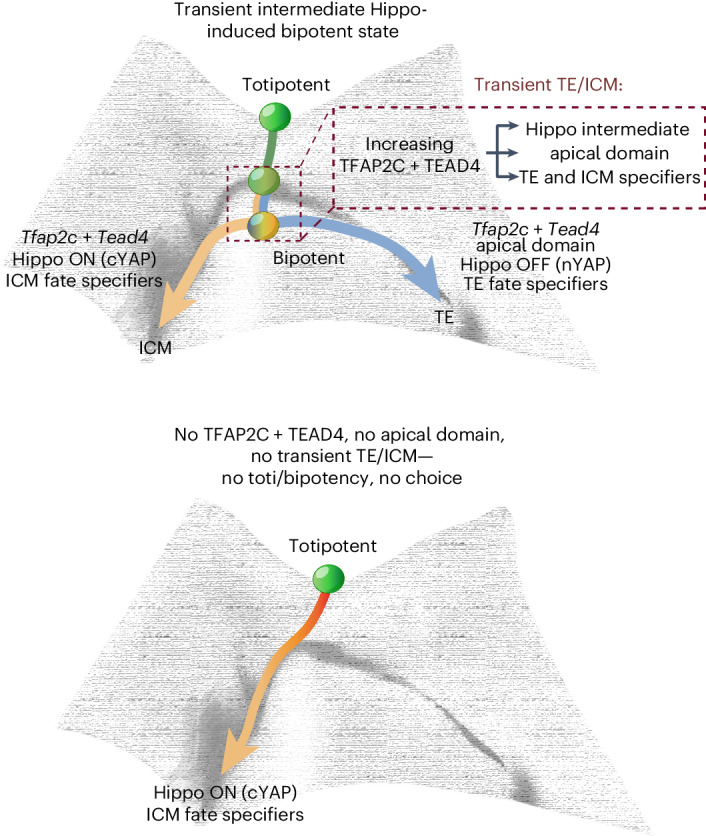
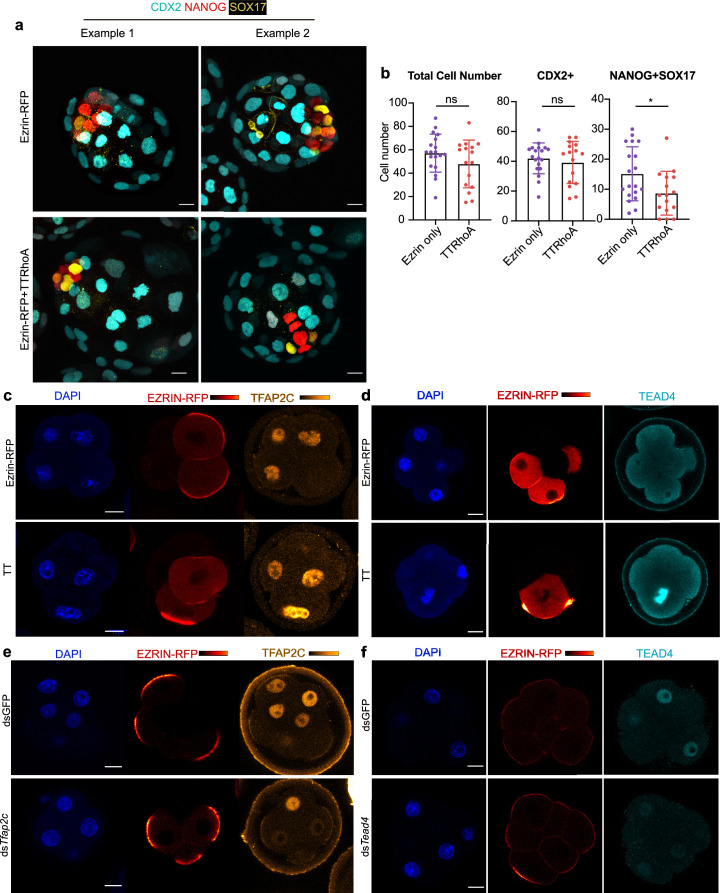
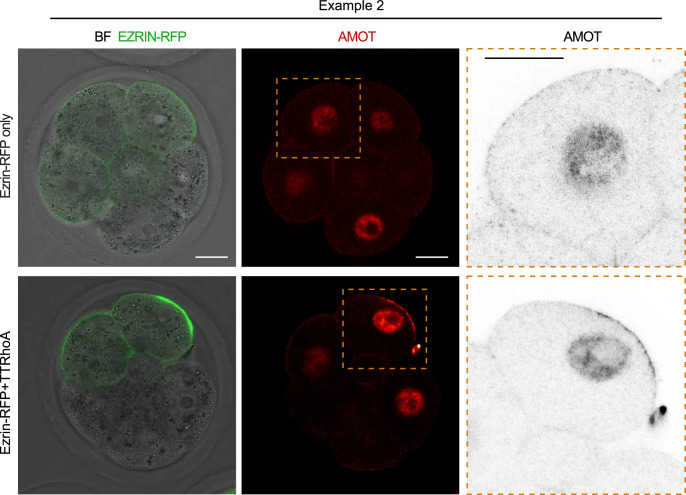
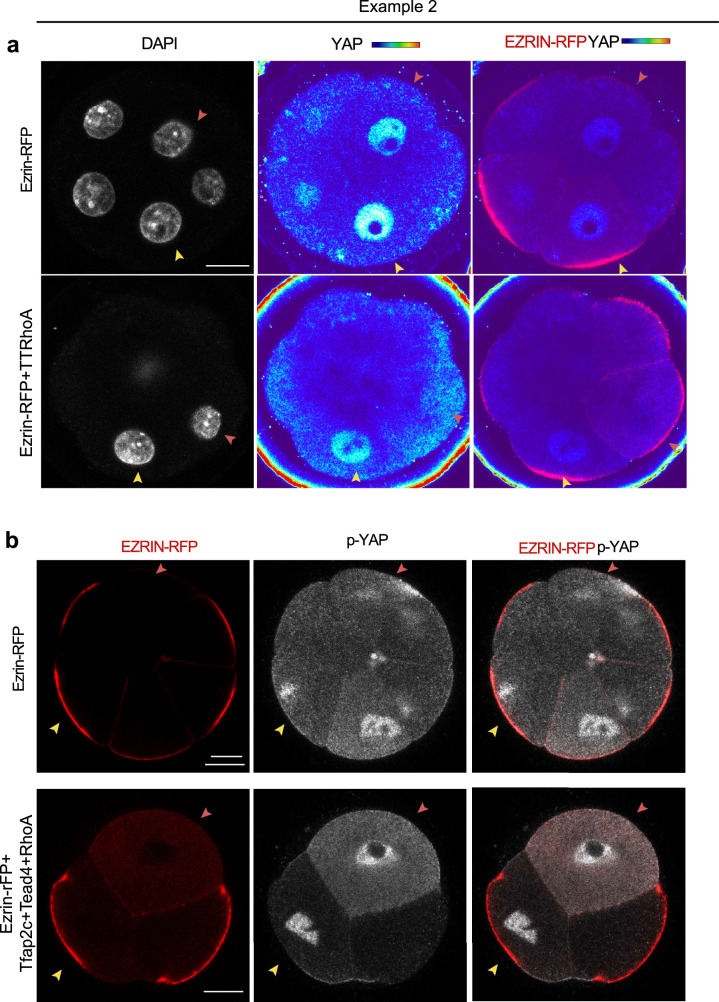
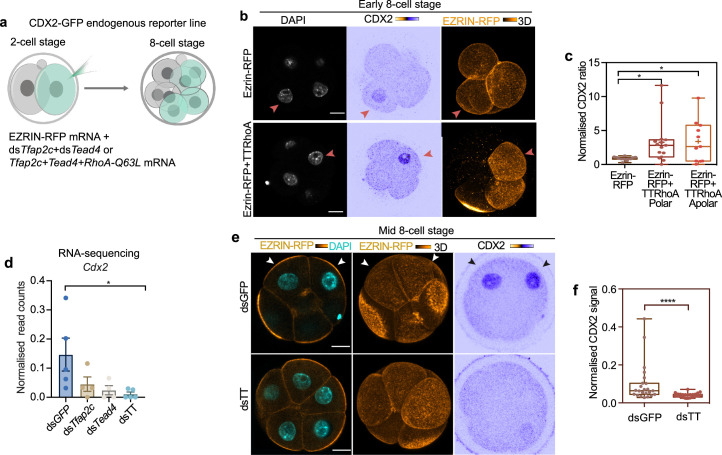
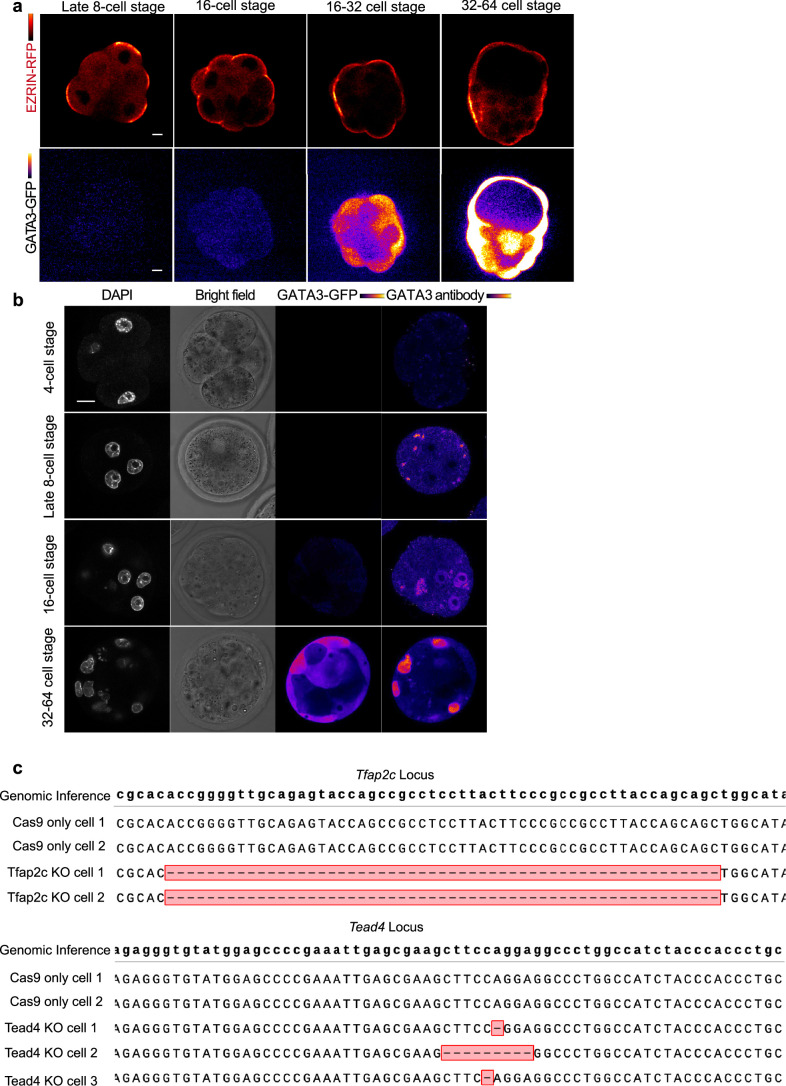
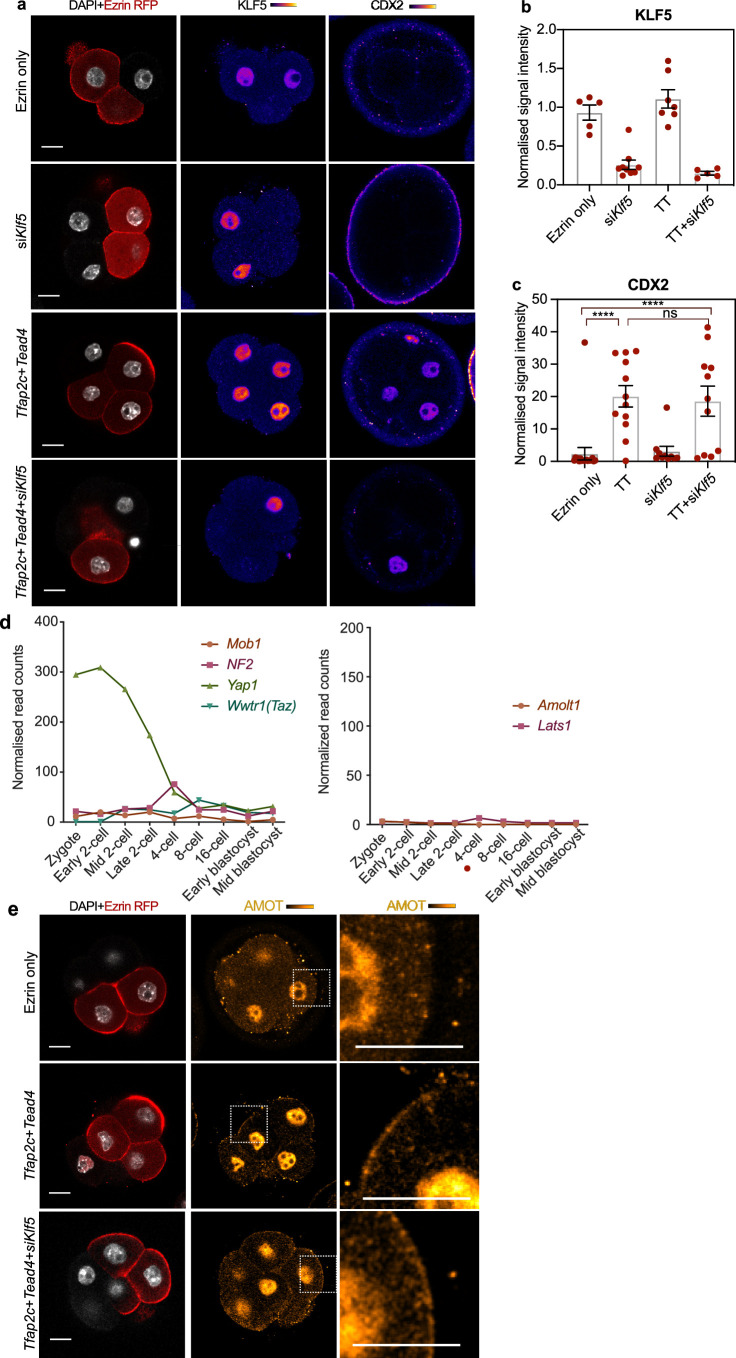
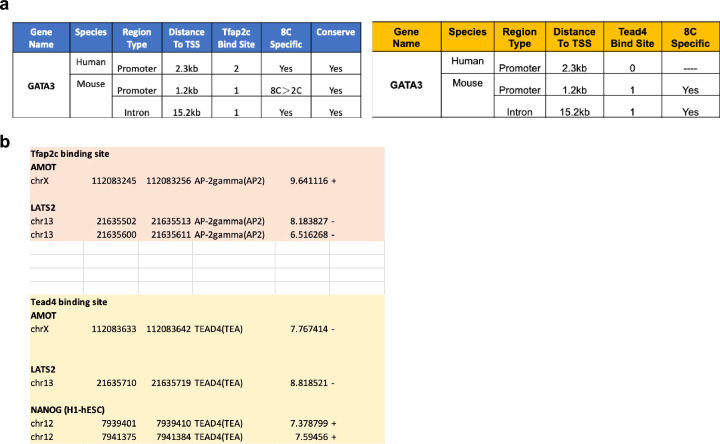
The mouse and human embryo gradually loses totipotency before diversifying into the inner cell mass (ICM, future organism) and trophectoderm (TE, future placenta). The transcription factors TFAP2C and TEAD4 with activated RHOA accelerate embryo polarization. Here we show that these factors also accelerate the loss of totipotency. TFAP2C and TEAD4 paradoxically promote and inhibit Hippo signaling before lineage diversification: they drive expression of multiple Hippo regulators while also promoting apical domain formation, which inactivates Hippo. Each factor activates TE specifiers in bipotent cells, while TFAP2C also activates specifiers of the ICM fate. Asymmetric segregation of the apical domain reconciles the opposing regulation of Hippo signaling into Hippo OFF and the TE fate, or Hippo ON and the ICM fate. We propose that the bistable switch established by TFAP2C and TEAD4 is exploited to trigger robust lineage diversification in the developing embryo.


Conflict of interest statement

The authors declare no competing interests.

Figures

Fig. 1
Fig. 1. Premature expression of TFAP2C, TEAD4 and activated Rho GTPase are sufficient to advance the first cell fate decision.
a, A schematic of preimplantation development. ZGA, zygotic genome activation. b, A schematic of differential Hippo signalling in TE (top) and ICM (bottom) lineages in the morula stage mouse embryo. c, A schematic of blastocyst reconstruction assay. Two-cell stage embryos injected with Ezrin–RFP (Ezrin only, control) or Tfap2c + Tead4 + RhoA mRNA (TTRhoA) were cultured until the early 16-cell stage. Sixteen polarized cells from each genotype were sorted, re-aggregated, cultured until the mid-blastocyst stage and the proportion of ICM examined. d, Representative images of the reconstructed blastocysts from Ezrin-only or TTRhoA embryos. Embryos were immunostained to reveal CDX2 (TE), NANOG (epiblast) and SOX17 (primitive endoderm). e, Quantification of the ratio of ICM from reconstructed blastocysts from Ezrin-only or TTRhoA embryos. The ICM ratio is calculated as the number of cells positive for NANOG or SOX17 divided by the total number of cells (positive for CDX2, NANOG or SOX17). Each dot indicates the data point obtained from one embryo. Data shown as mean ± s.e.m. N = 19 embryos for EZRIN-only group and N = 16 embryos for TTRhoA group. N = 2 experiments. **P = 0.0266, two-sided Student’s t-test. Scale bars, 15 μm. Source data
Fig. 2
Fig. 2. Tfap2c, Tead4 and activated RhoA coordinate Hippo inactivation with apical domain formation.
a, A schematic showing the workflow for experiments in b and c. b, Embryos injected with EZRIN–RFP only (as a control) or TTRhoA mRNAs were analyzed at the early eight-cell stage to reveal EZRIN–RFP and AMOT. The yellow squares indicate the magnified regions. The arrows indicate magnified cells. c, Quantifications of apical membrane enrichment of AMOT in cells expressing EZRIN–RFP or with TTRhoA. Data are shown as individual data points with box and whisker plots (lower: 25%; upper: 75%; line: median; and whiskers: min to max). Each dot indicates an analyzed cell. N = 12 cells for EZRIN–RFP and N = 8 cells for TTRhoA. N = 2 experiments. ***P = 0.0002, two-sided Mann–Whitney test. d, A schematic of TTRhoA overexpression for experiments shown in eg. e, Embryos overexpressing EZRIN–RFP only (as a control) or TTRhoA, immunostained at mid eight-cell stage for DNA (DAPI), YAP and EZRIN–RFP. The pink arrows indicate apolar cells and yellow arrows indicate polar cells. Quantifications are shown in f. f, Quantification of the YAP N/C ratio in the polar or apolar cells of embryos overexpressing EZRIN–RFP only or TTRhoA. Data shown as individual data points with mean, cyan dots indicate polar cells and red dots indicate apolar cells. N = 12 embryos for EZRIN–RFP only and N = 29 embryos for the TTRhoA group, N = 4 experiments, ****P < 0.0001, two-way ANOVA test. YAP N/C ratios between polar and apolar cells are statistically different in the TTRhoA group but not in the EZRIN–RFP only group. g, Embryos overexpressing EZRIN–RFP only (as a control) or TTRhoA analyzed at mid eight-cell stage for EZRIN–RFP or p-YAP. The arrows indicate the apolar cells in TTRhoA overexpressing embryos. h, Quantification of the cytoplasmic ratio of p-YAP between the polar and apolar cells in embryos overexpressing of EZRIN–RFP only or TTRhoA. Data shown as individual data points with mean indicated by the line. N = 7 embryos for EZRIN–RFP only and N = 11 embryos for the TTRhoA group, N = 4 experiments and *P < 0.05, Mann–Whitney test. The lower cytoplasmic level of p-YAP in polar versus apolar cells in TTRhoA embryos versus controls. For all quantifications, data are shown as individual data points with mean. Scale bars, 15 μm. Source data
Fig. 3
Fig. 3. Tfap2c and Tead4 regulate the expression of Gata3 before polarization.
a, RNA-sequencing analysis of Gata3 expression level at the eight-cell stage in embryos injected with dsGFP, dsTfap2c, dsTead4 or dsTfap2c + dsTead4. N = 5 samples for dsGFP and dsTfap2c + dsTead4 and N = 4 samples for dsTfap2c and dsTead4. Data are shown as mean ± s.e.m. *P < 0.05, Kruskal–Wallis test. N = 2 collections. b, A schematic of workflow for experiments in ch. One blastomere of the two-cell stage embryo was injected with mRNA encoding Ezrin only (as a control), or also with dsRNA targeting Tfap2c and Tead4, or also with TTRhoA mRNA. c, Representative images of GATA3–GFP expression level in 8–16-cell stage embryos injected with the indicated dsRNA as described in b. Quantifications are shown in d. *P < 0.05, Mann–Whitney test. d, Quantification of the level of GFP in control and embryos injected with dsRNA targeting Tfap2c and Tead4. *P = 0.0262, Mann–Whitney test. Data are shown as mean ± s.e.m. N = 7 embryos for the Ezrin-only group and N = 7 embryos for the dsTfap2c + dsTead4 group. N = 2 experiments. e, Representative images of GATA3–GFP transgenic late eight-cell embryos, after injection with EZRIN only or TTRhoA, as described in b. The arrows indicate an injected cell. The number of embryos and quantifications shown in f. BF, bright field. f, Quantifications of normalized GATA3–GFP signal intensity in the indicated overexpression conditions. For normalization, GFP signal in injected cells were normalized against the noninjected cells. Data are shown as mean ± s.e.m. The numbers indicate the number of embryos analyzed. *P = 0.0218, one-way ANOVA test. g, Representative images of GATA3–GFP expression in embryos injected with EZRIN–RFP mRNA and TTRhoA, as indicated in b, and treated with water (control) or C3-transferase (RhoA inhibitor) at the late eight-cell stage. Quantifications are shown in h. h, A time course of the normalized GATA3–GFP signal intensity in cells overexpressing EZRIN–RFP only (control), or also exposed to TTRhoA, RhoA inhibitor or TTRhoA + RhoA inhibitor. Data are shown as mean ± s.e.m. n = 7 embryos for each group. The yellow region indicates the early stages of developmental when Gata3 expression is insensitive to RhoA activity (before the 16-cell stage) and the purple region indicates RhoA-sensitive stages (after the 16-cell stage). Scale bars, 15 μm. Source data
Fig. 4
Fig. 4. Tfap2c and Tead4 regulate the expression of ICM specifiers before polarization.
a, The expression of Nanog, Pou5f1 (Oct4) and Klf5 by bulk RNA sequencing in the indicated conditions. **P = 0.0042 for Nanog, P = 0.0021 for Pou5f1 and P = 0.0019 for Klf5, Kruskal–Wallis test. N = 5 samples for dsGFP and dsTfap2c + dsTead4 and N = 4 samples for dsTfap2c and dsTead4. N = 2 collections. Data are shown as mean ± s.e.m. b, Representative images of embryos injected with Cas9 mRNA or with gRNAs targeting Tfap2c gene locus, to fix at the mid eight-cell stage and stain for NANOG and TFAP2C. The quantification is shown in c. c, Quantification of NANOG expression in Cas9-only (control) or Tfap2c-depleted cells by CRISPR–Cas9 shown in b. ****P < 0.0001, two-sided Student’s t-test. N = 27 embryos for the Cas9-only group and N = 10 embryos for Tfap2c KO embryos. N = 2 experiments. Data are shown as individual data points with box and whisker plots (bottom: 25%; upper: 75%; line: median; whiskers: min to max). d, Representative images of embryos injected with EZRIN–RFP mRNA alone or with Tfap2c and Tead4 mRNA, and visualized NANOG expression at the mid eight-cell stage. The embryos were injected at the two-cell stage and fixed at the mid eight-cell stage. e, Quantification of NANOG protein levels in conditions showing in d. N = 39 cells for the EZRIN–RFP group and N = 17 cells for the Tfap2c + Tead4 group. N = 2 experiments. ****P < 0.0001, Mann–Whitney test. Data are shown as individual data points with box and whisker plot (bottom: 25%; upper: 75%; line: median; whiskers: min to max). f, Representative images of embryos injected with EZRIN–RFP mRNA alone or with Tfap2c and Tead4 mRNA at one cell of the two-cell stage and fixed at the early to mid eight-cell stage, and visualized POU5F1 (OCT4) expression at the mid eight-cell stage. g, Quantification of OCT4 protein levels in cells from conditions shown in f. N = 28 cells for the Ezrin–RFP group and N = 15 cells for the Tfap2c + Tead4 group. N = 2 experiments and ****P < 0.0001, Mann–Whitney test. Data are shown as individual data points with box and whisker plots (bottom: 25%; upper: 75%; line: median; whiskers: min to max). Scale bars, 15 μm. Source data
Fig. 5
Fig. 5. Tfap2c and Tead4 regulate Amot, Amotl2 and Lats2 and activate Hippo signaling.
a, The expression profile of Amot, Amotl2 and Lats2, data obtained from Deng et al. b, The expression of Amot (***P = 0.0052, Kruskal–Wallis test), Amotl2 (*P = 0.0115, one-way ANOVA) and Lats2 (****P < 0.0001, Kruskal–Wallis test) by bulk RNA sequencing in the indicated conditions. The expression level is shown as mean ± s.e.m. N = 5 samples for dsGFP and dsTfap2c + dsTead4 and N = 4 samples for dsTfap2c and dsTead4. N = 2 collections. c, Late eight-cell embryos injected with EZRIN–RFP + dsGFP (control) or EZRIN–RFP + dsTfap2c in half embryo and immunostained AMOT, EZRIN–RFP and DNA (DAPI). BF, bright field. d, Quantification of plasma membrane-localized AMOT as in c. N = 17 cells for EZRIN–RFP and N = 14 cells for dsTfap2c. N = 2 experiments. **P = 0.0087, two-sided Mann–Whitney test. e, Mid-eight-cell embryos injected with Cas9 mRNA or with Tfap2c sgRNAs stained with TFAP2C and AMOT. f, Quantification of membrane AMOT as in e. N = 62 cells for Cas9 only and N = 18 cells for Tfpa2c CRISPR. N = 2 experiments. ****P < 0.0001, two-sided Mann–Whitney test. g, Late four-cell embryos overexpressing EZRIN–RFP or with Tfap2c in half embryo immunostained with AMOT, EZRIN–RFP and DNA (DAPI). h, Quantification of membrane AMOT as in k. N = 11 embryos for EZRIN and N = 9 embryos for the Tfap2c group. N = 2 experiments. **P = 0.0013, two-sided Mann–Whitney test. i, Late eight-cell embryos injected with dsRNA targeting GFP (control) or Tead4 dsRNA in half embryo and immunostained EZRIN–RFP and p-YAP. j, Quantification of cytoplasmic p-YAP levels as in g. ***P < 0.001, Mann–Whitney test. N = 8 embryos for dsGFP and N = 8 embryos for dsTead4. N = 2 experiments. k, Mid eight-cell embryos injected with Cas9 mRNA or with Tead4 sgRNAs stained with TEAD4 and p-YAP. l, Quantification of cytoplasmic p-YAP levels as in i. N = 87 cells for Cas9 and N = 68 cells for Tead4 CRISPR. N = 2 experiments. ****P < 0.0001, two-sided Mann–Whitney test. m, Mid eight-cell embryos overexpressing EZRIN–RFP or with Tead4 in half embryo immunostained EZRIN–RFP and p-YAP. n, Quantification of cytoplasmic p-YAP as in m. N = 10 embryos for EZRIN and N = 16 embryos for the Tead4 group. N = 2 experiments. ***P = 0.0002, two-sided Mann–Whitney t-test. For d, f, h, j, l and n, data are shown as individual data points with box and whisker plots (bottom: 25%; upper: 75%; line: median; whiskers: min to max). Scale bars, 15 μm. Source data
Fig. 6
Fig. 6. TFAP2C regulates gene expression prior to cell compaction in the early human embryo and the model.
a, The mRNA expression profiles of TFAP2C and TEAD4 in preimplantation human embryos. Data retrieved from Stirparo et al., 2018 (ref. ). Data are shown as mean ± s.e.m. b, Human embryos before and after polarization were fixed and stained for PARD6 and TFAP2C. N = 4 embryos were examined. cf, mRNA expression profile of Gata3/GATA3 (c), Amot/AMOT (d), Amotl2/AMOTL2 (e) and Lats2/LATS2 (f) in preimplantation mouse and human embryos. Data retrieved from Stirparo et al., 2018 (ref. ). g, The University of California, Santa Cruz browser view showing accessible chromatin regions in Gata3/GATA3 and Amot/AMOT, Amotl2/AMOTL2 and Lats2/LATS2 loci in the mouse and human embryos at different stages, determined from ATAC-sequencing data. Mouse data retrieved from Wu et al.. Human data retrieved from Wu et al.. Scale bars, 15 μm. Source data
Fig. 7
Fig. 7. Model of the bipotential state mapped onto preimplantation development.
In the bipotential state YAP is both nuclear (as in the TE) and cytoplasmic (as in the ICM). We propose here that zygotically expressed Tead4 and Tfap2c accumulate in the nucleus and promote multilineage priming (expression of ICM- and TE-specific transcription factors and of Hippo components). Hippo signaling is intermediate (gray) (active AMOT, AMOTL2 and LATS2 in the cytoplasm), coincident with a preliminary apical domain. At the 16-cell stage, differential Hippo signaling mediated by Tead4, Tfap2c and RhoA and the TE-specific apical domain leads to diversification of the lineages: TE (blue) with Hippo OFF and ICM (beige) with Hippo ON. In the absence of Tfap2c and Tead4, no apical domain is formed and the transient TE/ICM composite state is abolished. As a result, the cells obtain an ICM-like state due to the low but phosphorylated cytoplasmic YAP, as well as the low-level expression of ICM fate specifiers. In the absence of the Hippo system, the cell fate specification is retarded and the cells are trapped in a null state without TE or ICM specification. We propose that totipotency diminishes to bipotency after zygotic genome activation initiates expression of Tead4 and Tfap2c.
Extended Data Fig. 1
Extended Data Fig. 1. Expression of Tfap2c, Tead4 and activated Rho GTPase are sufficient to advance the first cell fate decision.
(a) Representative images of the reconstructed blastocysts from Ezrin-only or TTRhoA embryos. Embryos were immunostained to reveal CDX2 (TE), NANOG (epiblast) and SOX17 (primitive endoderm). Experimental procedures were described as in Fig. 1c. (b) Quantifications of TE and ICM cell numbers in each reconstructed blastocyst generated from experiment described in Fig. 1c. * p = 0.0276; ns, not significant, Two-sided student’s t test. Each dot indicates the datapoint obtained from one embryo. N = 19 embryos for Ezrin-only group, N = 16 embryos for TTRhoA group. N = 2 experiments. (c) Representative images of embryos injected with Ezrin-RFP or with Tfap2c+Tead4+RhoA mRNA in one cell of the 2-cell stage, and immunostained with DAPI with TFAP2C at the 4–8 cell stage. (d) Representative images of embryos injected with Ezrin-RFP or with Tfap2c+Tead4+RhoA mRNA at the one cell of the 2-cell stage, and immunostained with DAPI with TEAD4 at the 8-cell stage. (e) Representative images of embryos injected with EZRIN-RFP and dsRNA targeting Tfap2c at the one cell of the 2-cell stage, and immunostained with DAPI with TFAP2C at the 8- stage. (f) Representative images of embryos injected with EZRIN-RFP and dsRNA targeting Tead4 at both cells of the 2-cell stage, and immunostained with DAPI with TEAD4 at the 8- stage. N = 2 experiments for c-f. Scale bars, 15 μm. Source data
Extended Data Fig. 2
Extended Data Fig. 2. AMOT protein is tethered to the prematurely formed apical domain by the expression of Tfap2c, Tead4, and activated Rho GTPase.
Embryos injected with Ezrin-RFP only (as a control) or TTRhoA mRNAs at one cell of the 2-cell stage and were analysed at the early 8-cell stage to reveal EZRIN-RFP and AMOT. Yellow squares indicate the magnified regions. Arrows indicate magnified cells. Experimental procedures were described as in Fig. 2a. N = 2 experiments. Scale bars, 15 μm.
Extended Data Fig. 3
Extended Data Fig. 3. Expression of Tfap2c, Tead4 and activated Rho GTPase promotes nuclear localisation of YAP in polar cells.
(a) Representative images of embryos injected with mRNA encoding EZRIN-RFP alone (control) or with TTRhoA mRNA as described in Fig. 2a and immunostained at the mid 8-cell stage to reveal the localisation of EZRIN-RFP and YAP. (b) Representative images of embryos injected with mRNA encoding EZRIN-RFP alone (control) or with TTRhoA mRNA as described in Fig. 2d, and immunostained at the mid 8-cell stage to reveal the localisation of EZRIN-RFP and p-YAP. Yellow arrows indicate polarised cells, red arrows indicate unpolarised cells. N = 4 experiments. Scale bars, 15 μm.
Extended Data Fig. 4
Extended Data Fig. 4. Tfap2c and Tead4 regulates the expression of Cdx2 before polarisation.
(a) Schematic of workflow for experiments in (b-c, e-f). (b) Embryos injected with Ezrin-only or also with TTRhoA and analysed at early 8-cell stage for DAPI, CDX2 and EZRIN-RFP. Arrows indicate an injected cell. Quantification shown in c. (c) Quantification of normalised CDX2 nuclear signal intensity in Ezrin-only (polar and apolar) cells, TTRhoA polar cells and TTRhoA apolar cells. (Data shown as individual data points with Box and Whisker plots (lower: 25%; upper: 75%; line: median; whiskers: min to max). Each dot indicates an analysed cell. N = 13 embryos for EZRIN-RFP only; n = 15 embryos for TTRhoA group. *p < 0.05, one-way ANOVA test. (d) RNA-sequencing analysis of Cdx2 expression level at the 8-cell stage in embryos injected with dsRNA targeting GFP, Tfap2c, Tead4 or Tfap2c and Tead4 (dsTT) at the zygote stage. N = 5 samples for dsGFP and dsTT; n = 4 samples for dsTfap2c and dsTead4. Data is shown as mean ± S.E.M. *p = 0.0159, Kruskal-Wallis test. (e) Representative images of CDX2 expression in cells injected with Ezrin-only or also with dsTT at the mid 8-cell stage. Quantification is shown in panel f. (f) Quantification of normalised CDX2 nuclear signal intensity. For the normalisation, the nuclear signal of CDX2 was normalised against DAPI, and then the CDX2/DAPI ratio of injected cells were normalised against the value of non-injected cells. Data shown as individual data points with Box and Whisker plots (lower: 25%; upper: 75%; line: median; whiskers: min to max). N = 13 embryos for EZRIN-RFP only; n = 15 embryos for dsTT group. ****p < 0.0001, Mann-Whitney test. Normalisation is as in d. Scale bars, 15 μm. Source data
Extended Data Fig. 5
Extended Data Fig. 5. Expression profile of the GFP signal in GATA3-GFP transgenic mouse line.
(a) Snapshots of GATA3-GFP transgenic embryos injected with EZRIN-RFP at different developmental stages. GFP signal was undetectable until 16- cell stage, when it was expressed in all cells. Segregation of GFP to the outer polarised cells is observed from 16–32 cell stage. n = 35 embryos examined. Scale bars, 15 μm. (b) Representative images of 4-, late 8-, 16- and 32–64 cell stage embryos carrying GATA3-GFP transgene to immunostain with DAPI and GATA3. A similar expression profile in time and space is detected between the signals yielded from GATA3-GFP transgene reporter and GATA3 antibody. N = 2 embryos for each stage. Scale bars, 15 μm. (c) Single cell genotyping of cells that show high (Cas9 only group) and low (Cas9+sgRNAs) levels of TFAP2C and TEAD4 protein. Criteria for cell grouping is as previously described.
Extended Data Fig. 6
Extended Data Fig. 6. Tfap2c and Tead4 activate the expression of TE and ICM cell fate regulators and Hippo components independent of Klf5.
(a) Representative images of embryos microinjected with EZRIN-RFP mRNA alone, or with Tfap2c+Tead4 mRNA, or Klf5 siRNA, or Tfa2pc+Tead4 mRNA+Klf5 siRNA in one cell of the 2-cell stage, and to immunostain for KLF5, CDX2 and DAPI. (b) Quantification of KLF5 protein levels in conditions showing in a. KLF5 siRNA effectively eliminated KLF5 expression at the protein level, Tfap2c and Tead4 overexpression had no effect on KLF5’s expression. (c) Quantification of CDX2 protein levels in conditions shown in a. Tfap2c and Tead4 expression induced significant upregulation of CDX2 expression at the protein level regardless of the depletion of KLF5. ****p < 0.0001, ns, not significant, Kruskal-Wallis’ test. For b and c, data are shown as bar chart with mean ± SEM and individual data points. N = 19 embryos from Ezrin only group; N = 12 embryos from Tfap2c+Tead4 group; =10 embryos from siKlf5 group; N = 11 embryos from Tfap2c+Tead4+siKlf5 group. N = 2 experiments. (d) The expression profile of Nf2, Mob1, Yap1, Wwtr1, Amotl1 and Lats1 throughout preimplantation development. Data obtained from Deng et al.. (e) Representative images of embryos microinjected with EZRIN-RFP mRNA alone, or with Tfap2c+Tead4 mRNA, or Tfa2pc+Tead4 mRNA+Klf5 siRNA in one cell of the two-cell stage, and immunostained for AMOT and DAPI. Scale bars, 15 μm. Source data
Extended Data Fig. 7
Extended Data Fig. 7. Accessible TFAP2C binding sites are conserved between mouse and human genomic locus.
(a) DNA sequence of the enhancer, promoter and the intron regions of mouse and human Gata3/GATA3 locus was analysed and accessible TFAP2C/TEAD4 binding sites were predicted. Sites with DNA sequence homology above 50% were considered as conserved. (b) DNA sequence of the enhancer, promoter and the intron regions of mouse and human and Amot/AMOT, Amotl2/AMOTL2, Lats2/LAST2 were analysed and accessible TFAP2C/TEAD4 binding sites were predicted. DNA sequence homology above 50% were considered as conserved.

Similar articles

Cited by

References

    1. Zenker J, et al. Expanding actin rings zipper the mouse embryo for blastocyst formation. Cell. 2018;173:776–791 e17. doi: 10.1016/j.cell.2018.02.035. - DOI - PubMed
    1. Fleming TP, Cannon PM, Pickering SJ. The cytoskeleton, endocytosis and cell polarity in the mouse preimplantation embryo. Dev. Biol. 1986;113:406–419. doi: 10.1016/0012-1606(86)90175-2. - DOI - PubMed
    1. Zhu M, Leung CY, Shahbazi MN, Zernicka-Goetz M. Actomyosin polarisation through PLC–PKC triggers symmetry breaking of the mouse embryo. Nat. Commun. 2017;8:921. doi: 10.1038/s41467-017-00977-8. - DOI - PMC - PubMed
    1. Korotkevich E, et al. The apical domain is required and sufficient for the first lineage segregation in the mouse embryo. Dev. Cell. 2017;40:235–247 e7. doi: 10.1016/j.devcel.2017.01.006. - DOI - PMC - PubMed
    1. Johnson MH, Ziomek CA. Induction of polarity in mouse 8-cell blastomeres: specificity, geometry, and stability. J. Cell Biol. 1981;91:303–308. doi: 10.1083/jcb.91.1.303. - DOI - PMC - PubMed

MeSH terms