

Nest excavators' learning walks in the Australian desert ant Melophorus bagoti
- PMID: 38789697
- PMCID: PMC11126504
- DOI: 10.1007/s10071-024-01877-3
Nest excavators' learning walks in the Australian desert ant Melophorus bagoti
Abstract
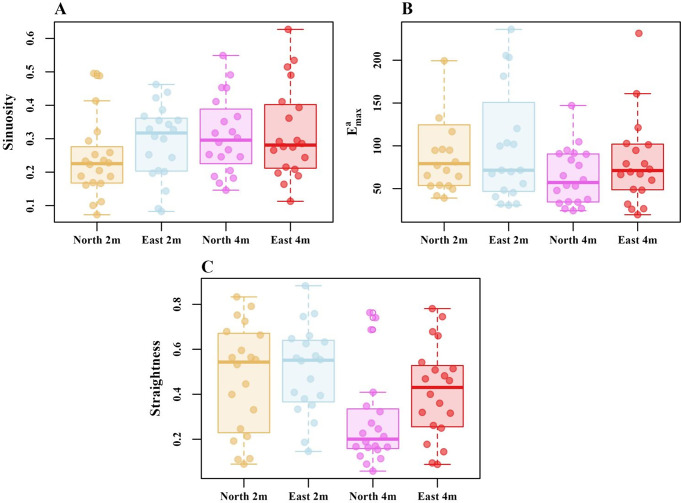
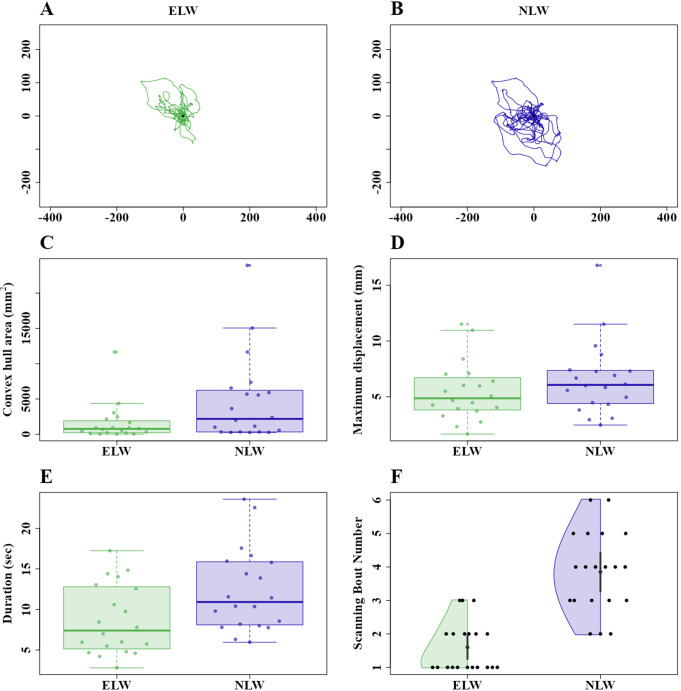
The Australian red honey ant, Melophorus bagoti, stands out as the most thermophilic ant in Australia, engaging in all outdoor activities during the hottest periods of the day during summer months. This species of desert ants often navigates by means of path integration and learning landmark cues around the nest. In our study, we observed the outdoor activities of M. bagoti workers engaged in nest excavation, the maintenance of the nest structure, primarily by taking excess sand out of the nest. Before undertaking nest excavation, the ants conducted a single exploratory walk. Following their initial learning expedition, these ants then engaged in nest excavation activities. Consistent with previous findings on pre-foraging learning walks, after just one learning walk, the desert ants in our study demonstrated the ability to return home from locations 2 m away from the nest, although not from locations 4 m away. These findings indicate that even for activities like dumping excavated sand within a range of 5-10 cm outside the nest, these ants learn and utilize the visual landmark panorama around the nest.
Keywords: Exploratory walks; Navigation; Nest excavation; Red honey ant.
© 2024. The Author(s).
Conflict of interest statement
KC is an associate editor of this journal. The authors declare no other competing or financial interests.
Figures


Similar articles
-
Route learning and transport of resources during colony relocation in Australian desert ants.Learn Behav. 2025 Jun;53(2):204-216. doi: 10.3758/s13420-024-00652-1. Epub 2024 Oct 22. Learn Behav. 2025. PMID: 39438403 Free PMC article.
-
Learning walks in an Australian desert ant, Melophorus bagoti.J Exp Biol. 2021 Aug 15;224(16):jeb242177. doi: 10.1242/jeb.242177. Epub 2021 Aug 26. J Exp Biol. 2021. PMID: 34435625 Free PMC article.
-
The effect of spatially restricted experience on extrapolating learned views in desert ants, Melophorus bagoti.Anim Cogn. 2020 Nov;23(6):1063-1070. doi: 10.1007/s10071-020-01359-2. Epub 2020 Feb 12. Anim Cogn. 2020. PMID: 32052283
-
Traveling in clutter: navigation in the Central Australian desert ant Melophorus bagoti.Behav Processes. 2009 Mar;80(3):261-8. doi: 10.1016/j.beproc.2008.10.015. Epub 2008 Nov 13. Behav Processes. 2009. PMID: 19049857 Review.
-
Experimental ethology of learning in desert ants: Becoming expert navigators.Behav Processes. 2019 Jan;158:181-191. doi: 10.1016/j.beproc.2018.12.001. Epub 2018 Dec 5. Behav Processes. 2019. PMID: 30529645 Review.
Cited by
-
Desert Ant (Melophorus bagoti) Dumpers Learn from Experience to Improve Waste Disposal and Show Spatial Fidelity.Insects. 2024 Oct 16;15(10):814. doi: 10.3390/insects15100814. Insects. 2024. PMID: 39452390 Free PMC article.
-
Desert ants (Melophorus bagoti) oscillate and scan more in navigation when the visual scene changes.Anim Cogn. 2025 Feb 20;28(1):15. doi: 10.1007/s10071-025-01936-3. Anim Cogn. 2025. PMID: 39979462 Free PMC article.
-
The relative landmark shift during free movement on a treadmill may enhance visual learning for ant foragers.J Comp Physiol A Neuroethol Sens Neural Behav Physiol. 2025 Jul;211(4):403-410. doi: 10.1007/s00359-025-01738-5. Epub 2025 Mar 28. J Comp Physiol A Neuroethol Sens Neural Behav Physiol. 2025. PMID: 40153050
-
Phobic responses of bull ants (Myrmecia midas) to odours introduced on their foraging route.J Comp Physiol A Neuroethol Sens Neural Behav Physiol. 2025 Jul 11. doi: 10.1007/s00359-025-01750-9. Online ahead of print. J Comp Physiol A Neuroethol Sens Neural Behav Physiol. 2025. PMID: 40646347
-
Route learning and transport of resources during colony relocation in Australian desert ants.Learn Behav. 2025 Jun;53(2):204-216. doi: 10.3758/s13420-024-00652-1. Epub 2024 Oct 22. Learn Behav. 2025. PMID: 39438403 Free PMC article.
References
-
- Bates D, Mächler M, Bolker B, Walker S (2015) Fitting linear mixed-effects models Usinglme4. J Stat Softw 67(1)1–48. 10.18637/jss.v067.i01
-
- Batschelet E (1981) Circular statistics in biology. Academic Press, New York, London.
-
- Becker L (1958) Untersuchungen über das Heimfindevermögen Der Bienen. Z für Vergleichende Physiologie 41:1–25.
-
- Benhamou S (2004) How to reliably estimate the tortuosity of an animal’s path: straightness, sinuosity, or fractal dimension? J Theor Biol 229(2):209–220. 10.1016/j.jtbi.2004.03.016 - PubMed
MeSH terms
LinkOut - more resources
Full Text Sources
