. 2024 Jul;242(7):1645-1658.
doi: 10.1007/s00221-024-06856-1. Epub 2024 May 24.

Traumatic brain injury heterogeneity affects cell death and autophagy

Affiliations

Traumatic brain injury heterogeneity affects cell death and autophagy

Brandon Z McDonald et al. Exp Brain Res. 2024 Jul.

Abstract

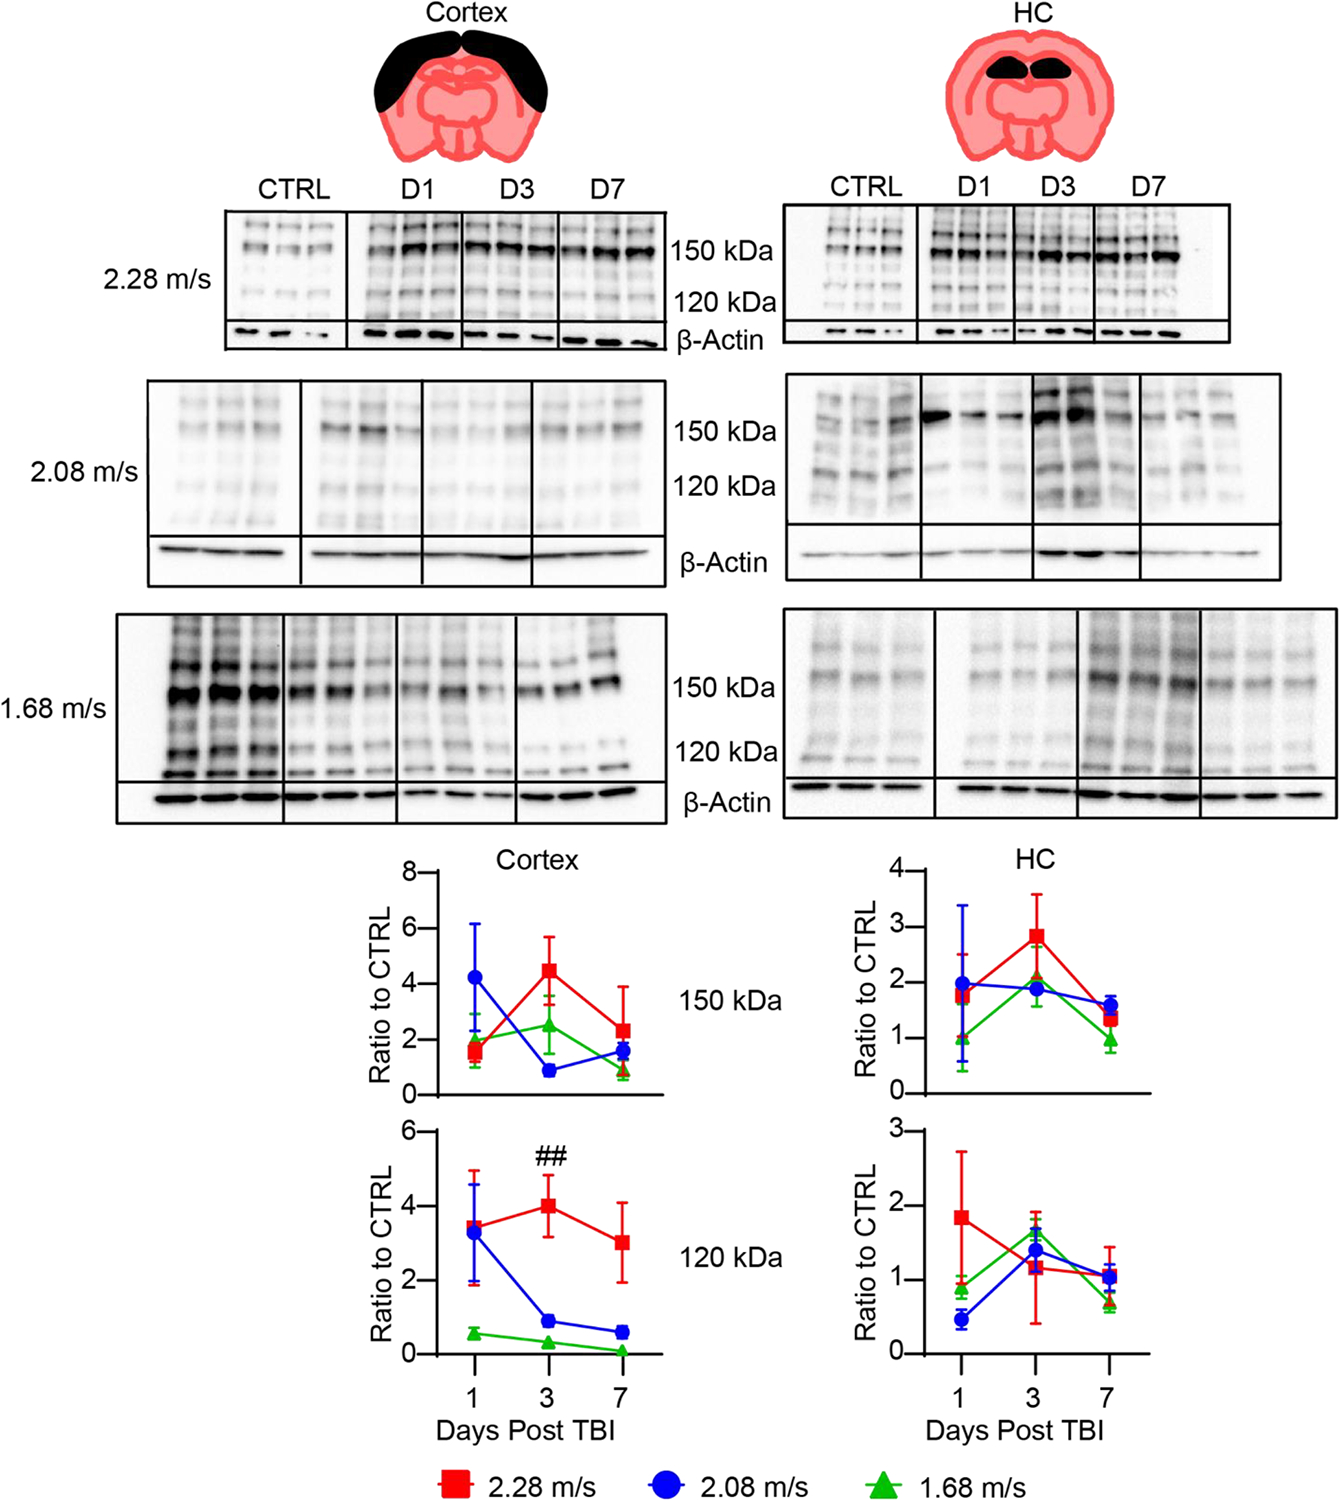
Traumatic brain injury (TBI) mechanism and severity are heterogenous clinically, resulting in a multitude of physical, cognitive, and behavioral deficits. Impact variability influences the origin, spread, and classification of molecular dysfunction which limits strategies for comprehensive clinical intervention. Indeed, there are currently no clinically approved therapeutics for treating the secondary consequences associated with TBI. Thus, examining pathophysiological changes from heterogeneous impacts is imperative for improving clinical translation and evaluating the efficacy of potential therapeutic strategies. Here we utilized TBI models that varied in both injury mechanism and severity including severe traditional controlled cortical impact (CCI), modified mild CCI (MTBI), and multiple severities of closed-head diffuse TBI (DTBI), and assessed pathophysiological changes. Severe CCI induced cortical lesions and necrosis, while both MTBI and DTBI lacked lesions or significant necrotic damage. Autophagy was activated in the ipsilateral cortex following CCI, but acutely impaired in the ipsilateral hippocampus. Additionally, autophagy was activated in the cortex following DTBI, and autophagic impairment was observed in either the cortex or hippocampus following impact from each DTBI severity. Thus, we provide evidence that autophagy is a therapeutic target for both mild and severe TBI. However, dramatic increases in necrosis following CCI may negatively impact the clinical translatability of therapeutics designed to treat acute dysfunction in TBI. Overall, these results provide evidence that injury sequalae affiliated with TBI heterogeneity is linked through autophagy activation and/or impaired autophagic flux. Thus, therapeutic strategies designed to intervene in autophagy may alleviate pathophysiological consequences, in addition to the cognitive and behavioral deficits observed in TBI.

Keywords: Autophagy; Cell death; Concussion/mild TBI; Secondary injury.


Conflict of interest statement

Statements and Declarations

The authors declare no conflict of interest. All animal work reported here was approved by the Institutional Animal Care and Use Committee at the University of Nebraska – Lincoln under protocol number 2300.

Figures

Fig. 1
Fig. 1. Gross neuropathological features following TBI
a) Schematic for experimental TBI conditions. b) Representative brain images collected from each impact model (N=3) at 1, 3, and 7 days post injury. Cortical lesions were present at each time point following CCI with visible hemorrhaging at days 1 and 3 post impact. Mild impacts did not produce cortical lesions. Hemorrhaging was observed at 1 and 3 days post DTBI. CTRL: control; CCI: severe, traditional controlled cortical impact; MTBI: mild impact with modified silicone tip; DTBI: closed-head impact with protective helmet
Fig. 2
Fig. 2. Injury timeline of quantified data for SBDPs at 1, 3, and 7 days post CCI and MTBI
Necrosis was present in each of the four brain regions post CCI and peaked at 3 days post injury. In contrast, no significant increase in necrotic damage was observed following MTBI. Significant differences in apoptosis were observed in 3 out of the 4 brain regions, despite no significant increase when either model was compared to CTRL. All data are represented as mean ± SD (N=3). #: CCI vs MTBI. (#: p<0.05; ##: p<0.01; ###: p<0.001.) SBDPs: α-II spectrin breakdown products; CCI: controlled cortical impact; MTBI: mild impact; DTBI: closed-head impact; LC: left cortex; RC: right cortex; LH: left hippocampus; RH: right hippocampus; D1: day 1; D3: day 3; D7: day 7
Fig. 3
Fig. 3. Injury timeline of quantified data for SBDPs at 1, 3, and 7 days post DTBI
Impact at 2.28 m/s had the greatest fold change in total cell death with peak increases at 3 days in both the cortex and hippocampus. Apoptosis peaked at 3 days in the cortex post DTBI at 2.28 m/s, which statistically differed from impacts at both 2.08 and 1.68 m/s. DTBI data was averaged between left and right hemispheres for the cortex and hippocampus. All data are represented as mean ± SD (N=3). DTBI 2.28 m/s vs DTBI 2.08 and 1.68 m/s. (#: p<0.05; ##: p<0.01.) SBDPs: α-II spectrin breakdown products; DTBI: closed-head impact; HC: hippocampus; D1: day 1; D3: day 3; D7: day 7
Fig. 4
Fig. 4. TFEB nuclear translocation at 3 days post injury
Representative confocal images of the ipsilateral and contralateral cortex and hippocampus, including the dentate gyrus (DG) and regions 2 and 3 of the cornua ammonis (CA2/3), at 3 days post injury for each impact model (N=3). Co-staining for transcription factor EB (TFEB: Red) and DAPI (Blue) was used to assess autophagy activation. Mander’s colocalization coefficient (M2) showed a significant increase in TFEB nuclear translocation in each ipsilateral region following CCI, and in the cortex following DTBI. Red asterisk indicates significance from Kruskal-Wallis statistical analysis. Scale bars correspond to 20 μm. CTRL: control; CCI: controlled cortical impact; MTBI: mild impact; DTBI: closed-head impact.
Fig. 5
Fig. 5. Autophagic substrates accumulation at 3 days post impact
Representative confocal images of the ipsilateral cortex at 3 days post injury for each impact model (N=3). Mander’s co-localization coefficient showed a significant increase in co-localization between LC3B and LAMP1 post-CCI. No significant difference was observed in the contralateral region, despite a trending increase post-CCI. Additionally, no significant increases were observed for either mild impact model. Scale bars correspond to 20 μm. LC3B: microtubule-associated protein 1A/1B light chain 3B; LAMP1: lysosomal-associated membrane protein 1; CTRL: control; CCI: controlled cortical impact; MTBI: mild impact; DTBI: closed-head impact.
Fig. 6
Fig. 6. Autophagic flux in the hippocampi following CCI and MTBI
a) LC3BII and SQSTM1 protein expression increased at 1 and 7 days post CCI in the ipsilateral and contralateral hippocampus, respectively. LC3BII peaked at 1 day post MTBI in the contralateral hippocampus, while no increase in SQSTM1 was observed at any time point. b) SQSTM1 protein expression was significantly different between CCI and MTBI in both the ipsilateral and contralateral hippocampus. All data are represented as mean ± SD (N=3). *: CTRL vs CCI or MTBI; #: CCI vs MTBI (* or #: p<0.05; ** or ##: p<0.01.) LC3B: microtubule-associated protein 1A/1B light chain; SQSTM1: sequestome1; CCI: controlled cortical impact; MTBI: mild impact; LH: left hippocampus; RH: right hippocampus; D1: day 1; D3: day 3; D7: day 7
Fig. 7
Fig. 7. Autophagic flux in the hippocampus following DTBI
a) LC3BII and SQSTM1 protein expression increased at 1 day post DTBI in the hippocampus for impacts at 2.28 and 2.08 m/s. b) SQSTM1 protein expression significantly differed between impacts at 2.28 and 1.68 m/s. DTBI data was averaged between left and right hemispheres for the cortex and HC. All data are represented as mean ± SD (N=3). *: CTRL vs DTBI; #: DTBI 2.28 m/s vs DTBI 1.68 m/s (* or #: p<0.05; **: p<0.01; ***: p<0.001) LC3B: microtubule-associated protein 1A/1B light chain; SQSTM1: sequestome1; DTBI: closed-head impact; HC: hippocampus; D1: day 1; D3: day 3; D7: day 7

References

    1. Andriessen TM, Jacobs B, & Vos PE (2010). Clinical characteristics and pathophysiological mechanisms of focal and diffuse traumatic brain injury. J Cell Mol Med, 14(10), 2381–2392. 10.1111/j.1582-4934.2010.01164.x - DOI - PMC - PubMed
    1. Au AK, Aneja RK, Bayır H, Bell MJ, Janesko-Feldman K, Kochanek PM, & Clark RSB (2017). Autophagy Biomarkers Beclin 1 and p62 are Increased in Cerebrospinal Fluid after Traumatic Brain Injury. Neurocrit Care, 26(3), 348–355. 10.1007/s12028-016-0351-x - DOI - PubMed
    1. Bjørkøy G, Lamark T, Pankiv S, Øvervatn A, Brech A, & Johansen T (2009). Monitoring autophagic degradation of p62/SQSTM1. Methods Enzymol, 452, 181–197. 10.1016/s0076-6879(08)03612-4 - DOI - PubMed
    1. Bodnar CN, Roberts KN, Higgins EK, & Bachstetter AD (2019). A Systematic Review of Closed Head Injury Models of Mild Traumatic Brain Injury in Mice and Rats. J Neurotrauma, 36(11), 1683–1706. 10.1089/neu.2018.6127 - DOI - PMC - PubMed
    1. Bolte S, & Cordelières FP (2006). A guided tour into subcellular colocalization analysis in light microscopy. Journal of microscopy, 224(3), 213–232. - PubMed

LinkOut - more resources