. 2024 May 24;22(1):283.
doi: 10.1186/s12951-024-02536-y.

Enhancing intraneural revascularization following peripheral nerve injury through hypoxic Schwann-cell-derived exosomes: an insight into endothelial glycolysis

Affiliations

Enhancing intraneural revascularization following peripheral nerve injury through hypoxic Schwann-cell-derived exosomes: an insight into endothelial glycolysis

Jun Sun et al. J Nanobiotechnology. .

Abstract

Background: Endothelial cell (EC)-driven intraneural revascularization (INRV) and Schwann cells-derived exosomes (SCs-Exos) both play crucial roles in peripheral nerve injury (PNI). However, the interplay between them remains unclear. We aimed to elucidate the effects and underlying mechanisms of SCs-Exos on INRV following PNI.

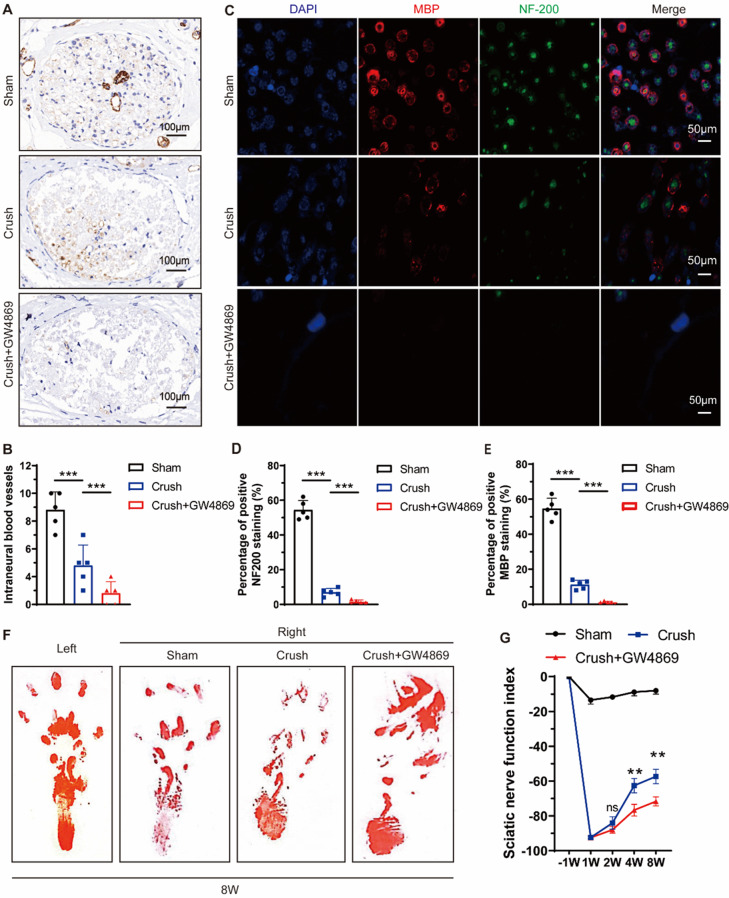
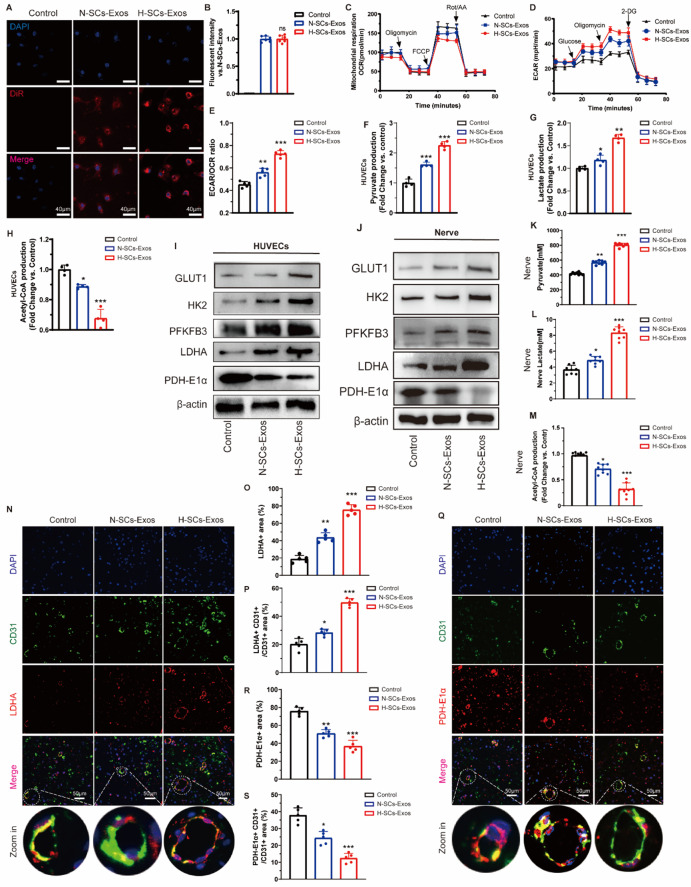
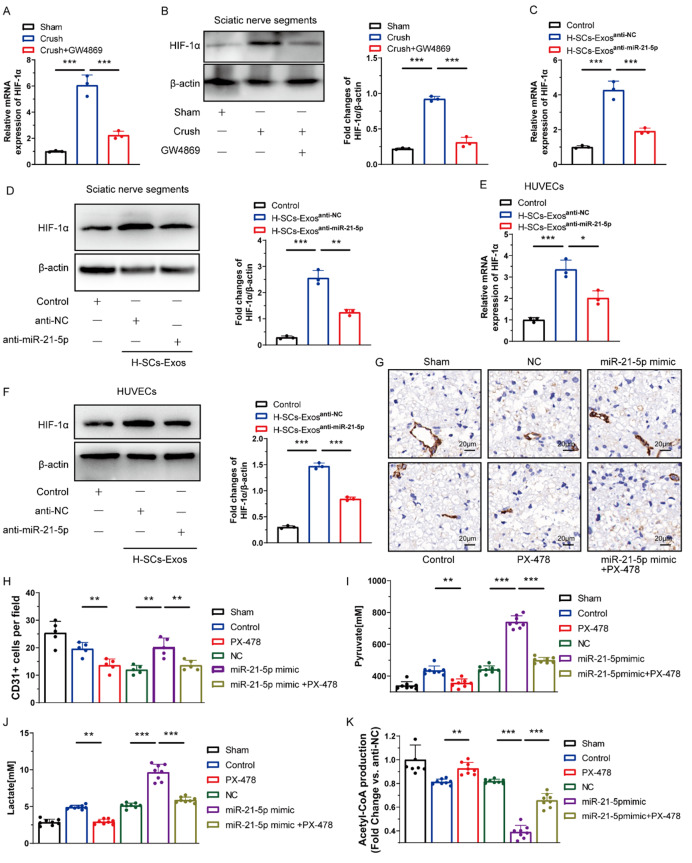
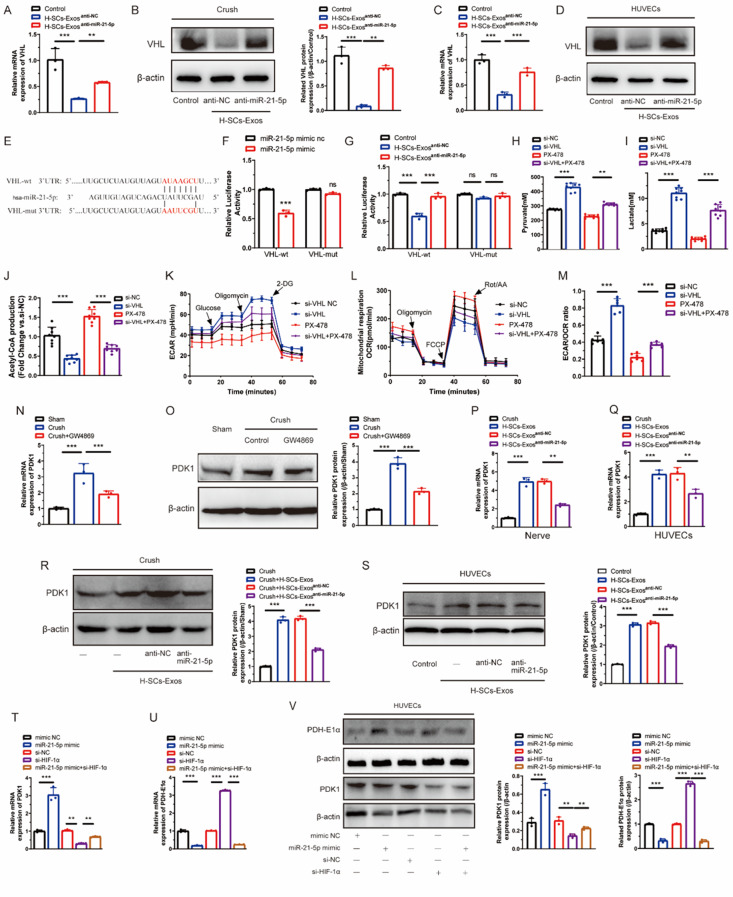
Results: We found that GW4869 inhibited INRV, as well as that normoxic SCs-Exos (N-SCs-Exos) exhibited significant pro-INRV effects in vivo and in vitro that were potentiated by hypoxic SCs-Exos (H-SCs-Exos). Upregulation of glycolysis emerged as a pivotal factor for INRV after PNI, as evidenced by the observation that 3PO administration, a glycolytic inhibitor, inhibited the INRV process in vivo and in vitro. H-SCs-Exos more significantly enhanced extracellular acidification rate/oxygen consumption rate ratio, lactate production, and glycolytic gene expression while simultaneously suppressing acetyl-CoA production and pyruvate dehydrogenase E1 subunit alpha (PDH-E1α) expression than N-SCs-Exos both in vivo and in vitro. Furthermore, we determined that H-SCs-Exos were more enriched with miR-21-5p than N-SCs-Exos. Knockdown of miR-21-5p significantly attenuated the pro-glycolysis and pro-INRV effects of H-SCs-Exos. Mechanistically, miR-21-5p orchestrated EC metabolism in favor of glycolysis by targeting von Hippel-Lindau/hypoxia-inducible factor-1α and PDH-E1α, thereby enhancing hypoxia-inducible factor-1α-mediated glycolysis and inhibiting PDH-E1α-mediated oxidative phosphorylation.

Conclusion: This study unveiled a novel intrinsic mechanism of pro-INRV after PNI, providing a promising therapeutic target for post-injury peripheral nerve regeneration and repair.

Keywords: Exosome; Glycolysis; Intraneural revascularization; Peripheral nerve injury; Schwann cell; Sciatic nerve; miR-21-5p.


Conflict of interest statement

The authors declare no competing interests.

Figures

Fig. 1
Fig. 1
Exosomal shuttle is involved in post-injury intra-neuro-revascularization and nerve repair after sciatic nerve injury. (A). Representative immunohistochemical staining of CD31 (brown) and nuclei (blue) was conducted to visualize intraneural blood vessels in the sciatic nerve segments from both the sham group (exposed sciatic nerve without injury) and the crush group (with crush injury), with or without administration of GW4869 (scale bar = 100 μm, n = 5 rats/group). (B). The quantifications of the numbers of intraneural blood vessels shown in (A). (C). Representative immunofluorescent staining of neurofilaments (NF-200, green), myeline (MBP, red), and nuclei (DAPI, blue) to evaluate post-injury nerve regeneration (scale bar = 50 μm, n = 5 rats/group). (D-E). The quantifications of the NF-200 and MBP positive area shown in (C). (F). Representative footprints of rats with or without GW4869 administration after 8 weeks of sciatic nerve crush injury. The left image shows the control group and the right image the sham or operative group. (G). Sciatic functional index (SFI) analysis to evaluate functional recovery from weeks 1 to 8 after sciatic nerve injury (n = 5 rats/group). *P < 0.05, **P < 0.01, ***P < 0.001. Bars represent group means ± SD. A Student’s t test was used for comparisons. NF-200: Neurofilament-200; MBP: Myelin basic protein
Fig. 2
Fig. 2
H-SCs-Exos promotes intraneural angiogenesis and nerve repair after sciatic nerve injury. (A). Representative TEM for N-/H-SCs-Exos (scale bar = 100 μm). (B). NTA for concentration and size of N-/H-SCs-Exos. (C). Western blot assay for detecting exosomal-specific markers TSG101, CD9, and CD63 and cytoplasm marker calnexin. (D–F). Representative tube formation, transwell invasion, and EdU assay for evaluating endothelial angiogenic capacity after N-/H-SCs-Exos treatment (scale bar = 200–50 μm). (G). Data analysis for D to F (n = 5 rats/group). (H). PKH-67-labeled N-H-SCs-Exos (green) track in intraneural endothelial cells (ECs; CD31+, red) of injured sciatic nerve sites (scale bar = 50 μm, n = 5 rats/group). (I). CD31 + PKH-67+/CD31 + ratio. (J). CD31 + ECs per field analysis. (K). Representative immunofluorescent staining of neurofilaments (NF-200, green), myeline (MBP, red), and nuclei (DAPI, blue) to evaluate post-injury nerve regeneration (scale bar = 50 μm, n = 5 rats/group) and data analysis shown in L to N. Representative footprints of rats with saline or N-/H-SCs-Exos administration at 8 weeks after sciatic nerve crush injury. The left image shows the control group and the right image the sham or operative group. (O). Sciatic functional index calculation to evaluate functional recovery from week 1 to 8 after sciatic nerve injury (n = 5 rats/group). *P < 0.05, **P < 0.01, ***P < 0.001. Bars represent group means ± SD. A Student’s t test was used for comparisons. NF-200: Neurofilament-200; MBP: Myelin basic protein; TEM: Transmission electron microscope; NTA: Nanosight tracking analysis; SFI: Sciatic functional index
Fig. 3
Fig. 3
H-SCs-Exos boosts glycolysis but inhibits oxidative phosphorylation in vitro and in vivo. (A). Capability of HUVECs to endocytose DiR-labeled N-/H-SCs-Exos (red, DiR; blue, DAPI; scale bar = 40 μm, n = 6 rats/group. (B). Fluorescent intensity analysis of A. C. HUVEC OCR assay for evaluating cellular mitochondrial respiration. (D). HUVECs’ ECAR assay for evaluating cellular glycolytic level. (E). ECAR/OCR ratio calculation for further analysis. (F). Pyruvate production, (G). lactate production, and (H). acetyl-coA production of HUVECs after N-/H-SCs-Exos treatment (n = 4 rats/group). (I). GLUT1, HK2, PFKFB3, LDHA, and PDH-E1α protein expression in HUVECs after N-/H-SCs-Exos treatment. β-actin was used as the reference protein (n = 5 rats/group). (J). GLUT1, HK2, PFKFB3, LDHA, and PDH-E1α protein expression in injured sciatic nerve segments after N-/H-SCs-Exos treatment. β-actin was used as the reference protein (n = 5 rats/group). (K). Pyruvate production, (L). lactate production, and (M). acetyl-coA production of HUVECs after N-/H-SCs-Exos treatment (n = 8 rats/group). (NP). Representative immunofluorescent staining of intraneural ECs (CD31+, green), LDHA (red), and nuclei (DAPI, blue) to evaluate glycolysis changes of entire injured sciatic nerve site and intraneural ECs after N-/H-SCs-Exos treatment (scale bar = 50 μm, n = 5 rats/group). (QS). Representative immunofluorescent staining of intraneural ECs (CD31+, green), PDH-E1α (red), and nuclei (DAPI, blue) to evaluate changes in pyruvate production and mitochondrial tricarboxylic acid cycle (TCA) metabolism at entire injured sciatic nerve site and intraneural ECs after N-/H-SCs-Exos treatment (scale bar = 50 μm, n = 5 rats/group). *P < 0.05, **P < 0.01, ***P < 0.001. Bars represent group means ± SD. A Student’s t test was used for comparisons. HUVECs: Human umbilical vein endothelial cells; GLUT1: Glucose transport 1; PFKFB3: 6-phosphofructo-2-kinase/fructose-2,6-bisphosphatase 3; HK2: Hexokinase 2; LDHA: Lactate dehydrogenase A; PDH-E1α: Pyruvate dehydrogenase E1 alpha 1; ECAR: Extracellular acidification rate; OCR: Oxygen consumption rate
Fig. 4
Fig. 4
H-SCs-Exos increase glycolysis of ECs through transferring miR-21-5p in vitro. (A). qRT-PCR assay for expression of miR-21-5p in H-SCs-Exos after treatment with PBS (control), anti-NC, or anti-miR-21-5p (n = 5 rats/group). (B). HUVEC ECAR assay for evaluating cellular glycolytic level (n = 6 rats/group). (C). HUVEC OCR assay for evaluating cellular mitochondrial respiration (n = 6 rats/group). (D). ECAR/OCR ratio calculation for further analysis (n = 6 rats/group). (E). Pyruvate production, (F). lactate production, and (G). acetyl-coA production of HUVECs after N-/H-SCs-Exos treatment (n = 8/group). (H–L). Western blot showing protein expression of HK2, PFKFB3, LDHA, and PDH-E1α in HUVECs after PBS, H-SCs-Exosanti−NC, or H-SCs-Exosanti−miR−21−5p treatment. β-actin was used as the reference protein (n = 3 rats/group). *P < 0.05, **P < 0.01, ***P < 0.001. Bars represent group means ± SD. A Student’s t test was used for comparisons. HUVECs: Human umbilical vein endothelial cells; PFKFB3: 6-phosphofructo-2-kinase/fructose-2,6-bisphosphatase 3; HK2: Hexokinase 2; LDHA: Lactate dehydrogenase A; PDH-E1α: Pyruvate dehydrogenase E1 alpha 1; ECAR: Extracellular acidification rate; OCR: Oxygen consumption rate
Fig. 5
Fig. 5
H-SCs-Exos regulate EC energy metabolism programming through transferring miR-21-5p in vivo. (A). Pyruvate production, (B). lactate production, and (C). acetyl-coA production at injured sciatic nerve sites after saline (control), H-SCs-Exosanti−NC, or H-SCs-Exosanti−miR−21−5p treatment (n = 8 rats/group). (D–F). Representative immunofluorescent staining of intraneural ECs (CD31+, green), LDHA (red), and nuclei (DAPI, blue) to evaluate glycolytic metabolism of entire injured sciatic nerve and intraneural ECs (scale bar = 50 μm, n = 5 rats/group). (G-I). Representative immunofluorescent staining of intraneural ECs (CD31+, green), PDH-E1α (red), and nuclei (DAPI, blue) to evaluate pyruvate production and mitochondrial tricarboxylic acid cycle metabolism of entire injured sciatic nerve and intraneural ECs (scale bar = 50 μm, n = 5 rats/group). (J). CD31 + vascular endothelial cell (EC) counts in D and G. (K–M). Representative immunofluorescent staining of neurofilaments (NF-200, green), myeline (MBP, red), and nuclei (DAPI, blue) to evaluate post-injury nerve regeneration (scale bar = 50 μm, n = 5 rats/group. (N). Representative footprints of rats with saline, H-SCs-Exosanti−NC, or H-SCs-Exosanti−miR−21−5p administration after 8 weeks of sciatic nerve crush injury. The left image shows the control group and the right image sham or operative group. (O). Sciatic functional index calculation to evaluate functional recovery from week 1 to 8 after sciatic nerve injury (n = 5 rats/group). *P < 0.05, **P < 0.01, ***P < 0.001. Bars represent group means ± SD. A Student’s t test was used for comparisons. NF-200: Neurofilament-200; MBP: Myelin basic protein; TEM: Transmission electron microscope; NTA: Nanosight tracking analysis; ECAR: Extracellular acidification rate; OCR: Oxygen consumption rate; LDHA: Lactate dehydrogenase A; PDH-E1α: Pyruvate dehydrogenase E1 alpha
Fig. 6
Fig. 6
H-SCs-Exos-derived miR-21-5p stabilizes HIF-1α to enhance endothelial glycolysis-mediated intraneural revascularization. (A). qRT-PCR assay for expression of HIF-1α mRNA at injured sciatic nerve sites after inhibiting exosomal shuttle with GW4869 administration (n = 3 rats/group). (B). Western blot assay for HIF-1α protein expression after GW4869 administration (n = 3 rats/group). (C, D). HIF-1α mRNA and protein expression at injured sciatic nerve sites after saline, H-SCs-Exosanti−NC, or H-SCs-Exosanti−miR−21−5p administration (n = 3 rats/group). (E, F). HIF-1α mRNA and protein expression of HUVECs after PBS, H-SCs-Exosanti−NC, or H-SCs-Exosanti−miR−21−5p administration (n = 3 rats/group. (G, H). Representative immunohistochemical staining of CD31 (brown) for evaluating intraneural revascularization after miR-21-5p mimic and PX-478 treatment (DAPI, blue; n = 5 rats/group). (I–K). Pyruvate, lactate, and acetyl-CoA production at injured sciatic nerve sites after miR-21-5p mimic and PX-478 administration (n = 8 rats/group). *P < 0.05, **P < 0.01, ***P < 0.001. Bars represent group means ± SD. A Student’s t test was for comparisons. LDHA: Lactate dehydrogenase A; PDH-E1α: Pyruvate dehydrogenase E1 alpha
Fig. 7
Fig. 7
H-SCs-Exos-derived miR-21-5p targets VHL, increasing HIF-1α stabilization to directly or indirectly enhance endothelial glycolysis. (A, B). VHL mRNA and protein expression at injured sciatic nerve sites after saline (control), H-SCs-Exosanti−NC, or H-SCs-Exosanti−miR−21−5p administration (n = 3 rats/group). (C, D). VHL mRNA expression and protein expression in HUVECs after PBS (control), H-SCs-Exosanti−NC, or H-SCs-Exosanti−miR−21−5p administration (n = 3 rats/group). (E). Predicted potential binding sites for miR-21-5p on 3’-UTR of PDH-E1α. (F). Dual luciferase activity of HUVECs transfected with VHL-3’UTR luciferase constructs with miR-21-5p mimic or negative control (n = 3 rats/group). (G). Dual luciferase activity of HUVECs transfected with VHL-3’UTR luciferase constructs with saline (control), H-SCs-Exosanti−NC, or H-SCs-Exosanti−miR−21−5p (n = 3 rats/group). (H–J). Pyruvate, lactate, and acetyl-CoA production of HUVECs transfected with si-NC or si-VHL and with or without PX-478 (n = 6 rats/group). (K). HUVEC ECAR assay for evaluating cellular glycolytic level (n = 6 rats/group). (L). HUVEC OCR assay for evaluating cellular mitochondrial respiration (n = 6 rats/group). (M). ECAR/OCR ratio calculation for further analysis. (N, O). PDK1 mRNA and protein expression of post-injury sciatic nerves with or without GW4869 administration (n = 3 rats/group). (P, Q). PDK1 mRNA expression in vivo and vitro after treatment with saline or PBS (control), H-SCs-Exos, H-SCs-Exosanti−NC, or H-SCs-Exosanti−miR−21−5p (n = 3 rats/group). (R, S). PDK1 protein expression in vivo and in vitro after treatment with saline or PBS (control), H-SCs-Exos, H-SCs-Exosanti−NC, or H-SCs-Exosanti−miR−21−5p (n = 3 rats/group). (T–V). mRNA and protein expression of PDK1 and PDH-E1α in HUVECs with or without miR-21-5p mimic and si-HIF-1α transfection (n = 3 rats/group). *P < 0.05, **P < 0.01, ***P < 0.001. Bars represent group means ± SD. A Student’s t test was used for comparisons. HUVECs: Human umbilical vein endothelial cells; VHL: von Hippel-Lindau; ECAR: Extracellular acidification rate; OCR: Oxygen consumption rate; LDHA: Lactate dehydrogenase A; PDH-E1α: Pyruvate dehydrogenase E1 alpha; PDK1: Pyruvate dehydrogenase kinase 1
Fig. 8
Fig. 8
miR-21-5p targets PDH-E1α to inhibit mitochondrial respiration-related OXPHOS of HUVECs. (A). Predicted potential binding sites for miR-21-5p on 3’-UTR of PDH-E1α. (B). Dual-luciferase reporter assay confirming PDH-E1α is a target gene of miR-21-5p (n = 3 rats/group). (C). qRT-PCR assay showing PDH-E1α mRNA expression in HUVECs after transfection of miR-21-5p mimic and inhibitor (n = 3 rats/group). (D). Western blot showing PDH-E1α protein expression level after transfection of miR-21-5p mimic and inhibitor (n = 3 rats/group). (E, F). mRNA and protein expression of PDH-E1α in HUVECs after knockdown of PDH-E1α with si-PDHE1α (n = 3 rats/group). (G). ECAR, (H). OCR, and (I). ECAR/OCR ratio of HUVECs after transfection with si-PDHE1α. (JL). Pyruvate, lactate, and acetyl-CoA production of HUVECs after transfection with si-PDHE1α (n = 8 rats/group). (M). Tube-formation capacity assay of HUVECs after transfection with si-PDHE1α (n = 6 rats/group). (N). Transwell assay for invasion capacity of HUVECs after transfection with si-PDHE1α (n = 6 rats/group). (O). CCK-8 assay for proliferation capacity of HUVECs after transfection with si-PDHE1α (n = 6 rats/group). *P < 0.05, **P < 0.01, ***P < 0.001. Bars represent group means ± SD. Student’s t test was used for comparisons. HUVECs: Human umbilical vein endothelial cells; OXPHOS: Oxidative phosphorylation; ECAR: Extracellular acidification rate; OCR: Oxygen consumption rate; PDH-E1α: Pyruvate dehydrogenase E1 alpha; PDK1: Pyruvate dehydrogenase kinase 1; CCK-8: Cell counting kit-8

Similar articles

Cited by

References

    1. Douglas W. Zochodne. Neurobiology of Peripheral nerve regeneration. Cambridge University Press; 2008.
    1. Sulaiman W, Gordon T. Neurobiology of peripheral nerve injury, regeneration, and functional recovery: from bench top research to bedside application. Ochsner J. 2013;13(1):100–8. - PMC - PubMed
    1. Brecknell JE, Fawcett JW. Axonal regeneration. Biol Rev Camb Philos Soc. 1996;71(2):227–55. doi: 10.1111/j.1469-185X.1996.tb00748.x. - DOI - PubMed
    1. D’Alessandro D, Ricci C, Milazzo M, Strangis G, Forli F, Buda G et al. Piezoelectric signals in vascularized bone regeneration. Biomolecules. 2021;11(11). - PMC - PubMed
    1. Riley PR, Smart N. Vascularizing the heart. Cardiovasc Res. 2011;91(2):260–8. doi: 10.1093/cvr/cvr035. - DOI - PubMed