Review
. 2024 May 12;25(10):5266.
doi: 10.3390/ijms25105266.

Molecular, Morphological and Electrophysiological Differences between Alpha and Gamma Motoneurons with Special Reference to the Trigeminal Motor Nucleus of Rat

Affiliations
Review

Molecular, Morphological and Electrophysiological Differences between Alpha and Gamma Motoneurons with Special Reference to the Trigeminal Motor Nucleus of Rat

Youngnam Kang et al. Int J Mol Sci. .

Abstract

The muscle contraction during voluntary movement is controlled by activities of alpha- and gamma-motoneurons (αMNs and γMNs, respectively). In spite of the recent advances in research on molecular markers that can distinguish between αMNs and γMNs, electrophysiological membrane properties and firing patterns of γMNs have remained unknown, while those of αMNs have been clarified in detail. Because of the larger size of αMNs compared to γMNs, blindly or even visually recorded MNs were mostly αMNs, as demonstrated with molecular markers recently. Subsequently, the research on αMNs has made great progress in classifying their subtypes based on the molecular markers and electrophysiological membrane properties, whereas only a few studies demonstrated the electrophysiological membrane properties of γMNs. In this review article, we provide an overview of the recent advances in research on the classification of αMNs and γMNs based on molecular markers and electrophysiological membrane properties, and discuss their functional implication and significance in motor control.

Keywords: Ca2+-activated cationic channel-mediated ADP; LTS; NeuN; early outward rectification; estrogen-related receptor 3; flufenamic-acid-sensitive ADP; α-motoneuron; γ-motoneuron.


Conflict of interest statement

The authors declare no conflicts of interest.

Figures

Figure 1
Figure 1
Immunohistochemical expression of VGLUT1, Err3 and choline acetyltransferase (ChAT) in the rat TMN. (A) A confocal image shows immunohistochemical expression of VGLUT1 (pink), Err3 (red) and ChAT (green). Fluorescence signals for VGLUT1/Err3/ChAT were obtained using Alexa Fluor 649, TSA Cyanine (Cy3) and Alexa Fluor 488, respectively. Dorsolateral- and ventromedial-TMN: dl-TMN and vm-TMN, respectively. (B) Differential distribution of VGLUT1-immunreactive terminals between dl-TMN (where jaw-closing MNs are located, white interrupted line) and vm-TMN (where jaw-opening MNs are located, red interrupted line). Scale bar in (A) applies to (B). Adapted from [12].
Figure 2
Figure 2
Immunohistochemical expression of VGLUT1, Err3 and ChAT in the dorsolateral TMN MNs. (AD) Z-stack images of two successive confocal sections (1 μm apart) that were obtained by the triple immunofluorescence staining for VGLUT1 (pink), Err3 (red) and ChAT (green) ((AC), respectively). (D) shows a merged fluorescence image of (AC). Filled and open arrowheads indicate Err3-positive γMNs and Err3-negative αMNs, respectively. The three Err3-negative αMNs are larger than the two Err3-positive γMNs. Scale bar in (B) refers to (A,C,D). (E1,E2) Enlarged images of the area enclosed by a square (yellow interrupted line) in (D) at two different Z levels. The Z level difference between (E1) and (E2) is 1 μm. Arrows indicate VGLUT1-positive terminals that are in close apposition to an Err3-negative αMN. The average diameter of the Err3-negative αMN ((E1); #) is 28 μm, and that of the Err3-positive γMN ((E2); *) is 17 μm. Scale bar in (E2) refers to (E1). (F1H1,F2H2) Successive images showing immunoreactivities for Err3 and ChAT. (H1,H2) show successive merged images. The Z levels of (F1H1,F2H2) are separated by 3 μm to show the nucleoli of Err3-positive γMN and Err3-negative αMNs, respectively, for the accurate measurement of cell size. The filled and two open arrowheads indicate anErr3-positive γMN and Err3-negative αMNs, respectively. The average diameters of two Err3-negative αMNs (upper and lower open arrowheads) are 18 and 17 μm, respectively, and that of an Err3-positive γMN (a filled arrowhead) is 20 μm. Scale bar in (F2) refers to (F1,G1,G2,H1,H2). Adapted from [12].
Figure 3
Figure 3
Immunohistochemical expression of ChAT and NeuN in the dorsolateral TMN MNs. (A1C1,A2C2) Successive confocal images showing immunoreactivities for NeuN (A1,A2) and ChAT (B1,B2). (C1,C2) show merged images. The Z levels of (A1C1,A2C2) are separated by 1 μm to show the nucleoli of the NeuN-positive αMN ((C1), #) and NeuN-negative γMN ((C2), *), respectively, for the accurate measurement of cell size. Open and filled arrowheads indicate NeuN-positive αMNs and NeuN-negative γMNs, respectively. NeuN-positive αMNs appear as small as NeuN-negative γMNs. Scale bar refers to all panels. Adapted from [12].
Figure 4
Figure 4
Size distributions of αMNs and γMNs in the dorsolateral TMN of rats. (A,B) Frequency distributions of cell sizes of αMNs and γMNs, which are identified by immunoreactivities for Err3 (A) or NeuN (B). The gray columns show all MN distributions, whereas the colored columns show the distributions of αMNs (upper panel) and γMNs (lower panel). αMNs display a bimodal size distribution. The size distribution of γMNs is unimodal and almost the same as that of the smaller αMNs. The size of MNs is represented as the cross-sectional area. Err3-negative αMNs display the bimodal size distribution with the two peaks at 180–200 and 800 μm2 (upper panel in (A)). Err3-positive γMNs display the unimodal size distribution with a peak at 260 μm2 (lower panel in (A)). NeuN-positive αMNs display the bimodal size distribution with the two peaks at 260 and 680 μm2 (upper panel in (B)). NeuN-negative γMNs display the unimodal size distribution with a peak at 220 μm2 (lower panel in (B)). Modified from [12].
Figure 5
Figure 5
Immunohistochemical staining in Type I αMNs, Type II αMNs and γMNs. (A) Confocal images showing immunoreactivities for ChAT (green), NeuN (red) and biocytin (pink). Merged, a merged fluorescence image. Fluorescence signals for ChAT, NeuN and biocytin were obtained using Alexa Fluor 647, Cy3 and Alexa Fluor 488, respectively. A double filled arrowhead indicates the biocytin-labeled recorded neuron that was identified as ChAT-positive and NeuN (N+, C+) αMN. Filled arrowheads indicate ChAT-positive and NeuN (N+, C+) αMNs. Open arrowheads indicate ChAT-positive and NeuN (N+, C−) γMNs. (B) A double filled arrowhead indicates a biocytin-labeled recorded neuron that was identified as ChAT-positive and NeuN (N+, C+) αMN. Filled and open arrowheads indicate ChAT-positive with NeuN (N+, C+) αMNs and ChAT-positive with NeuN (N−, C−) γMNs, respectively. Open arrowhead with asterisk indicates a ChAT-positive and NeuN (N+, C−) γMNs. (C) A double open arrowhead indicates a biocytin-labeled recorded neuron that was identified as ChAT-positive and NeuN (N+, C−) γMN. Filled arrowheads indicate ChAT-positive and NeuN (N+, C+) αMNs. Open arrowheads indicate ChAT-positive and NeuN (N+, C−) γMNs. Modified from [11].
Figure 6
Figure 6
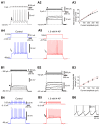
Electrophysiological properties of Type I and Type II αMNs. (A1) A spike train induced by injection of depolarizing current pulses in a type I αMN (see Figure 5A) at a resting membrane potential of –83 mV. A hyperpolarizing notch which causes a delay in the occurrence of the 1st spike (arrow). (A2) Subthreshold membrane potential responses in response to depolarizing current pulses applied at –83 mV. (A3) A relationship between the depolarizing current pulse amplitudes and the membrane potential changes measured 60 ms after the pulse onset ((A2), filled circles) and that measured 10 ms before the pulse offset ((A2), open circles), showing an early outward rectification. (A4,A5) Spike trains induced in a Type I αMN by injection of depolarizing current pulses at –80 mV before and during application of 4-AP (0.5 mM). The delay of the 1st spike ((A4), an open arrow) was almost abolished by 4-AP ((A5), an open arrow). (B1) A spike induced by injection of depolarizing current pulses in a Type II αMN (see Figure 5B) at –84 mV. An arrowhead indicates an LTS-like response (depolarized more than the level of the passive response as shown with a dotted line). (B2) Subthreshold membrane potential responses in response to depolarizing current pulses applied in the same Type II αMN at –67 mV. (B3) A relationship between the depolarizing current pulse amplitudes and the membrane potential changes measured 50 ms after the pulse onset ((B2), filled circles) and that measured 10 ms before the pulse offset ((B2), open circles), showing a less prominent early outward rectification compared to (A3). (B4,B5) Spike trains evoked by injection of depolarizing current pulses in a presumed type II αMN at –80 mV before and during application of 4-AP (1 mM). A filled arrow indicates bursts caused by LTS (B5). (B6) The enlargement of the portion of the trace enclosed by a rectangle in (B5) showing spike-ADPs or LTSs underlying spike generation (*). Modified from [11].
Figure 7
Figure 7
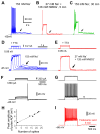
Electrophysiological properties of γMNs. (A) A spike train (spikes are truncated) induced in response to a depolarizing current pulse applied in a γMN (see Figure 5C) at –69 mV. A pulse-ADP is observed after the pulse offset (arrow). (B) Subthreshold membrane potential responses to depolarizing current pulses applied in the γMN at –84 mV. (C) A relationship between the depolarizing current pulse amplitudes and the membrane potential changes measured at 67–70 ms after the pulse onset (open circles), showing a superlinear I-V relationship of the subthreshold membrane responses in contrast to that seen in αMN. (D) The recorded neuron (AC) labeled with biocytin showing sparse arborizations of primary dendrites (see Figure 5C). (E) An injection of a depolarizing current pulse at –70 mV to a neuron induced a spike train, followed by a pulse-ADP (arrow) that caused further spikes. (F) A lucifer yellow image of the recorded neuron (E) that was electrophysiologically identified as γMN, showing sparse arborizations of primary dendrites. Modified from [11].
Figure 8
Figure 8
The pulse-ADP is mediated by Ca2+-dependent cation channels. (AE) Long-lasting pulse ADP induced in a presumed γMN. (A) In response to a current pulse injection in artificial cerebrospinal fluid (aCSF) containing 153 mM Na+, a pulse-ADP that lasted for more than 5 s (arrow) was caused. (B) Abolishment of the pulse-ADP (arrow) by substitution of 126 mM Na+ with the equimolar N-Methyl-D-glucamine (NMDG)+. (C) Restoration of the pulse-ADP (arrow) following washout of NMDG+ with the original aCSF. (D) In the presence of TTX (1 μM), amplitudes of pulse-ADPs increased (arrow) with increases in the duration or the amplitude of the depolarizing current pulse. (E) In the presence of TTX, the pulse-ADP was abolished (arrow) by substitution of 126 mM Na+ with the equimolar NMDG+. (F,G) Voltage responses to depolarizing current pulses applied in a presumed γMN at –66 mV. Note that the subthreshold membrane responses displayed a superlinear I-V relationship. (F) As the number of spikes was increased by increasing the current pulse intensities, the amplitudes of pulse-ADPs increased. Arrowheads indicate pulse-ADPs (G). (H) A linear relationship between the spike numbers and the peak amplitudes of pulse-ADP. (I) An application of 10 μM flufenamic acid abolished the pulse-ADP which was induced following a train of spikes evoked by a constant depolarizing current pulse applied in the same γMN at –66 mV. Modified from [11].

Similar articles

Cited by

References

    1. Matthews P.B.C., Bagby R.M. Mammalian muscle receptors and their central actions. Med. Sci. Sports Exerc. 1974;6:iv. doi: 10.1249/00005768-197400620-00005. - DOI
    1. Phillps C.G. Motor apparatus of the baboon’s hand. Ferrier Lect. 1969;173:141–174. - PubMed
    1. Desmedt J.E. Motor Control Mechanisms in Health and Disease. Raven Press; New York, NY, USA: 1983.
    1. Tsukiboshi T., Sato H., Tanaka Y., Saito M., Toyoda H., Morimoto T., Türker K.S., Maeda Y., Kang Y. Illusion caused by vibration of muscle spindles reveals an involvement of muscle spindle inputs in regulating isometric contraction of masseter muscles. J. Neurophysiol. 2012;108:2524–2533. doi: 10.1152/jn.00997.2011. - DOI - PubMed
    1. Vallbo B. Muscle spindle response at the onset of isometric voluntary contractions in man. Time difference between fusimotor and skeletomotor effects. J. Physiol. 1971;218:405–431. doi: 10.1113/jphysiol.1971.sp009625. - DOI - PMC - PubMed

LinkOut - more resources