. 2024 May 12;25(10):5274.
doi: 10.3390/ijms25105274.

Puerarin Modulates Hepatic Farnesoid X Receptor and Gut Microbiota in High-Fat Diet-Induced Obese Mice

Affiliations

Puerarin Modulates Hepatic Farnesoid X Receptor and Gut Microbiota in High-Fat Diet-Induced Obese Mice

Ching-Wei Yang et al. Int J Mol Sci. .

Abstract

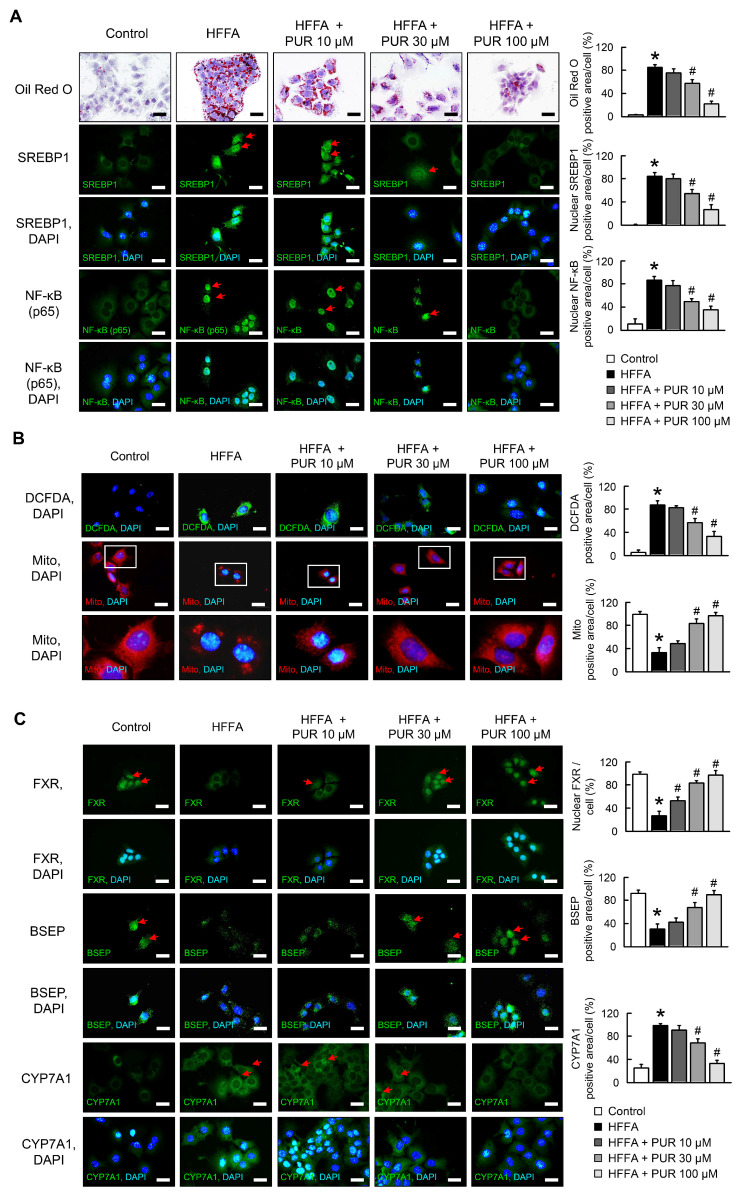
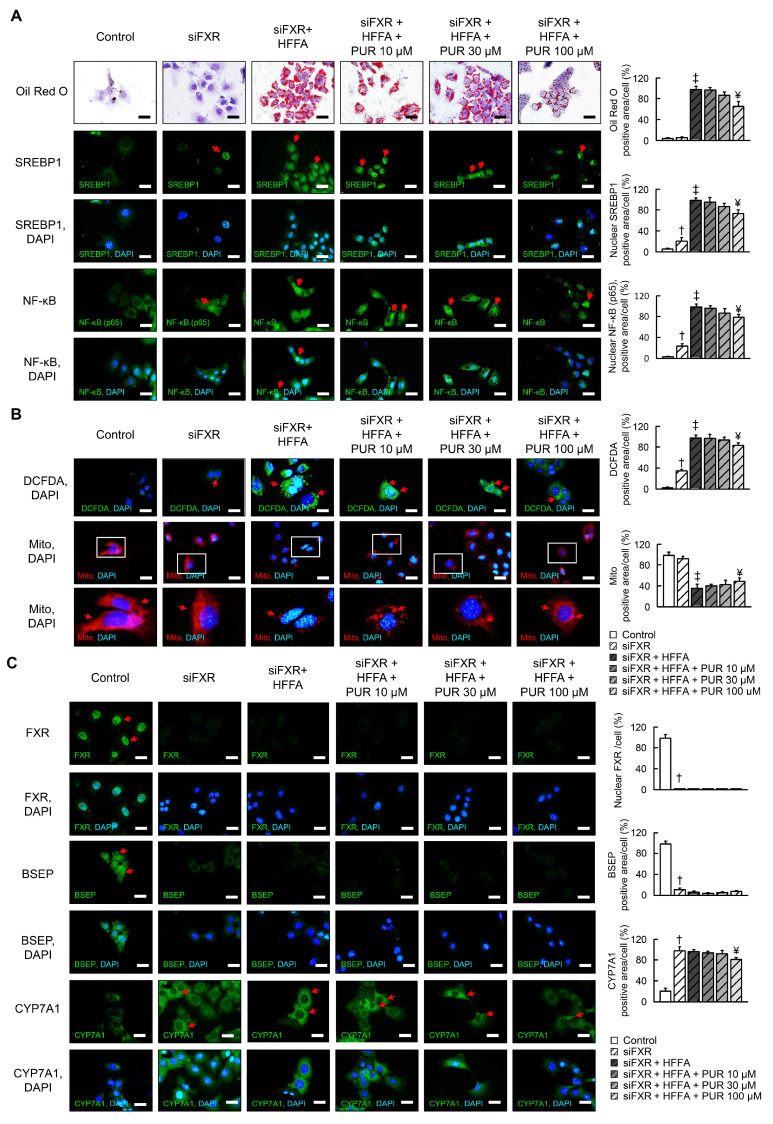
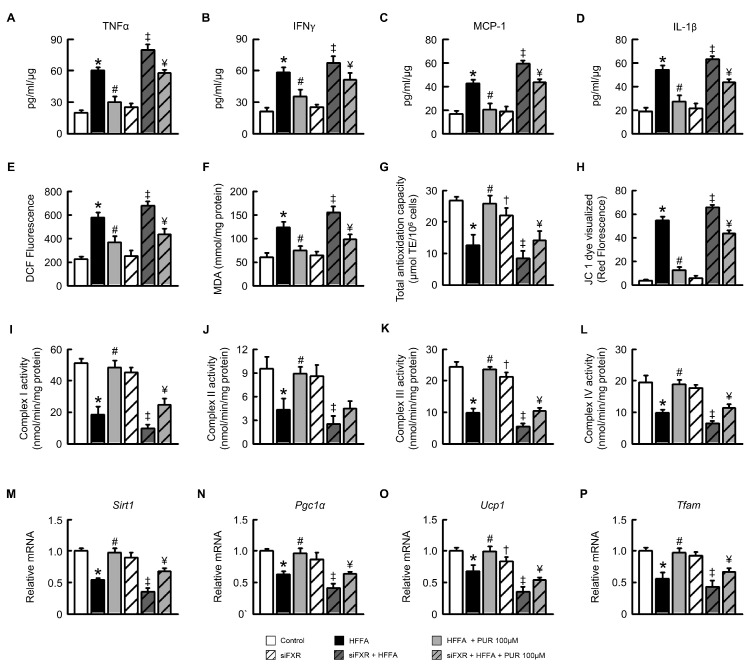
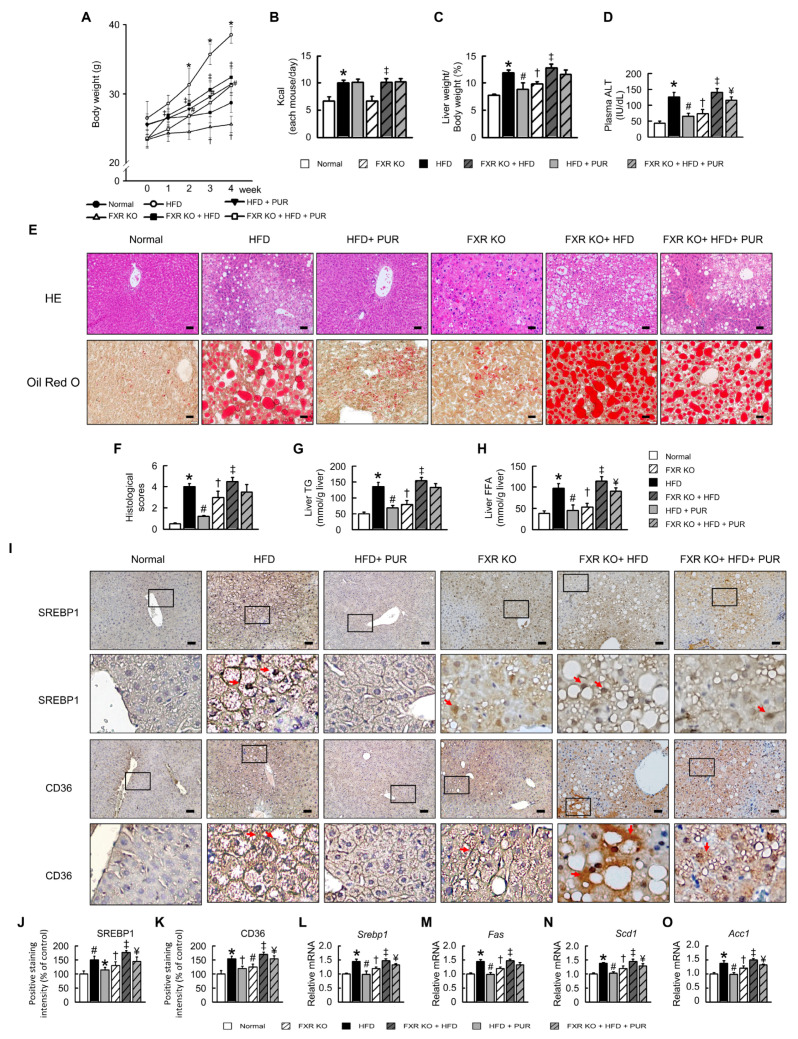
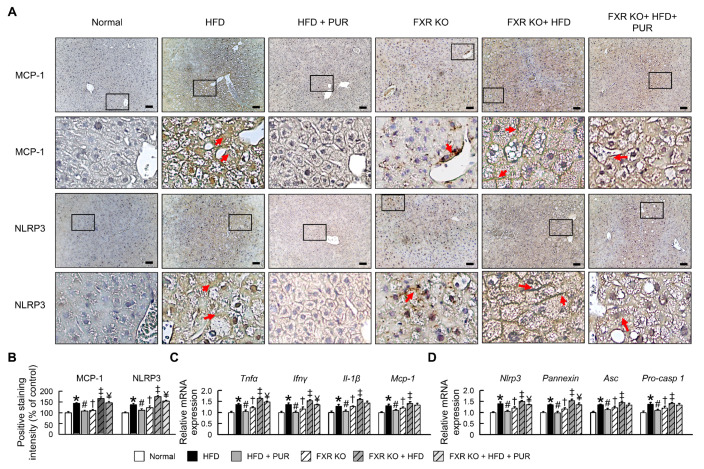
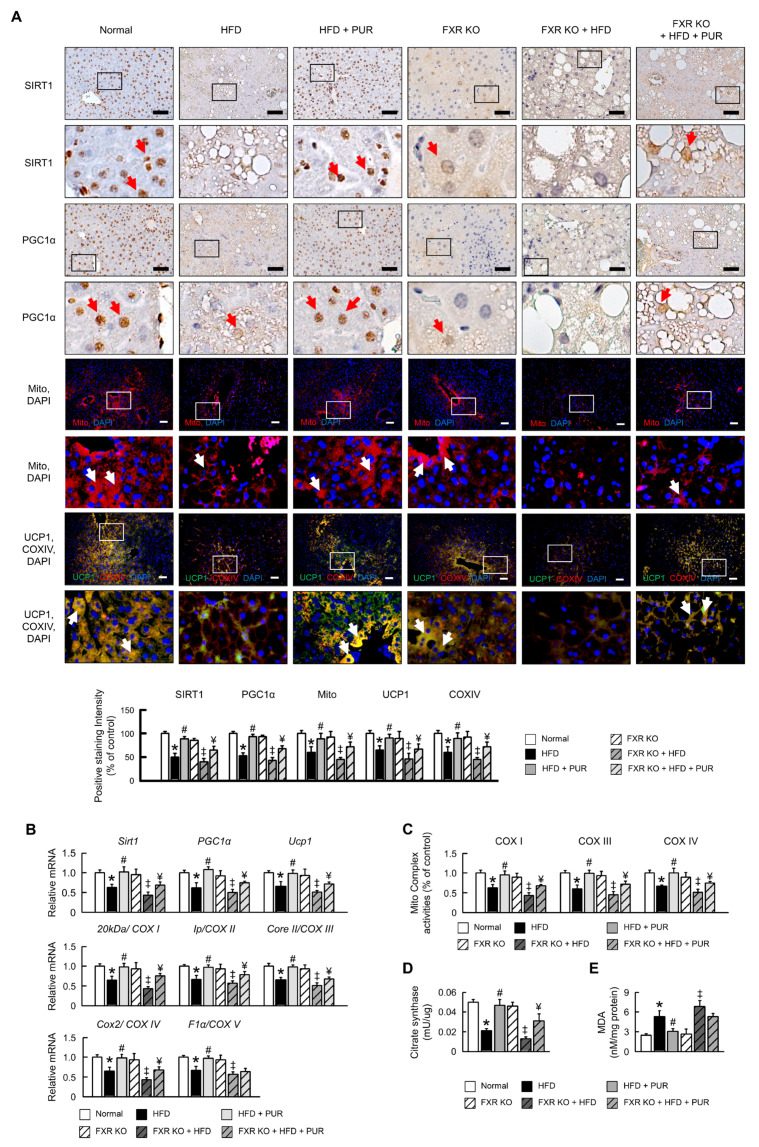
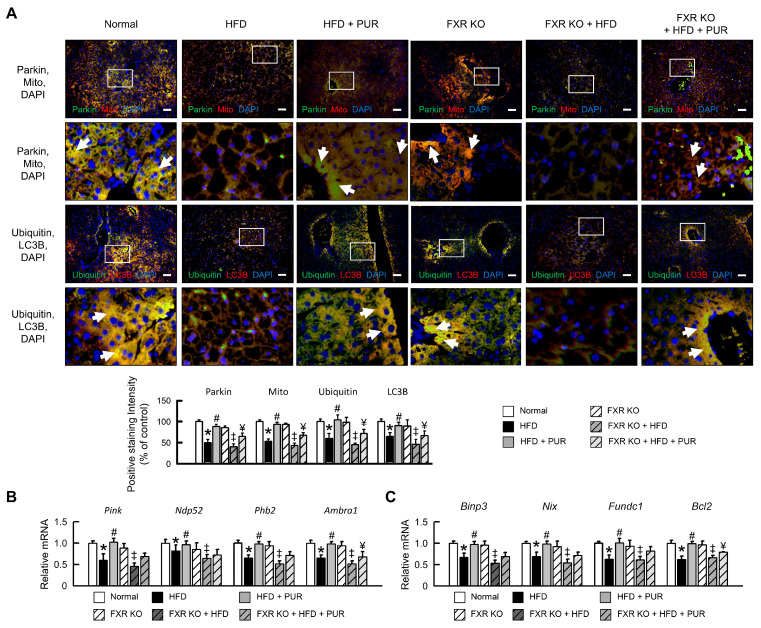
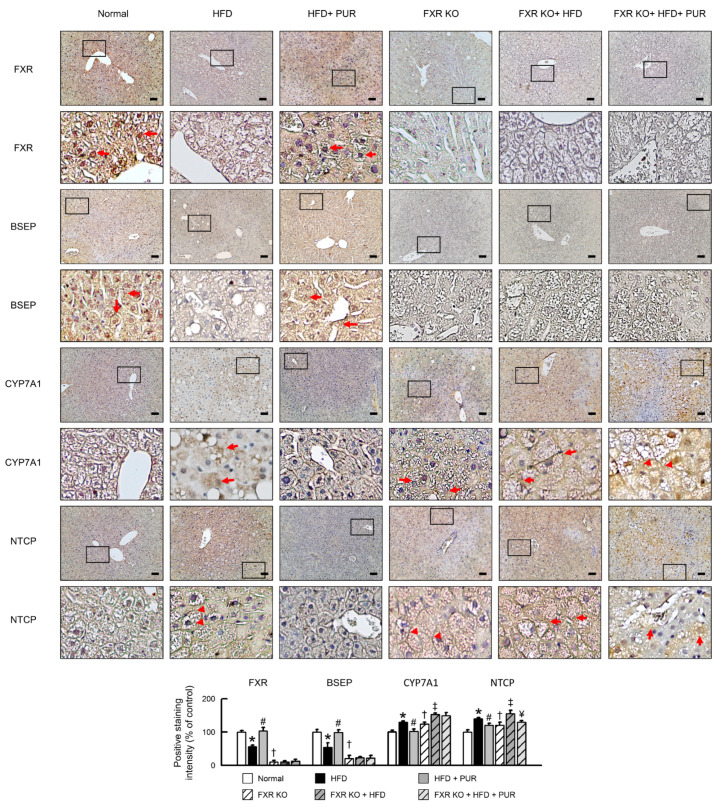
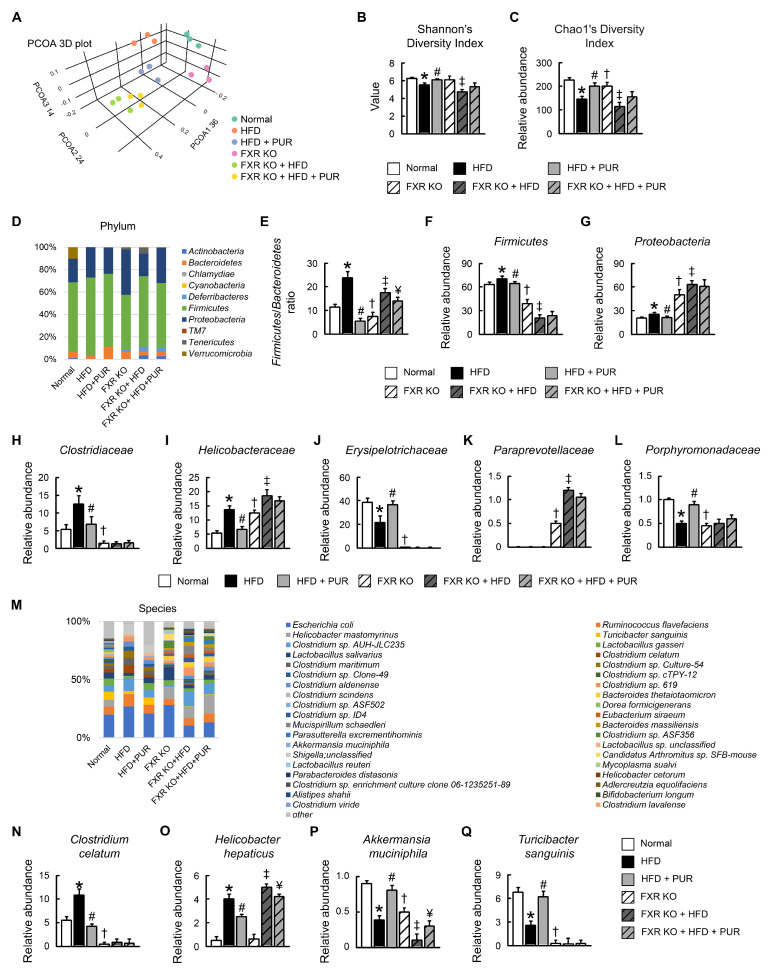
Obesity is associated with alterations in lipid metabolism and gut microbiota dysbiosis. This study investigated the effects of puerarin, a bioactive isoflavone, on lipid metabolism disorders and gut microbiota in high-fat diet (HFD)-induced obese mice. Supplementation with puerarin reduced plasma alanine aminotransferase, liver triglyceride, liver free fatty acid (FFA), and improved gut microbiota dysbiosis in obese mice. Puerarin's beneficial metabolic effects were attenuated when farnesoid X receptor (FXR) was antagonized, suggesting FXR-mediated mechanisms. In hepatocytes, puerarin ameliorated high FFA-induced sterol regulatory element-binding protein (SREBP) 1 signaling, inflammation, and mitochondrial dysfunction in an FXR-dependent manner. In obese mice, puerarin reduced liver damage, regulated hepatic lipogenesis, decreased inflammation, improved mitochondrial function, and modulated mitophagy and ubiquitin-proteasome pathways, but was less effective in FXR knockout mice. Puerarin upregulated hepatic expression of FXR, bile salt export pump (BSEP), and downregulated cytochrome P450 7A1 (CYP7A1) and sodium taurocholate transporter (NTCP), indicating modulation of bile acid synthesis and transport. Puerarin also restored gut microbial diversity, the Firmicutes/Bacteroidetes ratio, and the abundance of Clostridium celatum and Akkermansia muciniphila. This study demonstrates that puerarin effectively ameliorates metabolic disturbances and gut microbiota dysbiosis in obese mice, predominantly through FXR-dependent pathways. These findings underscore puerarin's potential as a therapeutic agent for managing obesity and enhancing gut health, highlighting its dual role in improving metabolic functions and modulating microbial communities.

Keywords: farnesoid X receptor; gut microbiota; mitochondrial function; mitophagy; obese; puerarin.


Conflict of interest statement

The authors declare no conflicts of interest.

Figures

Figure 1
Figure 1
Effects of puerarin on HFFA-mediated lipid accumulation, NF-κB nuclear translocation, mitochondrial function, and FXR signaling in AML12 cells. (A) Oil-Red O (red) staining reveals intracellular lipid accumulation, and immunofluorescence indicates SREBP1 (green) and NF-κB (p65, green) levels. (B) Visualization of reactive oxygen species (ROS, green) and mitochondrial integrity. (C) Expression levels of FXR (green), BSEP (green), and CYP7A1 (green) demonstrated through immunofluorescence. Scale bars, 20 µm. Nuclei of corresponding cells visualized by DAPI staining. Red arrow highlights positive staining. The white box in the image indicates the region of positive area, which is magnified and displayed below for detailed examination. * p < 0.05, control vs. HFFA; # p < 0.05, HFFA vs. HFFA + PUR.
Figure 2
Figure 2
Impact of puerarin on cellular responses in AML12 cells treated with siFXR and HFFA. (A) Assessment of intracellular lipid inclusions and localization of SREBP1 (green) and NF-κB (p65, green) proteins using fluorescence. (B) Visualization of reactive oxygen species (ROS, green) and mitochondrial integrity. (C) Expression of FXR (green), BSEP (green), and CYP7A1 (green) indicated through immunofluorescence. Nuclei of corresponding cells visualized by DAPI (blue)staining. Scale bars, 20 µm. Red arrow highlights positive staining. The white box in the image indicates the region of positive area, which is magnified and displayed below for detailed examination. † p < 0.05, control vs. siFXR; ‡ p < 0.05, siFXR vs. siFXR + HFFA; ¥ p < 0.05, siFXR + HFFA vs. siFXR + HFFA + PUR.
Figure 3
Figure 3
Puerarin mitigates HFFA-induced inflammatory factors, ROS, and mitochondrial biogenesis and activity impairment in AML12 cells. (AD) Concentrations of pro-inflammatory cytokines TNFα, IFNγ, MCP-1, and IL-1β. (E,F) Analysis of ROS and MDA levels. (G) Assessment of anti-oxidant capacity. (H) Analysis of mitochondrial damage. (IL) Enzymatic activities of Complexes I, II, III, and IV. (MP) Expression levels of Sirt1, Pgc1α, Ucp1, and Tfam mRNA. Statistical significance denoted as follows: * p < 0.05, control vs. HFFA; # p < 0.05, HFFA vs. HFFA + PUR; † p < 0.05, control vs. siFXR; ‡ p < 0.05, siFXR vs. siFXR + HFFA; ¥ p < 0.05, siFXR+ HFFA vs. siFXR + HFFA + PUR.
Figure 4
Figure 4
Effects of puerarin on liver damage and lipid metabolism in HFD-induced obese mice. (A) Body weight (g). (B) Food intake (Kcal). (C) Liver weight/Body weight (%). (D) Plasma ALT. (E) Representative pictures of HE and Oil Red O staining of liver section. (F) Histological scores. (G) Liver TG. (H) Liver FFA. (I) Immunohistochemical staining of CD36 and SREBP-1c in liver. Red arrow highlights positive staining. Scale bars, 50 µm. Red arrow highlights positive staining. (J,K) Positive staining intensity of SREBP1 and CD36. (LO) qRT-PCR analysis of Srebp1, Fas, Scd1, and Acc1 mRNA expression in liver. Relative mRNA expression normalized to Gapdh and controls. The black box in the image indicates the region of positive area, which is magnified and displayed below for detailed examination. In all panels, results are expressed as mean ± S.E.M. of five independent experiments. * p < 0.05, normal vs. HFD; # p < 0.05, HFD vs. HFD + PUR; † p < 0.05, normal vs. FXR KO; ‡ p < 0.05, FXR KO vs. FXR KO + HFD; ¥ p < 0.05, FXR KO + HFD vs. FXR KO + HFD + PUR.
Figure 5
Figure 5
Puerarin attenuates inflammatory response in HFD-induced obese mice. (A) Protein expression levels of NLRP3 and MCP-1 in liver. Red arrow highlights positive staining. Scale bar: 50 μm. The black box in the image indicates the region of positive area, which is magnified and displayed below for detailed examination. (B) Positive staining intensity of NLRP3 and MCP-1. Red arrow highlights positive staining. Expression levels of inflammatory cytokines IL-1β, in liver. mRNA expression (C) Tnfα, Ifnγ, Il-1β, Mcp-1, (D) inflammasome-related factors Nlrp3, Pannexin, Asc, and Pro-casp 1 in liver. * p < 0.05, normal vs. HFD; # p < 0.05, HFD vs. HFD + PUR; † p < 0.05, normal vs. FXR KO; ‡ p < 0.05, FXR KO vs. FXR KO + HFD; ¥ p < 0.05, FXR KO + HFD vs. FXR KO + HFD + PUR.
Figure 6
Figure 6
Regulation of mitochondrial biogenesis by puerarin in HFD-induced obesity mice. (A) Protein expression levels of SIRT1 and PGC1α. Immunofluorescence images showing protein expression levels of mitochondria (red), mitochondrial complex IV (red), and UCP1 (green) in liver. Scale bars, 50 µm. White arrow highlights positive staining. Red and white arrow highlights positive staining. qRT-PCR analysis of (B) Sirt1, Pgc1α, Ucp1, COXI, COX II, COXVI, and COXV mRNA expression in liver. Relative mRNA expression was normalized to Gapdh and then normalized to controls. (C) Enzymatic activities of Complexes I, III, and IV. (D,E) Analysis of Citrate synthase and MDA levels. The black and white box in the image indicates the region of positive area, which is magnified and displayed below for detailed examination. In all panels, results are expressed as mean ± S.E.M. of five independent experiments * p < 0.05, normal vs. HFD; # p < 0.05, HFD vs. HFD + PUR; ‡ p < 0.05, FXR KO vs. FXR KO + HFD; ¥ p < 0.05, FXR KO + HFD vs. FXR KO + HFD + PUR.
Figure 7
Figure 7
Regulation of mitophagy by puerarin in HFD-induced obesity mice. (A) Immunofluorescence images showing protein expression levels of Parkin, mitochondria, ubiquitin, and LC3B in liver. White arrow highlights positive staining. Scale bar: 50 μm. qRT-PCR analysis of (B) Pink, Ndp52, Phb2, Ambra1, (C) Binp3, Nix, Fundc, and Bcl2 mRNA expression in liver. Relative mRNA expression normalized to Gapdh and then normalized to controls. The white box in the image indicates the region of positive area, which is magnified and displayed below for detailed examination. In all panels, results are expressed as mean ± S.E.M. of five independent experiments. * p < 0.05, normal vs. HFD; # p < 0.05, HFD vs. HFD + PUR; ‡ p < 0.05, FXR KO vs. FXR KO + HFD; ¥ p < 0.05, FXR KO + HFD vs. FXR KO + HFD + PUR.
Figure 8
Figure 8
Impact of puerarin on bile acid transport proteins and FXR signaling in obese mice. Representative FXR, BSEP, CYP7A1, and NTCP staining of liver. Scale bar: 50 μm. Red arrow highlights positive staining. Quantification of FXR, BSEP, CYP7A1, and NTCP protein levels by positive staining of liver. The black box in the image indicates the region of positive area, which is magnified and displayed below for detailed examination. In all panels, results are expressed as mean ± S.E.M. of five independent experiments. * p < 0.05, normal vs. HFD; # p < 0.05, HFD vs. HFD + PUR; † p < 0.05, normal vs. FXR KO; ‡ p < 0.05, FXR KO vs. FXR KO + HFD; ¥ p < 0.05, FXR KO + HFD vs. FXR KO + HFD + PUR.
Figure 9
Figure 9
Puerarin alters intestinal microbial composition in mice. (A) PCA plot based on abundance of bacterial gene sequences in fecal content. Axes correspond to principal component 1 (x axis) and 2 (y axis). Alpha diversity measurements of microbiota across locations. (B) Shannon and (C) Chao1′s diversity index. (D) Microbial community bar plot by phylum relative abundance (%). (E) Firmicutes/Bacteroidetes ratio. Abundance of (F) Firmicutes and (G) Proteobacteria by phylum. Abundance of (HL) Clostridiaceae, Helicobacteraceae, Erysipelotrichaceae, Paraprevotellaceae, and Porphyromonadaceae by family. (M) Microbial community bar plot by species relative abundance (%). Abundance of (N) Clostridium celatum, (O) Helicobacter hepaticus, (P) Akkermansia muciniphila, and (Q) Turicibacter sanguinis by species. In all panels, results are expressed as mean ± S.E.M. of five independent experiments. * p < 0.05, normal vs. HFD; # p < 0.05, HFD vs. HFD + PUR; † p < 0.05, normal vs. FXR KO; ‡ p < 0.05, FXR KO vs. FXR KO + HFD; ¥ p < 0.05, FXR KO + HFD vs. FXR KO + HFD + PUR.

Similar articles

Cited by

References

    1. Kahn S.E., Hull R.L., Utzschneider K.M. Mechanisms linking obesity to insulin resistance and type 2 diabetes. Nature. 2006;444:840–846. doi: 10.1038/nature05482. - DOI - PubMed
    1. Eckel R.H., Grundy S.M., Zimmet P.Z. The metabolic syndrome. Lancet. 2005;365:1415–1428. doi: 10.1016/S0140-6736(05)66378-7. - DOI - PubMed
    1. Fabbrini E., Sullivan S., Klein S. Obesity and nonalcoholic fatty liver disease: Biochemical, metabolic, and clinical implications. Hepatology. 2010;51:679–689. doi: 10.1002/hep.23280. - DOI - PMC - PubMed
    1. Segura J., Ruilope L.M. Obesity, essential hypertension and renin-angiotensin system. Public Health Nutr. 2007;10:1151–1155. doi: 10.1017/S136898000700064X. - DOI - PubMed
    1. Shimano H. SREBPs: Physiology and pathophysiology of the SREBP family. FEBS J. 2009;276:616–621. doi: 10.1111/j.1742-4658.2008.06806.x. - DOI - PubMed

MeSH terms

Substances

Supplementary concepts

LinkOut - more resources