. 2024 May 14;25(10):5330.
doi: 10.3390/ijms25105330.

CXCL8 Knockout: A Key to Resisting Pasteurella multocida Toxin-Induced Cytotoxicity

Affiliations

CXCL8 Knockout: A Key to Resisting Pasteurella multocida Toxin-Induced Cytotoxicity

Jianlin Yuan et al. Int J Mol Sci. .

Abstract

Pasteurella multocida, a zoonotic pathogen that produces a 146-kDa modular toxin (PMT), causes progressive atrophic rhinitis with severe turbinate bone degradation in pigs. However, its mechanism of cytotoxicity remains unclear. In this study, we expressed PMT, purified it in a prokaryotic expression system, and found that it killed PK15 cells. The host factor CXCL8 was significantly upregulated among the differentially expressed genes in a transcriptome sequencing analysis and qPCR verification. We constructed a CXCL8-knockout cell line with a CRISPR/Cas9 system and found that CXCL8 knockout significantly increased resistance to PMT-induced cell apoptosis. CXCL8 knockout impaired the cleavage efficiency of apoptosis-related proteins, including Caspase3, Caspase8, and PARP1, as demonstrated with Western blot. In conclusion, these findings establish that CXCL8 facilitates PMT-induced PK15 cell death, which involves apoptotic pathways; this observation documents that CXCL8 plays a key role in PMT-induced PK15 cell death.

Keywords: CXCL8; PK15 cells; Pasteurella multocida toxin; apoptosis.


Conflict of interest statement

The authors declare no conflicts of interest.

Figures

Figure 1
Figure 1
The expression and identification of PMT and PMT-C1165S. (A) The expression and purification of PMT. M, protein marker; line 1–3, recombinant His-tagged PMT expressed in Escherichia coli and purified through Ni-NTA and gel filtration columns. (B) Dialysis and concentration of PMT. M, protein marker; line 1, recombinant His-tagged PMT. (C) Western blot identification of PMT protein. M, protein marker; line 1, recombinant His-tagged PMT. (D) Cell viability assay of PK15 cells by CCK-8 after incubation with 10 and 30 μg/mL of PMT for 36 h. (E) Cell viability assay of PK15 cells by CCK-8 after incubation with 10 and 30 μg/mL of PMT-C1165S for 36 h. Data are represented as means ± S.D. n = 3. ns > 0.05, *** p < 0.001.
Figure 2
Figure 2
RNA-Seq analysis of differentially expressed genes (DEGs) in PMT treated cells. (A) Violin plot of gene expression patterns for each sample, with dotted line representing median. (B) Principal component analysis (PCA) of four WT- or PMT-treated PK15 cells samples. (C) Numbers of upregulated and downregulated DEGs of PK15 cell with PMT treatment. (D) Volcano plot showing DEGs of PK15 cell with PMT treatment. (E) Scatter plot of p value showing DEGs of PK15 cell with PMT treatment. Dots in various colors represent the top 12 genes.
Figure 3
Figure 3
Confirmation of transcriptome sequencing data by qRT-PCR. (A) The top 12 genes ranked according to the significance of differences and their log values of FC. (B) The top 12 genes were selected for qRT-PCR verification; these DEGs’ expression levels were estimated using the 2−ΔΔCT method. (C) DEGs related to immune and inflammatory responses were selected. Dots in various colors represent the top eight genes. (D) Confirmation of transcriptome sequencing data by qRT-PCR. DEGs related to immune and inflammatory responses were selected randomly for qRT-PCR analysis, and the expression levels of those DEGs were estimated with the 2−ΔΔCT method. Data are represented as means ± S.D.; n = 3. * p < 0.05; ** p < 0.01; *** p < 0.001.
Figure 4
Figure 4
Assessing the sensitivity of CXCL8 knockout cells to PMT. (A) Representative micrographs of PK-15 and CXCL8-KO cell lines after incubation with PMT (36 h, 37 °C). Scale bar, 100 μm. (B) Cell viability assay of PK15 and CXCL8-KO cells by CCK-8 after incubation with PMT. (C) LDH release of PK15 and CXCL8-KO cells was detected after incubation with PMT. (D) Cell viability assay of CXCL8-KO cells and CXCL8 complementation cells by CCK-8 after incubation with PMT. Data are represented as means ± S.D.; n = 3. ns > 0.05, * p < 0.05; ** p < 0.01; *** p < 0.001.
Figure 5
Figure 5
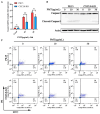
CXCL8 mediates PMT-induced apoptosis in PK15 cells. (A) The mRNA level of Caspase3 in PK15 and CXCL8-KO cells was detected with qRT-PCR after incubation with PMT. Data are represented as means ± S.D.; n = 3. ns > 0.05, ** p < 0.01. (B) Immunoblot analysis of Caspase-3-cleaved protein extracts from PK15 normal cells and CXCL8-KO cells after incubation with PMT (36 h, 37 °C). (C) Flow cytometry detection of apoptosis rate in PK15 and CXCL8-KO cells under PMT stimulation. Q1, the percentage of necrotic cells; Q2, late the percentage of apoptotic cell; Q3, early the percentage of apoptotic cell; Q4, the percentage of normal cells.
Figure 6
Figure 6
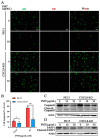
CXCL8 regulates PMT-induced apoptosis through Caspase8 pathway. (A) AO-EB detection of apoptosis in PK15 and CXCL8-KO cells after treatment with PMT (36 h, 37 °C). AO, normal cells (green); EB, apoptotic cells (red). Scale bar, 100 μm. (B) Quantification of tdata presented in (A). (C) Immunoblot analysis of Caspase-8-cleaved protein extracts from PK15 normal cells and CXCL8-KO cells after treatment with PMT (36 h, 37 °C). (D) Immunoblot analysis of PARP1-cleaved protein extracts from PK15 normal cells and CXCL8-KO cells after treatment with PMT (36 h, 37 °C). Data are represented as means ± S.D.; n = 3. ns > 0.05, ** p < 0.01.
Figure 7
Figure 7
CXCL8 resisted staurosporine-induced cell apoptosis in PK15 cells. (A) mRNA level of necroptosis-related gene MLKL in PK15 and CXCL8-KO cells was detected using qRT-PCR after incubation with PMT. (B) mRNA level of autophagy-related gene ATG5 and LC3B in PK15 and CXCL8-KO cells was detected using qRT-PCR after incubation with PMT. (C) Cell viability assay of PK15 and CXCL8-KO cells by CCK-8 after incubation with staurosporine (0.2 μM). Data are represented as means ± S.D.; n = 3. ns > 0.05, ** p < 0.01. (D) Flow cytometry detection of apoptosis rate in PK15 and CXCL8-KO cells under staurosporine (0.2 μM) stimulation. Q1, the percentage of necrotic cells; Q2, late the percentage of apoptotic cell; Q3, early the percentage of apoptotic cell; Q4, the percentage of normal cells.

References

    1. Peng Z., Wang X., Zhou R., Chen H., Wilson B.A., Wu B. Pasteurella multocida: Genotypes and Genomics. Microbiol. Mol. Biol. Rev. 2019;83:e00014-19. doi: 10.1128/mmbr.00014-19. - DOI - PMC - PubMed
    1. Christensen H., Sajid S.M., Bisgaard M., Magistrali C.F., Massacci F.R., Liman M., Menke T., Bischoff H., Olsen J.E. Prediction of Pasteurella multocida serotypes based on whole genomic sequences. Vet. Microbiol. 2022;271:109492. doi: 10.1016/j.vetmic.2022.109492. - DOI - PubMed
    1. Harper M., Boyce J.D., Adler B. Pasteurella multocida pathogenesis: 125 years after Pasteur. FEMS Microbiol. Lett. 2006;265:1–10. doi: 10.1111/j.1574-6968.2006.00442.x. - DOI - PubMed
    1. Horiguchi Y. Swine atrophic rhinitis caused by Pasteurella multocida toxin and Bordetella dermonecrotic toxin. Curr. Top. Microbiol. Immunol. 2012;361:113–129. doi: 10.1007/82_2012_206. - DOI - PubMed
    1. Okay S., Kurt Kızıldoğan A. Comparative genome analysis of five Pasteurella multocida strains to decipher the diversification in pathogenicity and host specialization. Gene. 2015;567:58–72. doi: 10.1016/j.gene.2015.04.063. - DOI - PubMed

LinkOut - more resources