

Altered Serum Proteins Suggest Inflammation, Fibrogenesis and Angiogenesis in Adult Patients with a Fontan Circulation
- PMID: 38791454
- PMCID: PMC11121818
- DOI: 10.3390/ijms25105416
Altered Serum Proteins Suggest Inflammation, Fibrogenesis and Angiogenesis in Adult Patients with a Fontan Circulation
Abstract
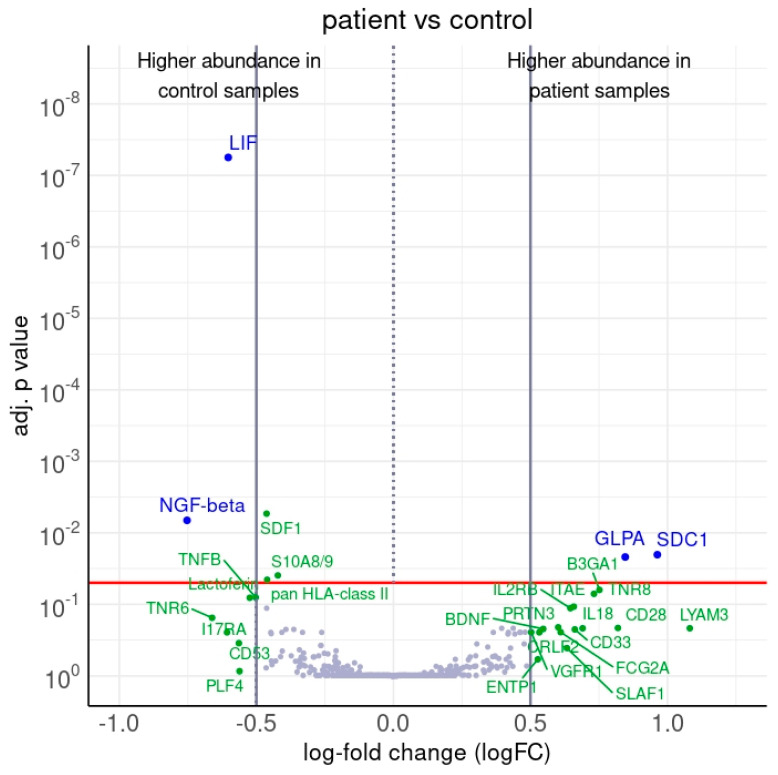
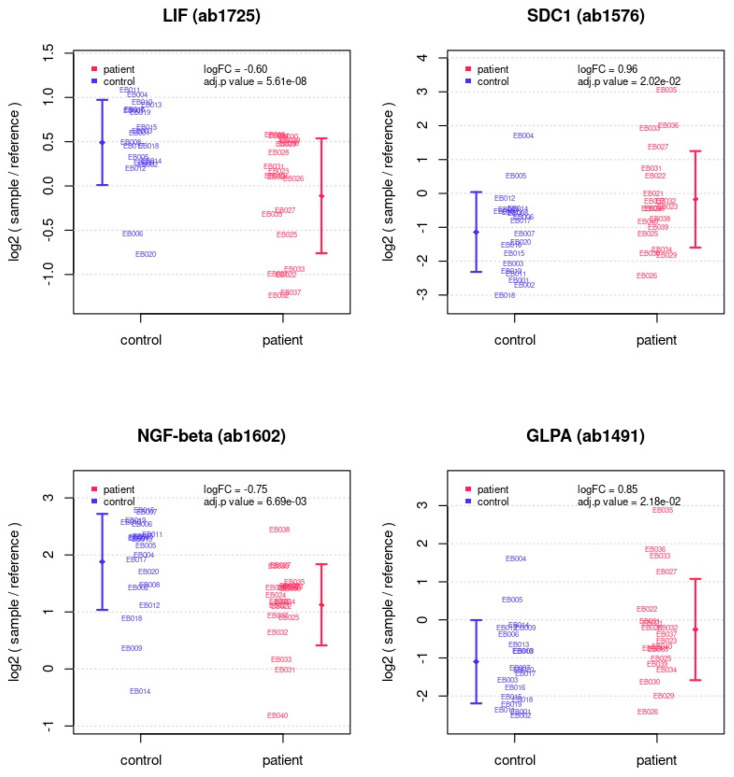
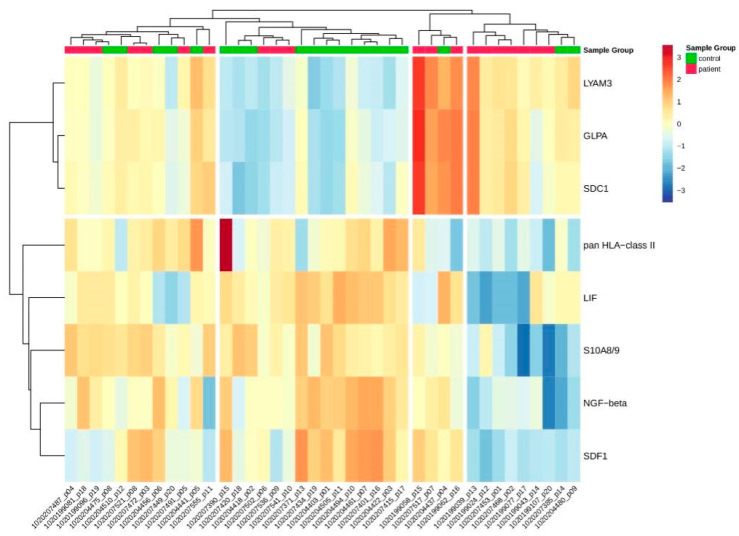
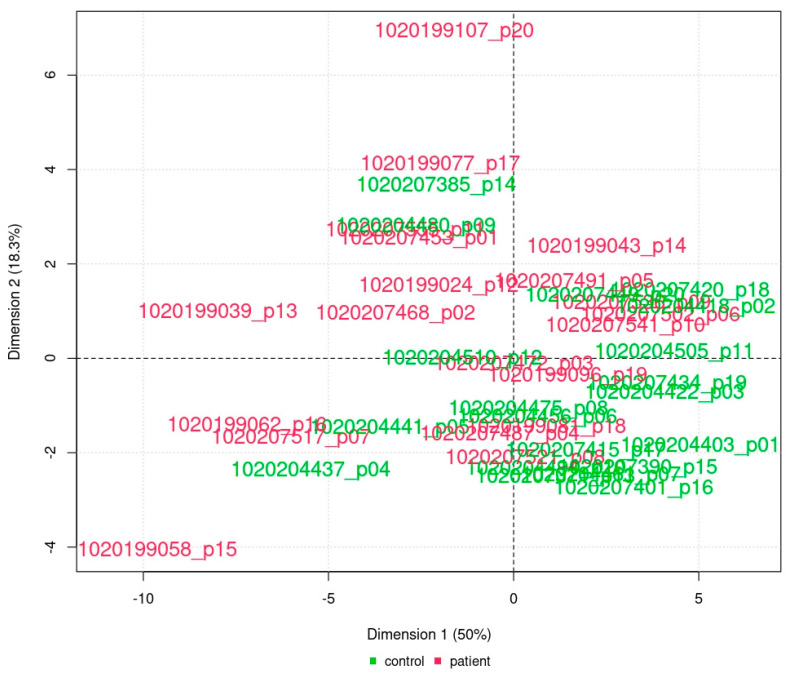
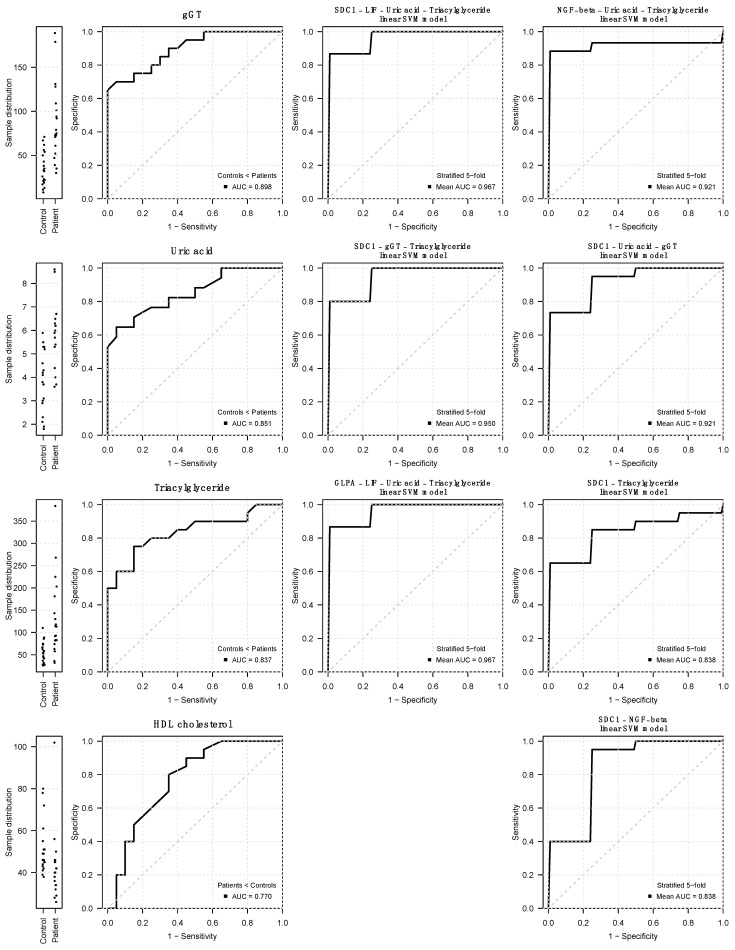
Previous omics research in patients with complex congenital heart disease and single-ventricle circulation (irrespective of the stage of palliative repair) revealed alterations in cardiac and systemic metabolism, inter alia abnormalities in energy metabolism, and inflammation, oxidative stress or endothelial dysfunction. We employed an affinity-proteomics approach focused on cell surface markers, cytokines, and chemokines in the serum of 20 adult Fontan patients with a good functioning systemic left ventricle, and we 20 matched controls to reveal any specific processes on a cellular level. Analysis of 349 proteins revealed 4 altered protein levels related to chronic inflammation, with elevated levels of syndecan-1 and glycophorin-A, as well as decreased levels of leukemia inhibitory factor and nerve growth factor-ß in Fontan patients compared to controls. All in all, this means that Fontan circulation carries specific physiological and metabolic instabilities, including chronic inflammation, oxidative stress imbalance, and consequently, possible damage to cell structure and alterations in translational pathways. A combination of proteomics-based biomarkers and the traditional biomarkers (uric acid, γGT, and cholesterol) performed best in classification (patient vs. control). A metabolism- and signaling-based approach may be helpful for a better understanding of Fontan (patho-)physiology. Syndecan-1, glycophorin-A, leukemia inhibitory factor, and nerve growth factor-ß, especially in combination with uric acid, γGT, and cholesterol, might be interesting candidate parameters to complement traditional diagnostic imaging tools and the determination of traditional biomarkers, yielding a better understanding of the development of comorbidities in Fontan patients, and they may play a future role in the identification of targets to mitigate inflammation and comorbidities in Fontan patients.
Keywords: Fontan; angiogenesis; fibrogenesis; glycophorin-A; inflammation; leukemia inhibitory factor; nerve growth factor-ß; proteomics; signaling; syndecan-1.
Conflict of interest statement
The authors declare no conflicts of interest. The funders had no role in the design of the study; in the collection, analyses, or interpretation of data; in the writing of the manuscript; or in the decision to publish the results. Author Ronny Schmidt is employed by Sciomics GmbH. The remaining authors declare that the research was conducted in the absence of any commercial or financial relationships that could be construed as a potential conflict of interest.
Figures
Similar articles
-
Systemic Changes in Adults With a Fontan Circulation: Insights From the Plasma Proteome.J Am Heart Assoc. 2025 May 20;14(10):e038648. doi: 10.1161/JAHA.124.038648. Epub 2025 May 15. J Am Heart Assoc. 2025. PMID: 40371574
-
Ventricular fibrogenesis activity assessed by serum levels of procollagen type III N-terminal amino peptide during the staged Fontan procedure.J Thorac Cardiovasc Surg. 2016 Jun;151(6):1518-26. doi: 10.1016/j.jtcvs.2016.01.020. Epub 2016 Jan 14. J Thorac Cardiovasc Surg. 2016. PMID: 26926385 Clinical Trial.
-
Targeted metabolomic analysis of serum amino acids in the adult Fontan patient with a dominant left ventricle.Sci Rep. 2020 Jun 2;10(1):8930. doi: 10.1038/s41598-020-65852-x. Sci Rep. 2020. PMID: 32488174 Free PMC article.
-
The Lymphatic System in the Fontan Patient-Pathophysiology, Imaging, and Interventions: What the Anesthesiologist Should Know.J Cardiothorac Vasc Anesth. 2022 Aug;36(8 Pt A):2669-2678. doi: 10.1053/j.jvca.2021.07.049. Epub 2021 Jul 31. J Cardiothorac Vasc Anesth. 2022. PMID: 34446325 Review.
-
Five decades of Fontan palliation: What have we learned? What should we expect?J Int Med Res. 2023 Oct;51(10):3000605231209156. doi: 10.1177/03000605231209156. J Int Med Res. 2023. PMID: 37910851 Free PMC article. Review.
Cited by
-
Correlation between Olink and SomaScan proteomics platforms in adults with a Fontan circulation.Int J Cardiol Congenit Heart Dis. 2025 Apr 15;20:100584. doi: 10.1016/j.ijcchd.2025.100584. eCollection 2025 Jun. Int J Cardiol Congenit Heart Dis. 2025. PMID: 40330320 Free PMC article.
-
One Ventricle, 3000 Proteins: Unraveling the Molecular Landscape of the Fontan Circulation.J Am Heart Assoc. 2025 May 20;14(10):e042351. doi: 10.1161/JAHA.125.042351. Epub 2025 May 15. J Am Heart Assoc. 2025. PMID: 40371572 Free PMC article. No abstract available.
-
Overcoming borders: International cooperation in re-use and re-interpretation of omics data in Fontan circulation.Int J Cardiol Congenit Heart Dis. 2025 May 5;20:100590. doi: 10.1016/j.ijcchd.2025.100590. eCollection 2025 Jun. Int J Cardiol Congenit Heart Dis. 2025. PMID: 40475704 Free PMC article. No abstract available.
-
Blood Biomarkers as a Non-Invasive Method for the Assessment of the State of the Fontan Circulation.J Clin Med. 2025 Jan 14;14(2):496. doi: 10.3390/jcm14020496. J Clin Med. 2025. PMID: 39860501 Free PMC article. Review.
References
-
- Rychik J., Atz A.M., Celermajer D.S., Deal B.J., Gatzoulis M.A., Gewillig M.H., Hsia T.-Y., Hsu D.T., Kovacs A.H., McCrindle B.W., et al. Evaluation and Management of the Child and Adult with Fontan Circulation: A Scientific Statement From the American Heart Association. Circulation. 2019;140:e234. doi: 10.1161/CIR.0000000000000696. - DOI - PubMed
-
- Choussat A., Fontan F. Pediatric Cardiology. Churchill Livingstone; Edinburgh, UK: 1977. Selection Criteria for the Fontan Procedure.
MeSH terms
Substances
Grants and funding
LinkOut - more resources
Full Text Sources
