. 2024 May 16;25(10):5417.
doi: 10.3390/ijms25105417.

Presenilin Deficiency Results in Cellular Cholesterol Accumulation by Impairment of Protein Glycosylation and NPC1 Function

Affiliations

Presenilin Deficiency Results in Cellular Cholesterol Accumulation by Impairment of Protein Glycosylation and NPC1 Function

Marietta Fabiano et al. Int J Mol Sci. .

Abstract

Presenilin proteins (PS1 and PS2) represent the catalytic subunit of γ-secretase and play a critical role in the generation of the amyloid β (Aβ) peptide and the pathogenesis of Alzheimer disease (AD). However, PS proteins also exert multiple functions beyond Aβ generation. In this study, we examine the individual roles of PS1 and PS2 in cellular cholesterol metabolism. Deletion of PS1 or PS2 in mouse models led to cholesterol accumulation in cerebral neurons. Cholesterol accumulation was also observed in the lysosomes of embryonic fibroblasts from Psen1-knockout (PS1-KO) and Psen2-KO (PS2-KO) mice and was associated with decreased expression of the Niemann-Pick type C1 (NPC1) protein involved in intracellular cholesterol transport in late endosomal/lysosomal compartments. Mass spectrometry and complementary biochemical analyses also revealed abnormal N-glycosylation of NPC1 and several other membrane proteins in PS1-KO and PS2-KO cells. Interestingly, pharmacological inhibition of N-glycosylation resulted in intracellular cholesterol accumulation prominently in lysosomes and decreased NPC1, thereby resembling the changes in PS1-KO and PS2-KO cells. In turn, treatment of PS1-KO and PS2-KO mouse embryonic fibroblasts (MEFs) with the chaperone inducer arimoclomol partially normalized NPC1 expression and rescued lysosomal cholesterol accumulation. Additionally, the intracellular cholesterol accumulation in PS1-KO and PS2-KO MEFs was prevented by overexpression of NPC1. Collectively, these data indicate that a loss of PS function results in impaired protein N-glycosylation, which eventually causes decreased expression of NPC1 and intracellular cholesterol accumulation. This mechanism could contribute to the neurodegeneration observed in PS KO mice and potentially to the pathogenesis of AD.

Keywords: N-glycosylation; NPC1; Presenilin; cholesterol; lysosome.


Conflict of interest statement

J.S. has financial interests in iNeuro Therapeutics and Paros Bio, both in the early stages of developing therapies for Alzheimer’s disease. J.S.’s interests are managed by Mass General Brigham in accordance with the institutional conflict of interest policies.

Figures

Figure 1
Figure 1
Neuronal cholesterol accumulation in PS knockout mouse brains. Representative co-immunostaining of filipin (green) with β3-tubulin (TUJ1, red) and NeuN (blue) in the cortex and CA1 region from wild-type (WT), PS1-conditional knockout (PS1cKO), and PS2KO mice. Three (PS2KO) or six brains (WT, PS1cKO) from each genotype were analyzed. At least four images per brain region were taken from each sample. An analysis of filipin intensity was performed in TUJ1/NeuN double-positive neurons (arrow heads). The original 8-bit pictures were pseudo colored to improve visualization. Scale bar: 50 µm. Graphs show the filipin intensity quantified in TUJ1/NeuN double-positive cells; one-way ANOVA with Dunnett’s correction; *** p < 0.001; **** p < 0.0001.
Figure 2
Figure 2
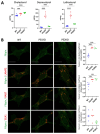
Cholesterol accumulation in PS1 and PS2 KO mouse embryonic fibroblasts. (A) Cholesterol and its precursors, desmosterol and lathosterol, are measured by mass spectrometry in mouse embryonic fibroblasts (MEFs) or wild-type (WT), PS1 (PS1KO), and PS2 KO (PS2KO). Brown-Forsythe and Welch ANOVA multiple comparison test, Dunnett correction; ***, p < 0.0005; ****, p < 0.0001. (B) Representative co-immunostaining of filipin (green) with LAMP2, RAB7, or EEA1 (red). The original 8-bit pictures were pseudo colored in green and red to better visualize colocalization. Four to six pictures per sample were taken, and the mean value of the quantified cells per picture is shown in the graph as one data point. Scale bar: 20 μm. Graphs show the Pearson’s correlation coefficient obtained from three independent preparations (N = 3); Ordinary one-way ANOVA with Dunnett’s correction; ***, p < 0.0005; ****, p < 0.0001.
Figure 3
Figure 3
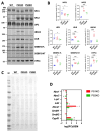
Abnormal expression of proteins involved in cholesterol metabolism in PS1 and PS2 KO mouse embryonic fibroblasts. (A) Representative western blotting of proteins involved in cellular cholesterol metabolism; and (B) relative quantification. Signal intensities were normalized to the signals of Ponceau staining (C). Values were obtained from three independent experiments with two biological replicates (N = 3). FL, full length; NT, N-terminal; M, protein molecular weight marker; A.U., arbitrary units; ordinary one-way ANOVA with Dunnett’s correction; *, p < 0.05; ***, p < 0.0005; ****, p < 0.0001. (D) Graph of differentially expressed genes in PS KO MEFs (average of 5 samples) compared to WT (average of seven samples) in mRNA sequencing analysis. The log2FC (fold change) ± SEM of the genes in PS1KO or PS2KO MEFs are shown. Adjusted p value < 0.05, binominal Wald test, followed by Benjamini-Hochberg correction.
Figure 4
Figure 4
Membrane protein glycosylation is impaired in PS1 and PS2 KO mouse embryonic fibroblasts. (A) Membrane fraction samples from MEFs WT and PS KO were exposed to PNGase or water (controls, -PNGase) and applied for western blotting to evaluate the migration of the bands after complete cleavage of the glycans. Corresponding parts are cropped from the original blots and combined in each image (Supplementary Figure S1). (B) Graph showing the amount of specific N-glycan structure measured by mass spectrometry. The results are from three independent sample preparations (N = 3). Ordinary two-way ANOVA with Dunnett’s correction. ****, p< 0.0001. (C) A graph shows differentially expressed genes in PS KO MEFs (average of 5 samples) compared to WT (average of seven samples) in mRNA sequencing analysis. The log2FC (fold change) ± SEM of the genes in PS1KO or PS2KO MEFs are shown. Adjusted p value < 0.05, binominal Wald test, followed by Benjamini-Hochberg correction. *, p< 0.05.
Figure 5
Figure 5
Cholesterol subcellular distribution upon treatments with glycosylation inhibitors in wild-type mouse embryonic fibroblasts. Representative co-immunostaining of filipin (green) with LAMP2, RAB7, or EEA1 (red) in wild-type (WT) mouse embryonic fibroblasts (MEFs) untreated (Ctr) or treated with Tunicamycin (TUN) and Deoxynojirimycin (DNJ) (A) or Kifunensin (KIF) and Swainsonine (SW) (B). Scale bar: 20 μm. Nine pictures per sample were taken, and the mean value of the quantified cells per picture is shown in the graph as one data point. The original 8-bit pictures were pseudo colored in green and red to better visualize colocalization. Graphs show the Pearson’s correlation coefficient obtained from three independent preparations (N = 3); ordinary one-way ANOVA with Dunnett’s correction; *, p < 0.05; ***, p < 0.0005.
Figure 5
Figure 5
Cholesterol subcellular distribution upon treatments with glycosylation inhibitors in wild-type mouse embryonic fibroblasts. Representative co-immunostaining of filipin (green) with LAMP2, RAB7, or EEA1 (red) in wild-type (WT) mouse embryonic fibroblasts (MEFs) untreated (Ctr) or treated with Tunicamycin (TUN) and Deoxynojirimycin (DNJ) (A) or Kifunensin (KIF) and Swainsonine (SW) (B). Scale bar: 20 μm. Nine pictures per sample were taken, and the mean value of the quantified cells per picture is shown in the graph as one data point. The original 8-bit pictures were pseudo colored in green and red to better visualize colocalization. Graphs show the Pearson’s correlation coefficient obtained from three independent preparations (N = 3); ordinary one-way ANOVA with Dunnett’s correction; *, p < 0.05; ***, p < 0.0005.
Figure 6
Figure 6
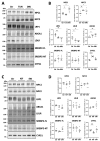
Impairment of protein glycosylation by inhibitors affects the expression of proteins involved in cellular cholesterol metabolism in wild-type mouse embryonic fibroblasts. (A) Representative western blotting of the effect of Tunicamycin (TUN) and Deoxynojirimycin (DNJ) treatments on proteins related to cholesterol metabolism in wild-type (WT) mouse embryonic fibroblasts (MEFs) and (B) relative quantification. (C) Representative western blotting showing the effect of Kifunensin (KIF) and Swainsonine (SW) treatments on proteins related to cholesterol metabolism, and (D) relative quantification. Corresponding parts are cropped from the original blots and combined in images of NPC1 and ABCA1 (Supplementary Figure S2). Signal intensities were normalized to Ponceau. Values were obtained from three independent experiments with two biological replicates (N = 3). CTR, control; AU, arbitrary units; Ordinary one-way ANOVA with Dunnett’s correction; *, p < 0.05; **, p < 0.005; ***, p < 0.0005; ****, p < 0.0001.
Figure 7
Figure 7
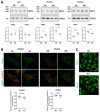
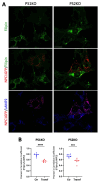
Chaperon inducer treatment increases NPC1 expression and reduces lysosomal cholesterol accumulation in PS1 and PS2 KO mouse embryonic fibroblasts. (A) Representative western blotting showing the effect of Arimoclomol maleate (Ari) treatments on protein expression in PS1 (PS1KO) and PS2 KO (PS2KO) mouse embryonic fibroblasts (MEFs). The graphs show the results of four independent experiments (N = 4). Unpaired two-tailed Student’s t test. *, p < 0.05; **, p < 0.01. (B) Representative co-immunostaining of filipin (green) with LAMP2 (red) in PS1KO and PS2KO MEFs untreated (Ctr) or treated with Ari. The original 8-bit pictures were pseudo colored in green and red to better visualize colocalization. Nine pictures per sample were taken, and the mean value of the quantified cells per picture is shown in the graph as one data point. Scale bar: 20 μm. (C) Representative filipin staining (green) of NPC1-KO Chinese hamster ovary (CHO) cells (CHO) untreated (Ctr) or treated with Ari. Scale bar: 20 μm.
Figure 8
Figure 8
NPC1 overexpression rescues the lysosomal cholesterol accumulation in PS1 and PS2 KO mouse embryonic fibroblasts. (A) Representative immunostaining of filipin (green) with the NPC1-His6-EGFP construct (red) and LAMP2 (blue) in PS1 (PS1KO) and PS2KO (PS2KO) mouse embryonic fibroblasts (MEFs). Scale bar: 20 μm. (B) Colocalization analysis of the filipin signal and LAMP2 in transfected and non-transfected (Ctr) cells. Two coverslips per condition were analyzed from three independent transfections (N = 3). Data points on graphs represent individual quantified cells. The original 8-bit pictures were pseudo colored to better visualize the visualization. Unpaired two-tailed Student’s t test. ***, p < 0.0005; ****, p < 0.0001.

References

    1. Jurisch-Yaksi N., Sannerud R., Annaert W. A Fast Growing Spectrum of Biological Functions of γ-Secretase in Development and Disease. Biochim. Biophys. Acta. 2013;1828:2815–2827. doi: 10.1016/j.bbamem.2013.04.016. - DOI - PubMed
    1. Duggan S.P., McCarthy J.V. Beyond γ-Secretase Activity: The Multifunctional Nature of Presenilins in Cell Signalling Pathways. Cell Signal. 2016;28:1–11. doi: 10.1016/j.cellsig.2015.10.006. - DOI - PubMed
    1. Oikawa N., Walter J. Presenilins and γ-Secretase in Membrane Proteostasis. Cells. 2019;8:209. doi: 10.3390/cells8030209. - DOI - PMC - PubMed
    1. De Strooper B., Saftig P., Craessaerts K., Vanderstichele H., Guhde G., Annaert W., Von Figura K., Van Leuven F. Deficiency of Presenilin-1 Inhibits the Normal Cleavage of Amyloid Precursor Protein. Nature. 1998;391:387–390. doi: 10.1038/34910. - DOI - PubMed
    1. De Strooper B., Annaert W., Cupers P., Saftig P., Craessaerts K., Mumm J.S., Schroeter E.H., Schrijvers V., Wolfe M.S., Ray W.J., et al. A Presenilin-1-Dependent Gamma-Secretase-like Protease Mediates Release of Notch Intracellular Domain. Nature. 1999;398:518–522. doi: 10.1038/19083. - DOI - PubMed