. 2024 May 16;25(10):5436.
doi: 10.3390/ijms25105436.

The Synergistic Effect of Reduced Graphene Oxide and Proteasome Inhibitor in the Induction of Apoptosis through Oxidative Stress in Breast Cancer Cell Lines

Affiliations

The Synergistic Effect of Reduced Graphene Oxide and Proteasome Inhibitor in the Induction of Apoptosis through Oxidative Stress in Breast Cancer Cell Lines

Rafał Krętowski et al. Int J Mol Sci. .

Abstract

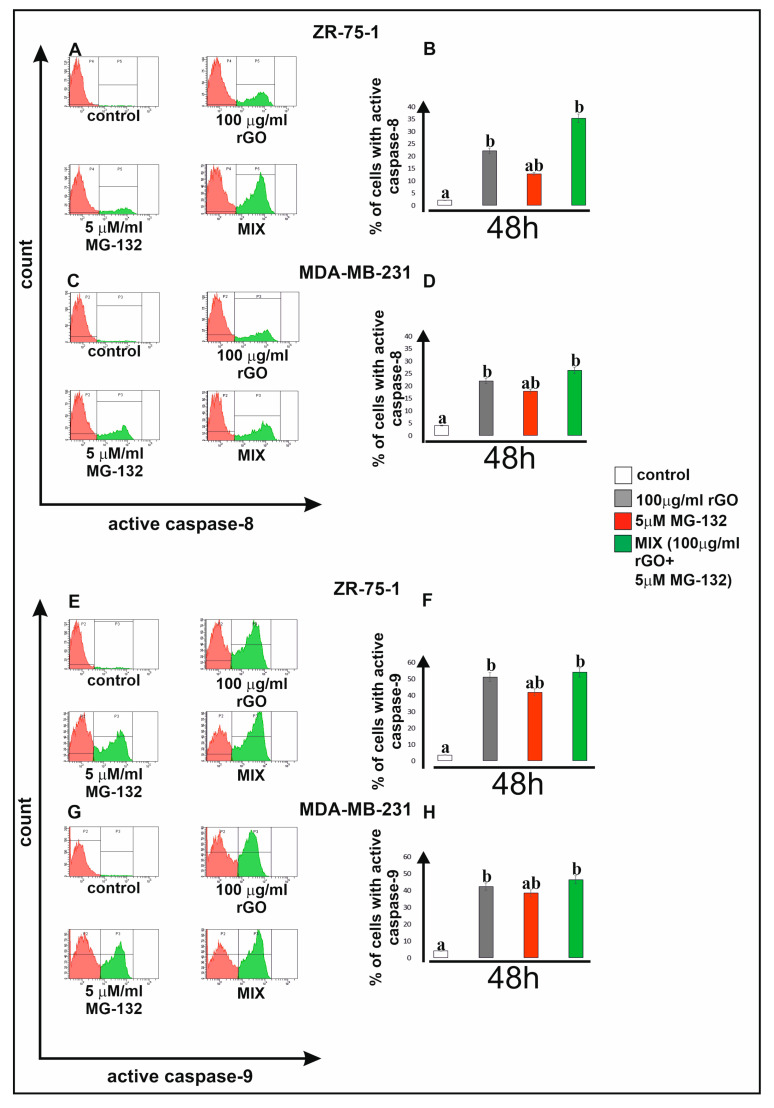
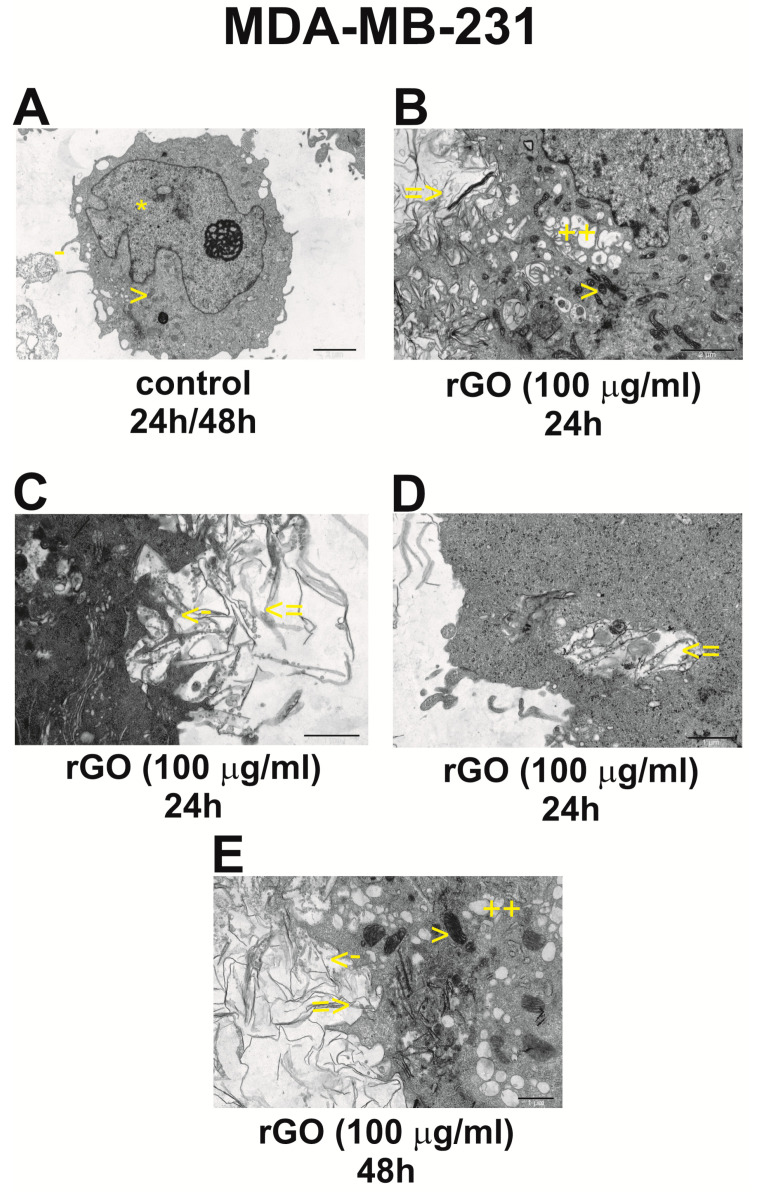
Reduced graphene oxide (rGO) and a proteasome inhibitor (MG-132) are some of the most commonly used compounds in various biomedical applications. However, the mechanisms of rGO- and MG-132-induced cytotoxicity remain unclear. The aim of this study was to investigate the anticancer effect of rGO and MG-132 against ZR-75-1 and MDA-MB-231 breast cancer cell lines. The results demonstrated that rGO, MG-132 or a mix (rGO + MG-132) induced time- and dose-dependent cytotoxicity in ZR-75-1 and MDA-MB-231 cells. Apart from that, we found that treatment with rGO and MG-132 or the mix increased apoptosis, necrosis and induction of caspase-8 and caspase-9 activity in both breast cancer cell lines. Apoptosis and caspase activation were accompanied by changes in the ultrastructure of mitochondria in ZR-75-1 and MDA-MB-231 cells incubated with rGO. Additionally, in the analyzed cells, we observed the induction of oxidative stress, accompanied by increased apoptosis and cell necrosis. In conclusion, oxidative stress induces apoptosis in the tested cells. At the same time, both mitochondrial and receptor apoptosis pathways are activated. These studies provided new information on the molecular mechanisms of apoptosis in the ZR-75-1 and MDA-MB-231 breast cancer cell lines.

Keywords: apoptosis; breast cancer; cytotoxicity; oxidative stress; proteasome inhibitor (MG-132); reduced graphene oxide (rGO).


Conflict of interest statement

The authors declare no conflicts of interest.

Figures

Figure 1
Figure 1
The effect of rGO, MG-132 and rGO with MG-132 on the release of LDH into the culture medium of ZR-75-1 (A) and MDA-MB-231 (B) cells. Cells were incubated with increasing concentrations of rGO (25 µg/mL, 100 µg/mL, 200 µg/mL) or one concentration of MG-132 (5 µM) or a mix consisting of rGO (100 µg/mL) with MG-132 (5 µM) for 3 h, 6 h, 12 h, 24 h and 48 h. Mean values from three independent experiments ± SD are presented. * p < 0.05 represents significant effects between treatments and control followed by a Dunnett’s test.
Figure 2
Figure 2
Biochemical parameters of oxidative stress induced via rGO, MG-132 or rGO with MG-132 in ZR-75-1 and MDA-MB-231 cells. Cells were incubated with rGO (100 µg/mL), MG-132 (5 µM) or a mix consisting of rGO (100 µg/mL) with MG-132 (5 µM) for 48 h. Intracellular synthesis of reactive oxygen species (ROS) in ZR-75-1 and MDA-MB-231 cells is presented in panels (A,B). Panels (C,D) show the GSH/GSSG ratio. The intracellular thiol group content is shown in panels (E,F), while panels (G,H) show the TBARS (thiobarbituric acid reactive substance) content. Mean values from three independent experiments ± SD are presented. Different letters indicate statistical differences (p ≤ 0.05) between treatments estimated by Tukey’s test.
Figure 3
Figure 3
The effect of rGO, MG-132 and the mix (rGO with MG-132) on GPx (glutathione peroxidase) activity (A,B) and SOD (superoxide dismutase) activity (C,D) in ZR-75-1 and MDA-MB-231 cells. The cells were cultured with compounds for 48 h. Mean values from three independent experiments ± SD are shown. Different letters indicate statistical differences (p ≤ 0.05) between each treatment estimated by Tukey’s test.
Figure 4
Figure 4
Effect of rGO, MG-132 or a mix consisting of rGO and MG-132 on apoptosis and necrosis of ZR-75-1 (panels AC) and MDA-MB-231 (panels DF) cells. Both breast cancer cell lines were incubated for 48 h. The percentage of apoptotic (panels A,B) and necrotic (panels D,F) cells was assessed by flow cytometry with Annexin V-FITC and propidium iodide (PI) double-staining. The sum of quadrants Q2 and Q4 represents the percentage of apoptotic cells, while quadrant Q1 represents the percentage of necrotic cells in a representative flow cytometry bar graph analysis. Mean values from three independent experiments ± SD are presented. Different letters indicate statistical differences (p ≤ 0.05) between treatments estimated by Tukey’s test.
Figure 5
Figure 5
Effects of rGO, MG-132 or a mix of rGO and MG-132 on the apoptosis and necrosis of ZR-75-1 (panel A) and MDA-MB-231 (panel B) cells assessed by fluorescence microscope. Cells were incubated in a culture medium with rGO (100 µg/mL), MG-132 (5 µM) or a mix consisting of rGO (100 µg/mL) and MG-132 (5 µM) for 48 h and stained with EB/AO. Both breast cancer cells were imaged using a fluorescence microscope at 200-fold magnification and analyzed to identify viable and apoptotic cells. We present representative images from one of three independent experiments. Scale bar: 50 µm.
Figure 6
Figure 6
Flow cytometry analysis of active caspase-8 (AD) and caspase-9 (EH) in ZR-75-1 (A,B,E,F) and MDA-MB-231 (C,D,G,H) cell lines. Cells were treated with rGO (100 μg/mL), MG-132 (5 µM) or a mix consisting of rGO (100 μg/mL) and MG-132 (5 µM) for 48 h. Panels (A,C,E,G) show representative histograms of ZR-75-1 (A,E) and MDA-MB-231 (C,G) cells stained with FAM-FLICA caspase-8 or FAM-FLICA caspase-9. Panels (B,D,F,H) show the percentage of ZR-75-1 (B,F) and MDA-MB-231 (D,H) cells with active caspase-8 or active caspase-9. Gate P2—cell populations without active caspase-8 or caspase-9; gate P3—population of cells with active caspase-8 or caspase-9. Different letters indicate statistical differences (p ≤ 0.05) between treatments estimated by Tukey’s test.
Figure 7
Figure 7
Interaction between rGO with the ZR-75-1 cells. Morphological changes in ZR-75-1 cells incubated with 100 μg/mL rGO for 24 h (AC) and 48 h (A,D). Description of the symbols in the photos: On the cell surface there are few, medium-sized projections, and a cell nucleus with scattered chromatin (*) (A). Mitochondria with a variable electron matrix (>) (A,B,D), small lipid clusters (L) and glycogen (G) are also visible (A). A cell has rGO fibrils, which bulge out to form cavities (=>), present near the surface and tiny vesicles around the fibrils (B,C). In the cytoplasm, typical for this group of cells, cytoplasmic invaginations are visible in the form of the so-called ‘pseudocyst’ (+) (B,C), mitochondria with a dense matrix and an almost tubular arrangement of cristae (>) (A,B,D) and the nucleus with slightly clumped chromatin (**) (D). (A,B) – magnification 3000x, (C) – magnification 7000×, (D) – magnification 4400×.
Figure 8
Figure 8
Interaction of rGO with MDA-MB-231 cells. Morphological changes in MDA-MB-231 cell lines incubated with 100 μg/mL rGO for 24 h (AD) and 48 h (A,E). Cell surface with depressions and protrusions (-) (A), irregularly shaped cell nucleus with scattered chromatin and a large nucleolus (*) (A). Mitochondria with a medium-electron-density matrix (>) and few RER channels are also visible (A,B,E). There is a fragment of a cell with a highly irregular surface with numerous concavities in which graphene fibers are arranged (=>) (BE). High electron density filaments are also visible within the cytoplasm (not surrounded by a membrane) (=>) (BE). There are also mitochondria with a highly thickened matrix (>) (A,B,E), and strongly dilated cisternae of the Golgi apparatus (++) are also present (B,E). Numerous small vacuoles/vesicles are arranged on the surface of the fibrils (->) (C,E). (A) – magnification 3000×, (B) – magnification 4400×, (CE) – magnification 7000×.

References

    1. Łukasiewicz S., Czeczelewski M., Forma A., Baj J., Sitarz R., Stanisławek A. Breast Cancer-Epidemiology, Risk Factors, Classification, Prognostic Markers, and Current Treatment Strategies-An Updated Review. Cancers. 2021;25:4287. doi: 10.3390/cancers13174287. - DOI - PMC - PubMed
    1. Guo N., Peng Z. MG132, a proteasome inhibitor, induces apoptosis in tumor cells. Asia Pac. J. Clin. Oncol. 2013;9:6–11. doi: 10.1111/j.1743-7563.2012.01535.x. - DOI - PubMed
    1. Han Y.H., Moon H.J., You B.R., Yang Y.M., Kim S.Z., Kim S.H., Park W.H. MG132, a proteasome inhibitor, induced death of calf pulmonary artery endothelial cells via caspase-dependent apoptosis and GSH depletion. Anticancer Res. 2010;30:879–885. - PubMed
    1. Fan W.H., Hou Y., Meng F.K., Wang X.F., Luo Y.N., Ge P.F. Proteasome inhibitor MG-132 induces C6 glioma cell apoptosis via oxidative stress. Acta Pharmacol. Sin. 2011;32:619–625. doi: 10.1038/aps.2011.16. - DOI - PMC - PubMed
    1. Lee H.K., Park S.H., Nam M.J. Proteasome inhibitor MG132 induces apoptosis in human osteosarcoma U2OS cells. Hum. Exp. Toxicol. 2021;40:1985–1997. doi: 10.1177/09603271211017972. - DOI - PubMed