. 2024 May 18;25(10):5526.
doi: 10.3390/ijms25105526.

Accumulation of Alpha-Synuclein and Increase in the Inflammatory Response in the substantia nigra, Jejunum, and Colon in a Model of O3 Pollution in Rats

Affiliations

Accumulation of Alpha-Synuclein and Increase in the Inflammatory Response in the substantia nigra, Jejunum, and Colon in a Model of O3 Pollution in Rats

Marlen Valdés-Fuentes et al. Int J Mol Sci. .

Abstract

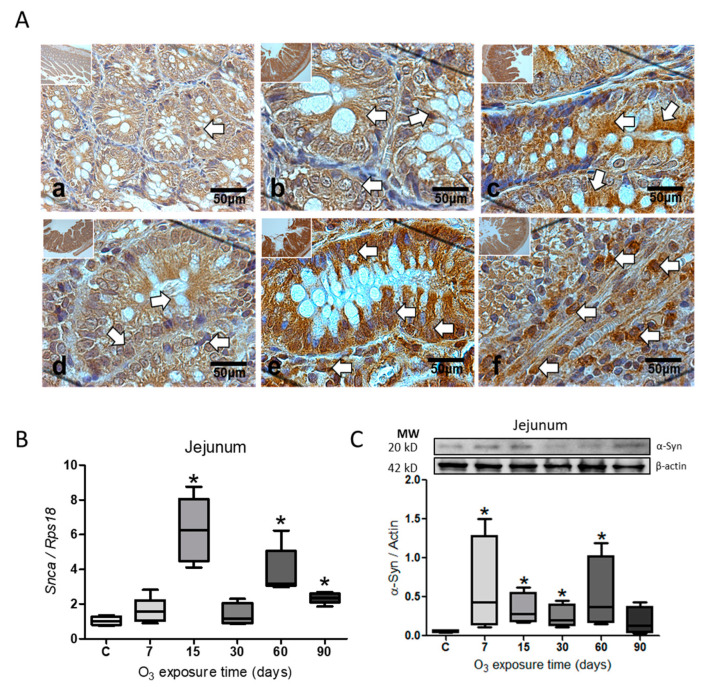
This work aimed to study the effect of repeated exposure to low doses of ozone on alpha-synuclein and the inflammatory response in the substantia nigra, jejunum, and colon. Seventy-two male Wistar rats were divided into six groups. Each group received one of the following treatments: The control group was exposed to air. The ozone groups were exposed for 7, 15, 30, 60, and 90 days for 0.25 ppm for four hours daily. Afterward, they were anesthetized, and their tissues were extracted and processed using Western blotting, immunohistochemistry, and qPCR. The results indicated a significant increase in alpha-synuclein in the substantia nigra and jejunum from 7 to 60 days of exposure and an increase in NFκB from 7 to 90 days in the substantia nigra, while in the jejunum, a significant increase was observed at 7 and 15 days and a decrease at 60 and 90 days for the colon. Interleukin IL-17 showed an increase at 90 days in the substantia nigra in the jejunum and increases at 30 days and in the colon at 15 and 90 days. Exposure to ozone increases the presence of alpha-synuclein and induces the loss of regulation of the inflammatory response, which contributes significantly to degenerative processes.

Keywords: NFκB; Th17; alpha-synuclein; gut; inflammation; neurodegeneration; ozone pollution; substantia nigra.


Conflict of interest statement

The authors declare that there are no conflicts of interest regarding the publication of this paper.

Figures

Figure 1
Figure 1
Effect of O3 exposure on α-Syn accumulation in substantia nigra. (A) Micrograph shows (a) control, (b) 7 days of O3, (c) 15 days of O3 exposure, (d) 30 days of O3 exposure, (e) 60 days of O3 exposure, and (f) 90 days of O3 exposure. Inmunohistochemistry reveals an increase in α-Syn protein after 15, 30, and 90 days of exposure to O3; the arrows indicate the immunohistochemistry reaction. (B) Gene expression increases significantly at 15, 60, and 90 days of O3 exposure. (C) The relative abundance shows a significant increase in α-Syn from 7 to 60 days compared to the control group; the images show the representative blot for Western blot band analysis. The graphs show the different treatments to Snca gene expression and the relative abundance of α-Syn, represented in arbitrary units. * = p ≤ 0.05, the asterisks represent the significant difference compared to the control group.
Figure 2
Figure 2
The effect of exposure to O3 on the accumulation of α-Syn in the jejunum. (A) Micrograph shows in (a) control, (b) 7 days of O3, (c) 15 days of O3 exposure, (d) 30 days of O3 exposure, (e) 60 days of O3 exposure, and (f) 90 days of O3 exposure. An increase in α-Syn expression is observed at 15, 30, and 90 days of exposure to O3. The arrows indicate the immunohistochemistry reaction. (B) The gene expression Snca analysis shows a significant increase in α-Syn at 15, 30, and 90 days of exposure to O3. (C). The Western blot band analysis also shows a significant increase in the relative abundance of α-Syn from 7 to 60 days compared to the control group. All data are represented in arbitrary units. The p-value for statistical significance is ≤0.05, and the asterisks represent the significant difference compared to the control group.
Figure 3
Figure 3
Effect of O3 exposure on the accumulation of α-Syn in the colon. (A) Micrograph shows in (a) control; (b) 7 days of O3; (c) 15 days of O3 exposure; (d) 30 days of O3 exposure; (e) 60 days of O3 exposure; and (f) 90 days of O3 exposure. An increase in α-Syn expression is observed after 30 and 60 days of exposure to O3; the arrows indicate the immunohistochemistry reaction. (B) The gene expression increased significantly from 15 to 90 days of exposure to O3. (C) The relative abundance did not show significant differences in the treatments; the images show the representative blot for the Western blot band analysis. The graphs show the different treatments to Snca gene expression and the relative abundance of α-Syn, represented in arbitrary units. * = p ≤ 0.05, the asterisks represent the significant difference compared to the control group.
Figure 4
Figure 4
Effect of O3 exposure on Rela expression. (A) Expression of Rela in Substantia nigra, a progressive increase from 7 days of exposure to 60 days. (B) The relative abundance showed a significant increase at 7, 15, and 30 days of exposure to O3. (C) In the jejunum, there was a significant increase at 7, 30, 60, and 90 days. (D) Relative abundance increased at 7 and 15 days and decreased at 90 days. (E) In the colon, there was an increase from 7 to 90 days. (F) The relative abundance of NFκB in the colon decreased at 60 and 90 days. The images show the representative blot for Western blot band analysis in arbitrary units. Mann–Whitney U test significance of p ≤ 0.05 (*) for all treatments, and the asterisks represent the significant difference compared to the control group.
Figure 5
Figure 5
Effect of O3 exposure on interleukin IL-17. (A) Expression of IL-17 in Substantia nigra increased at 7, 15, 60, and 90 days of exposure. (B) Relative abundance showed a significant increase after 90 days of exposure to O3. (C) There was a significant increase in the jejunum by 7 and 30 days. (D) The relative abundance in the jejunum increased after 30 days of exposure. (E). In the colon, there was an increase in expression at 7, 15, 60, and 90 days. (F) The relative abundance of IL-17 in the colon presents an increase after 15 and 90 days of exposure to O3. The images show the representative blot for Western blot band analysis in arbitrary units. Mann–Whitney U test significance of p ≤ 0.05 (*) for all treatments, and the asterisks represent the significant difference compared to the control group.

References

    1. Mumby S., Chung K.F., Adcock I.M. Transcriptional Effects of Ozone and Impact on Airway Inflammation. Front. Immunol. 2019;10:1610. doi: 10.3389/fimmu.2019.01610. - DOI - PMC - PubMed
    1. Suarez R.G., Osornio-Vargas A.R., Wine E. Ambient Air Pollution and Pediatric Inflammatory Bowel Diseases: An Updated Scoping Review. Dig. Dis. Sci. 2022;67:4342–4354. doi: 10.1007/s10620-022-07597-3. - DOI - PubMed
    1. Bello-Medina P.C., Rodríguez-Martínez E., Prado-Alcalá R.A., Rivas-Arancibia S. Ozone pollution, oxidative stress, synaptic plasticity, and neurodegeneration. Neurol. (Engl. Ed.) 2022;37:277–286. doi: 10.1016/j.nrleng.2018.10.025. - DOI - PubMed
    1. He L., He T., Farrar S., Ji L., Liu T., Ma X. Antioxidants Maintain Cellular Redox Homeostasis by Elimination of Reactive Oxygen Species. Cell. Physiol. Biochem. 2017;44:532–553. doi: 10.1159/000485089. - DOI - PubMed
    1. Ajmani G.S., Suh H.H., Pinto J.M. Effects of Ambient Air Pollution Exposure on Olfaction: A Review. Environ. Health Perspect. 2016;124:1683–1693. doi: 10.1289/ehp136. - DOI - PMC - PubMed

MeSH terms