. 2024 May 19;25(10):5537.
doi: 10.3390/ijms25105537.

Effect of Obstructive Sleep Apnea during Pregnancy on Fetal Development: Gene Expression Profile of Cord Blood

Affiliations

Effect of Obstructive Sleep Apnea during Pregnancy on Fetal Development: Gene Expression Profile of Cord Blood

Laura Cànaves-Gómez et al. Int J Mol Sci. .

Abstract

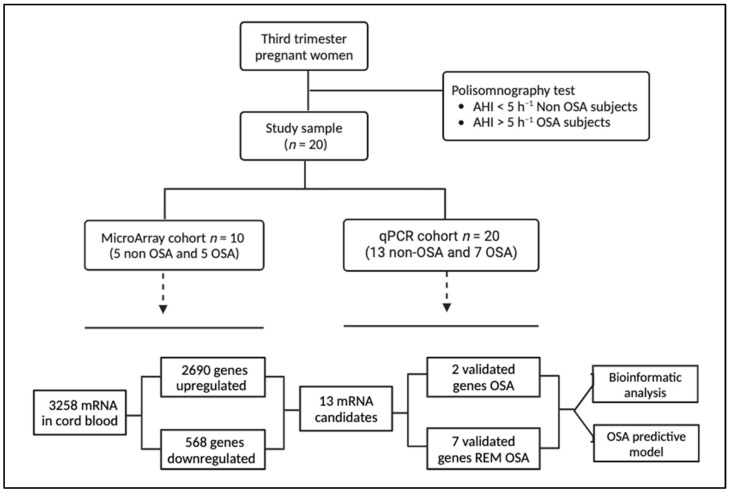
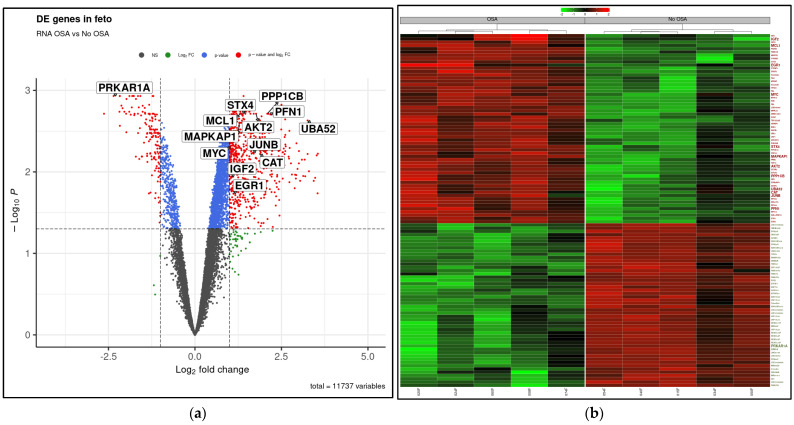
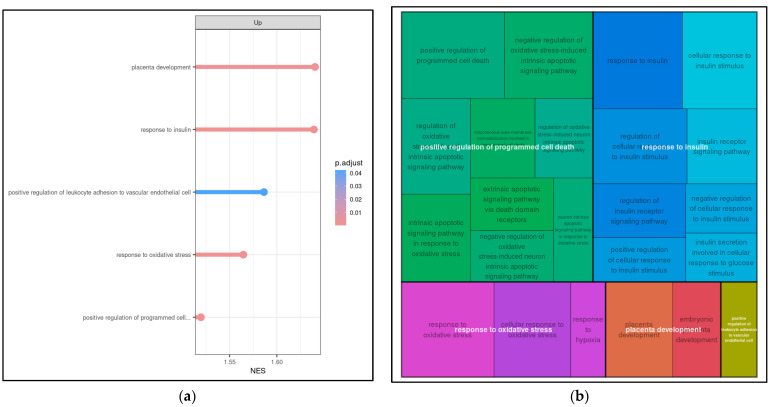
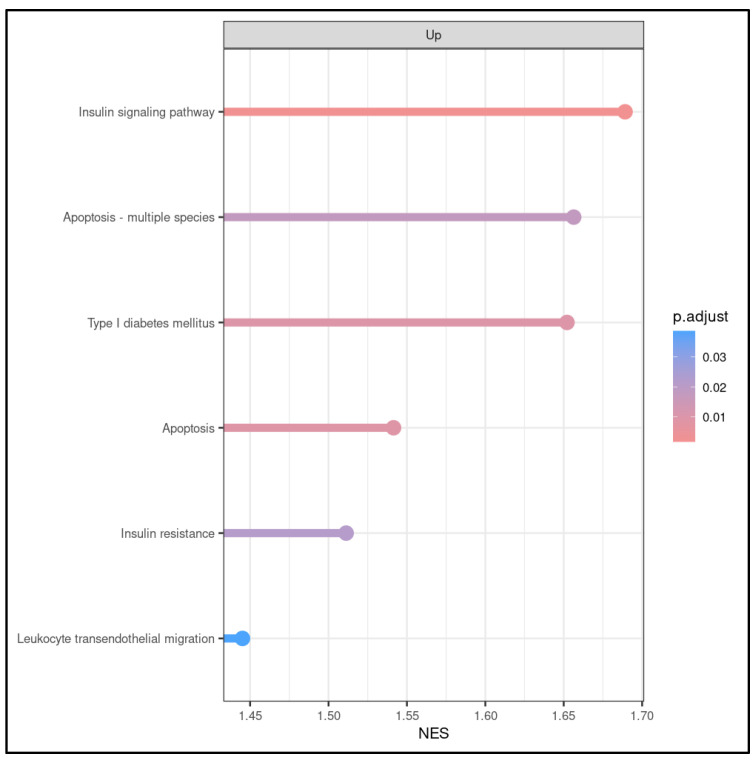
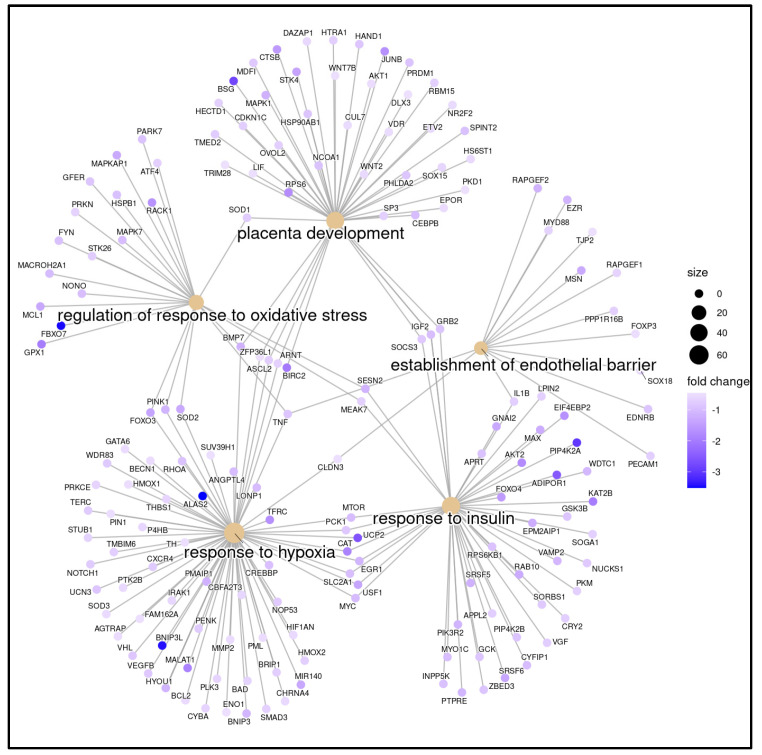
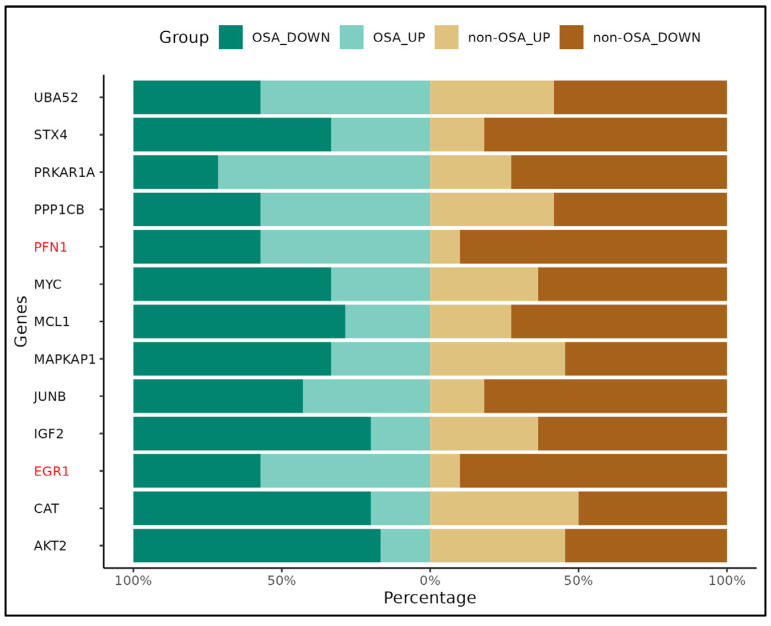
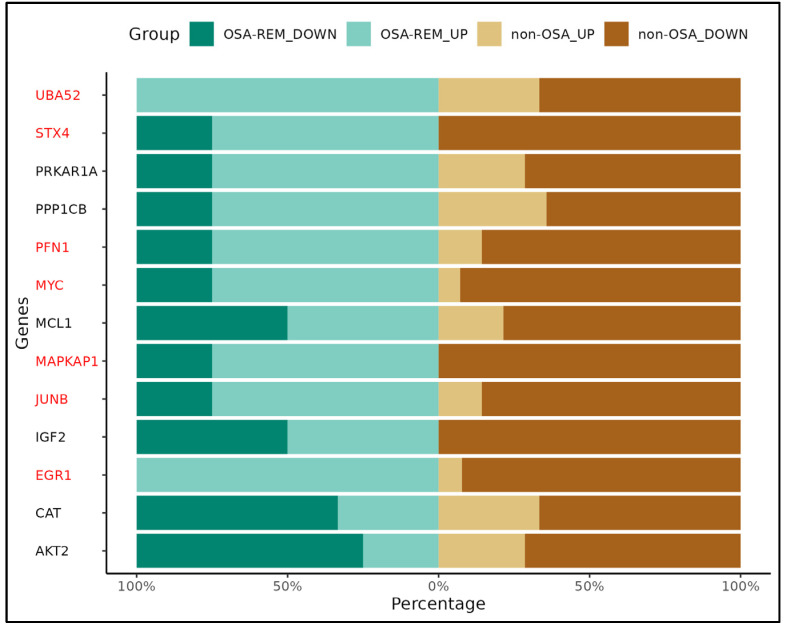
Obstructive sleep apnea (OSA) is quite prevalent during pregnancy and is associated with adverse perinatal outcomes, but its potential influence on fetal development remains unclear. This study investigated maternal OSA impact on the fetus by analyzing gene expression profiles in whole cord blood (WCB). Ten women in the third trimester of pregnancy were included, five OSA and five non-OSA cases. WCB RNA expression was analyzed by microarray technology to identify differentially expressed genes (DEGs) under OSA conditions. After data normalization, 3238 genes showed significant differential expression under OSA conditions, with 2690 upregulated genes and 548 downregulated genes. Functional enrichment was conducted using gene set enrichment analysis (GSEA) applied to Gene Ontology annotations. Key biological processes involved in OSA were identified, including response to oxidative stress and hypoxia, apoptosis, insulin response and secretion, and placental development. Moreover, DEGs were confirmed through qPCR analyses in additional WCB samples (7 with OSA and 13 without OSA). This highlighted differential expression of several genes in OSA (EGR1, PFN1 and PRKAR1A), with distinct gene expression profiles observed during rapid eye movement (REM)-OSA in pregnancy (PFN1, UBA52, EGR1, STX4, MYC, JUNB, and MAPKAP). These findings suggest that OSA, particularly during REM sleep, may negatively impact various biological processes during fetal development.

Keywords: cord blood; fetal development; gene expression; hypoxia; obstructive sleep apnea (OSA); oxidative stress; perinatal outcomes; pregnancy; qPCR; rapid eye movement (REM) sleep.


Conflict of interest statement

The authors declare no conflicts of interest.

Figures

Figure 1
Figure 1
Flowchart of the study. Pregnant women in the third trimester were recruited, and after a PSG, they were divided for the study on the basis of non-OSA and OSA and further divided into the microarray cohort and the qPCR cohort. Five non-OSA and five OSA patients were used to perform a general screening using microarrays. A total of 13 out of 3258 differentially expressed mRNAs were validated in an independent cohort by qRT-PCR.
Figure 2
Figure 2
WCB differential gene expression in OSA compared to non-OSA. (a) Volcano plot showing significance (−log10 transformed p values) and magnitude (log2(fold change)) of differential gene expression in WCB from OSA compared to non OSA with p-value ≤ 0.05 and fold change ≥ 2.0 filters. Red dots showing significant DE genes significantly for both filters. (b) Heat map illustrating magnitude of differential gene expression in WCB from OSA compared to non-OSA. Green and red color represents the top 50 of under- and overexpressed genes, respectively.
Figure 3
Figure 3
Potential biological pathways altered in WCB cells from OSA-affected mothers identified by microarray analysis. (a) Enrichment analysis of gene sets in the GO (Gene Ontology) database (GO-GSEA). For functional enrichment, “keywords” (pathologies and signaling pathways) associated with OSA were introduced. Significant positive NES (normalized enrichment scores) value indicates that members of a given gene set tend to appear at the top of the ranked transcriptome data. (b) The analysis after filtering by keywords showed 23 entries represented by the small squares, which were grouped into five main clusters: placenta development, response to insulin, response to oxidative stress, positive regulation of programmed cell death, and leukocyte adhesion to vascular endothelial cell.
Figure 4
Figure 4
KEGG (KEGG-GSEA) pathway enrichment analysis reveals dysregulated pathways in WCB cells with OSA compared to control samples. KEGG pathway analysis led to the identification of 260 significant biological processes, among which, six of them were related to apoptosis, insulin resistance and signaling pathway, leukocyte endothelial migration, and type 1 diabetes mellitus.
Figure 5
Figure 5
Potential signaling pathways triggered in WCB cells by maternal OSA. Pathway analysis indicated that five pathways corresponded to upregulated transcripts. The most enriched network was “response to oxidative stress”, comprising four target genes. The intensity of the blue color corresponds to the fold change; the higher the intensity, the higher the value. The size of the circle depends on the number of genes associated with each network.
Figure 6
Figure 6
Gene expression patterns obtained by qRT-PCR in WCB with OSA versus non-OSA. Genes are represented on the Y-axis, while the X-axis denotes the frequency of their expression. Horizontal bars are colored in green for OSA samples and brown for non-OSA samples. Genes with significant differential gene expression pattern are highlighted in red. The different shades of green or brown indicate whether genes are up- or downregulated in WCB cells affected or not affected by maternal OSA.
Figure 7
Figure 7
Gene expression patterns obtained by qRT-PCR in WCB with REM OSA versus non-REM OSA. Genes are represented on the Y-axis, while the X-axis denotes the frequency of their expression. Horizontal bars are colored in green for REM OSA samples and brown for non-REM OSA. Genes with significant differential gene expression pattern are highlighted in red. The different shades of green or brown indicate whether genes are up- or downregulated in REM OSA compared to non-REM OSA samples.

References

    1. Peppard P.E., Young T., Barnet J.H., Palta M., Hagen E.W., Hla K.M. Increased Prevalence of Sleep-Disordered Breathing in Adults. Am. J. Epidemiol. 2013;177:1006–1014. doi: 10.1093/AJE/KWS342. - DOI - PMC - PubMed
    1. Pamidi S., Kimoff R.J. Maternal Sleep-Disordered Breathing. Chest. 2018;153:1052–1066. doi: 10.1016/J.CHEST.2017.10.011. - DOI - PubMed
    1. Izci B., Riha R.L., Martin S.E., Vennelle M., Liston W.A., Dundas K.C., Calder A.A., Douglas N.J. The Upper Airway in Pregnancy and Pre-Eclampsia. Am. J. Respir. Crit. Care Med. 2003;167:137–140. doi: 10.1164/RCCM.200206-590OC. - DOI - PubMed
    1. Alonso-Fernández A., Ribot Quetglas C., Herranz Mochales A., Álvarez Ruiz De Larrinaga A., Sánchez Barón A., Rodríguez Rodríguez P., Gil Gómez A.V., Pía Martínez C., Cubero Marín J.P., Barceló Nicolau M., et al. Influence of Obstructive Sleep Apnea on Systemic Inflammation in Pregnancy. Front. Med. 2021;8:674997. doi: 10.3389/FMED.2021.674997. - DOI - PMC - PubMed
    1. Tayade S., Toshniwal S. Obstructive Sleep Apnea in Pregnancy: A Narrative Review. Cureus. 2022;14:e30387. doi: 10.7759/CUREUS.30387. - DOI - PMC - PubMed