. 2024 May 8;16(10):1796.
doi: 10.3390/cancers16101796.

Pepsinogen C Interacts with IQGAP1 to Inhibit the Metastasis of Gastric Cancer Cells by Suppressing Rho-GTPase Pathway

Affiliations

Pepsinogen C Interacts with IQGAP1 to Inhibit the Metastasis of Gastric Cancer Cells by Suppressing Rho-GTPase Pathway

Hanxi Ding et al. Cancers (Basel). .

Abstract

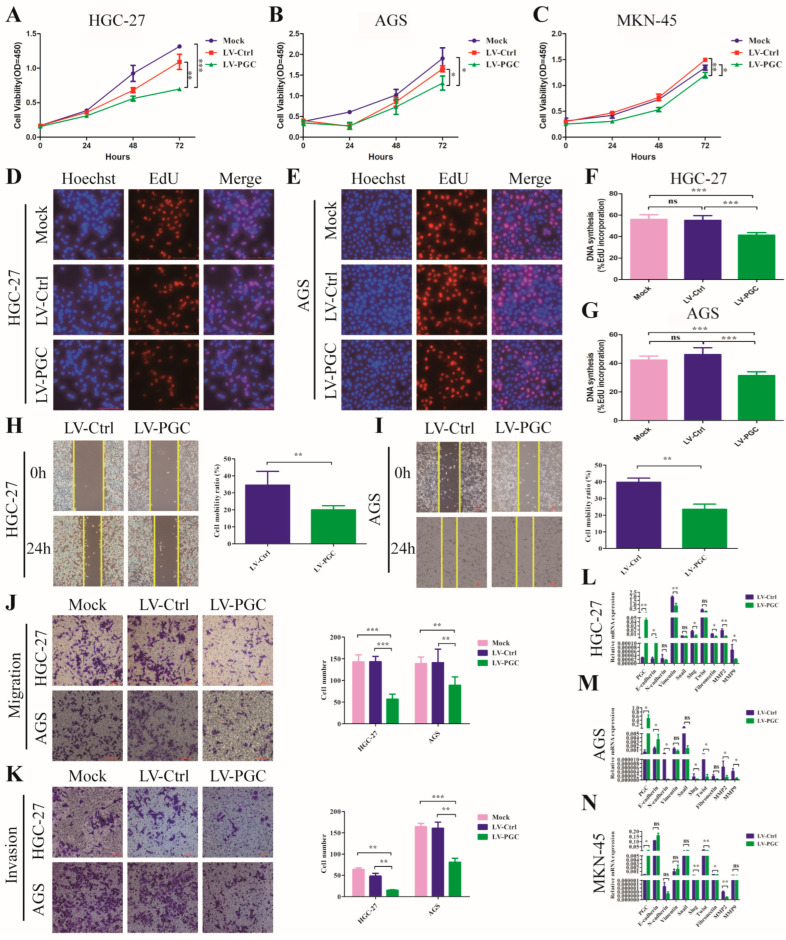
Aim: This study systematically explored the biological effects and mechanisms of PGC on gastric cancer (GC) cells in vitro and in vivo.

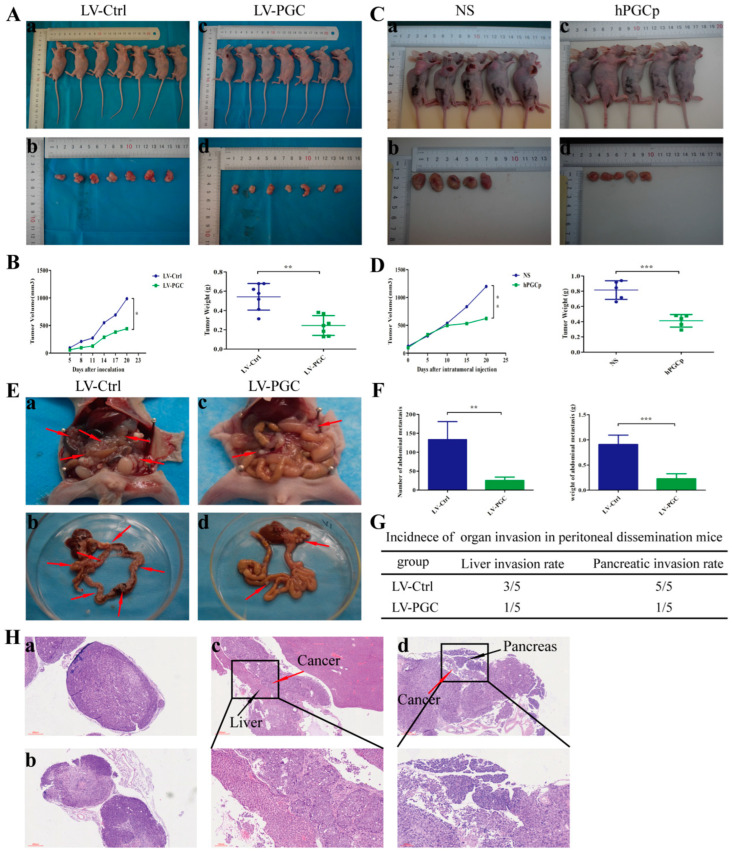
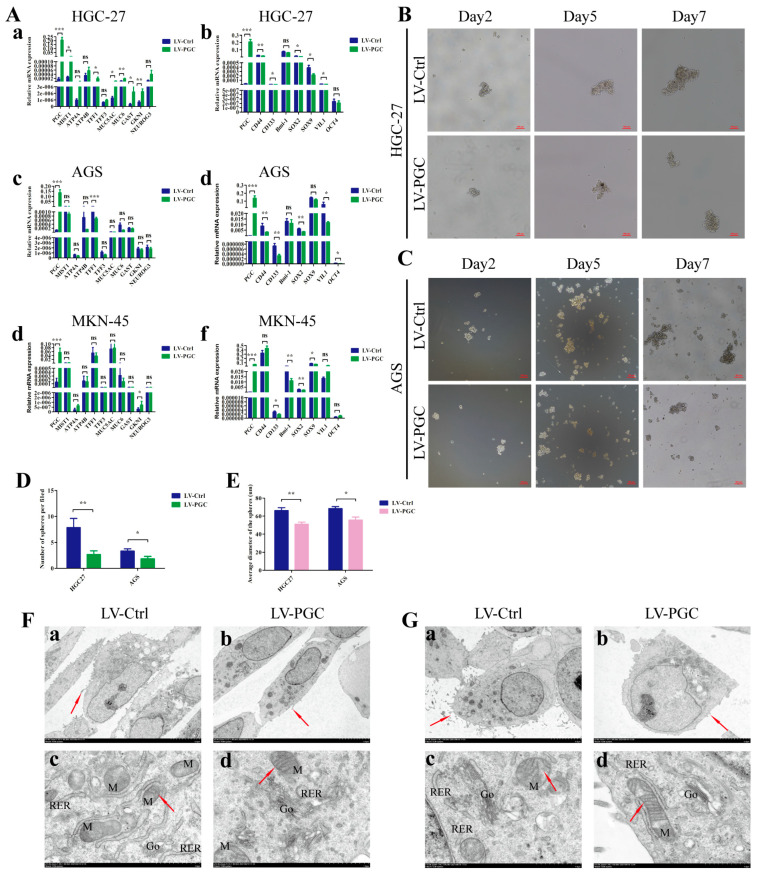
Method: The critical biological roles of PGC in GC were assessed via EdU staining, Hoechst staining, flow cytometry, mouse models, CCK-8, wound healing, transwell, and sphere-forming assays. The interaction study with IQ-domain GTPase-activating protein 1 (IQGAP1) was used by Liquid chromatography-mass spectrometry co-immunoprecipitation, immunofluorescence staining, CHX-chase assay, MG132 assay, and qRT-PCR.

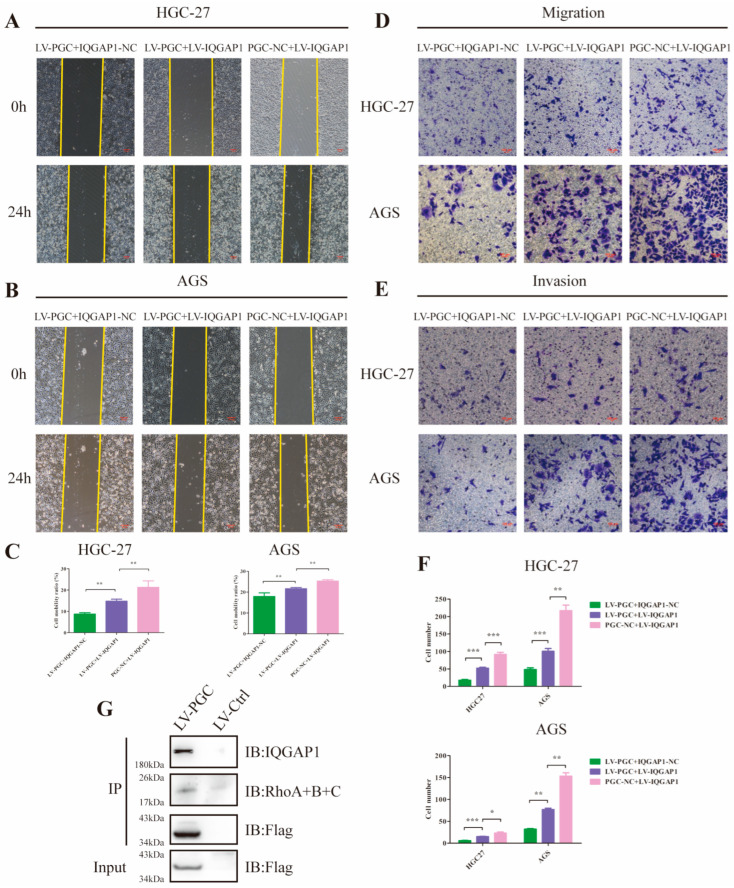
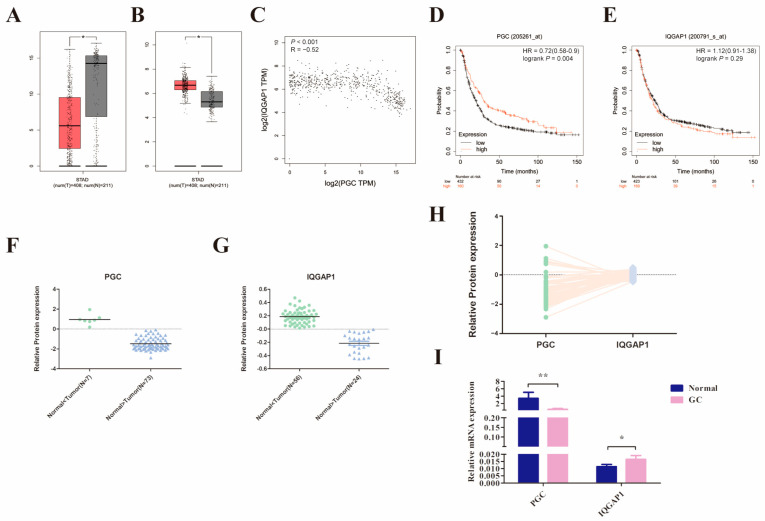
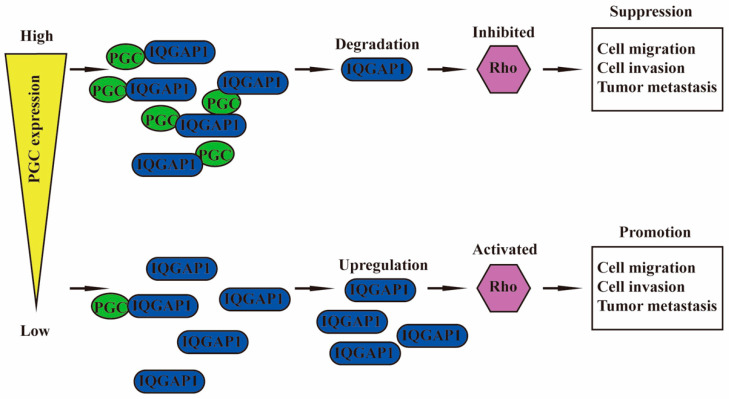
Results: PGC inhibited the proliferation, viability, epithelial-mesenchymal transition, migration, invasion, and stemness of GC cells and promoted GC cell differentiation. PGC suppressed subcutaneous tumor growth and peritoneal dissemination in vivo. The interaction study found PGC inhibits GC cell migration and invasion by downregulating IQGAP1 protein and IQGAP1-mediated Rho-GTPase signaling suppression. In addition, PGC disrupts the stability of the IQGAP1 protein, promoting its degradation and significantly shortening its half-life. Moreover, the expression levels of PGC and IQGAP1 in GC tissues were significantly negatively correlated.

Conclusion: PGC may act as a tumor suppressor in the development and metastasis of GC. PGC can downregulate its interacting protein IQGAP1 and inhibit the Rho-GTPase pathway, thereby participating in the inhibition of GC cell migration and invasion.

Keywords: IQGAP1; biological behavior; gastric cancer; pepsinogen C; tumor metastasis.


Conflict of interest statement

The authors declare that they have no competing interests.

Figures

Figure 1
Figure 1
PGC inhibits GC cell proliferation, migration, invasion, and EMT in vitro. (AC) Cell viability was measured by using CCK-8 assay after the transfection of HGC-27 (A), AGS (B), and MKN-45 (C) cells with LV-PGC and LV-Ctrl, and the results suggested that PGC inhibited cell viability. (DG) Cell proliferation was evaluated by using EdU assay after the transfection of HGC-27 and AGS cells with LV-PGC and LV-Ctrl. Representative images of EdU assays (D,E) and the EdU incorporation percentage (F,G) revealed that overexpression of PGC inhibited cell proliferation. (H,I) Cell motility was examined with a wound healing assay in HGC-27 and AGS cells transfected with LV-PGC and LV-Ctrl. Representative images and the cell mobility ratio revealed that PGC inhibited GC cell migration. (J,K) Migration and invasion of HGC-27 and AGS cells transfected with LV-PGC and LV-Ctrl were determined using transwell migration and invasion assays. Representative images of transwell assays and the number of cells passing through the chamber revealed that PGC inhibited GC cell migration and invasion. (LN) qRT-PCR analysis of the expression levels of EMT-associated markers E-cadherin, N-cadherin, vimentin, Snail, Slug, Twist, fibronectin, MMP2, and MMP9 in HGC-27 (L), AGS (M), and MKN-45 (N) cells transfected with LV-PGC and LV-Ctrl. The results suggested that PGC regulated the expression of EMT biomarkers. Data are shown as means ± SEM; * p < 0.05, ** p < 0.01, *** p < 0.001, ns: no significance, scale bar, 100 mm.
Figure 2
Figure 2
PGC inhibits GC cell growth and metastasis in vivo. (A,B) MKN-45 cells stably expressing PGC (LV-PGC) showed inhibited subcutaneous tumor growth compared with the negative control vector group (LV-Ctrl). Representative images of the macroscopic appearance of subcutaneous nodules (A) and the tumor volume over the entire period and tumor weight at the end point (B) (n = 7 per group). (C,D) MKN-45 cells were subcutaneously injected into nude mice to create a subcutaneous tumor model. Intratumoral injection of hPGCp significantly inhibited subcutaneous tumor growth compared to the injection of the NS group. Representative images of the macroscopic appearance of subcutaneous nodules (C) and the tumor volume over the entire period and tumor weight at the endpoint (D) (n = 5 per group). (EH) MKN-45 cells stably expressing PGC (LV-PGC) showed inhibited peritoneal dissemination compared to the negative control vector group (LV-Ctrl). Representative images of the macroscopic appearance of peritoneal dissemination nodules, red arrows indicate the representative peritoneal dissemination nodules. (E), the number and weight of abdominal metastasis nodules (F), the incidence of organ invasion in mice with peritoneal dissemination mice (G), and H&E staining of peritoneal dissemination nodules as well as the invasion of the liver and pancreas (H). (a,b) show pathological images of abdominal metastasis nodules in the LV-Ctrl and LV-PGC groups, respectively, while (c,d) show representative pathological images of liver invasion and pancreatic invasion in the LV-Ctrl group (n = 5 per group). Data are shown as means ± SEM; * p < 0.05, ** p < 0.01, *** p < 0.001.
Figure 3
Figure 3
PGC promotes differentiation and inhibits the stemness of GC cells. (A) qRT-PCR analysis of the expression levels of mature differentiation markers and dedifferentiation markers in gastric mucosa epithelium in HGC-27 (a,b), AGS (c,d), and MKN-45 (e,f) cells transfected with LV-PGC and LV-Ctrl. The results revealed that PGC promoted the expression of mature differentiation markers of gastric mucosa but inhibited the expression of biomarkers of progenitor cells and GC stem cells. (BE) The stem-cell-like phenotype of HGC-27 and AGS cells transfected with LV-PGC and LV-Ctrl was determined using sphere formation assays. Representative images of spheres on day 2, day 5, and day 7 (B,C), the number of spheres per field (D), and the average sphere diameter (E) showed that PGC significantly reduced the sphere-forming efficiency of GC cells. (F,G) Representative images of the subcellular morphological structure characteristics of HGC-27 (F) and AGS (G) cells revealed that PGC-overexpressing cells exhibited more differentiated subcellular structure characteristics. (a,b) Microvilli on the cell surface (shown by the red arrows, magnification, ×2.0 k). (c,d) The intracellular mitochondria (M) (shown by the red arrows) and mitochondrial crista, rough endoplasmic reticulum (RER), and Golgi apparatus (Go) (magnification, ×15.0 k). Data are shown as means ± SEM; * p < 0.05, ** p < 0.01, *** p < 0.001, ns: no significance.
Figure 4
Figure 4
PGC interacts with IQGAP1 and interferes with IQGAP1 protein stability in GC cells. For the Co-IP assays, AGS cells were transfected with FLAG-PGC, and the FLAG fusion magnetic beads were used for pulldown analysis. (AC) FLAG-PGC interacts with IQGAP1 (A), but not ARHGEF2 (B), CDC42BP2, or ENO1 (C). (D) HA-IQGAP1 interacts with FLAG-PGC in GC cells, indicating that PGC and IQGAP1 can interact with each other. The AGS cells were cotransfected with HA-IQGAP1 and FLAG-PGC. HA fusion magnetic beads were used for pull-down analysis, and anti-HA antibodies as well as anti-FLAG antibodies were used for WB. The red arrow points to the band of interest. (E) PGC and IQGAP1 are co-localized in the cytoplasm, as demonstrated by immunofluorescence staining analysis. The red arrows indicate the representative overlap of green fluorescence with red fluorescence. (FH) qRT-PCR and WB were used to determine the expression level changes of IQGAP1 in HGC-27, AGS, and MKN-45 cells transfected with LV-PGC and LV-Ctrl. The results showed that PGC decreased the expression of the IQGAP1 protein rather than the mRNA, which suggested that the effect of PGC on IQGAP1 may be at the post-transcriptional level. (I) AGS cells treated with CHX (100 µM/mL) revealed that PGC overexpression accelerated the degradation of IQGAP1. (J) AGS cells treated with MG132 for 6 h showed that the downregulation of IQGAP1 protein induced by PGC was rescued by the proteasome inhibitor MG132. PGC may decrease the protein stability of IQGAP1 by affecting its ubiquitination level. Data are shown as means ± SEM; * p < 0.05, ns: no significance. The uncropped bolts are shown in Supplementary Materials.
Figure 5
Figure 5
PGC inhibits GC cell migration and invasion by reducing IQGAP1 and suppressing Rho-GTPase signaling. (AC) Cell motility was examined using wound healing assays in HGC-27 and AGS cells transfected with LV-PGC + IQGAP1-NC, PGC-NC + LV-IQGAP1, and LV-PGC + LV-IQGAP1. Representative images (A,B) and the cell mobility ratio (C) revealed that increased expression of IQGAP1 counteracted the effects of PGC overexpression on cell motility. (DF) The migration and invasion of HGC-27 and AGS cells transfected with LV-PGC + IQGAP1-NC, PGC-NC + LV-IQGAP1, and LV-PGC + LV-IQGAP1 were determined using transwell migration and invasion assays. Representative images (D,E) of transwell assays and the numbers of cells passing through the chamber (F) revealed that IQGAP1 counteracted the effects of PGC overexpression on cell migration and invasion. Data are shown as means ± SEM; * p < 0.05, ** p < 0.01, *** p < 0.001. (G) FLAG-PGC can interact with Rho. AGS cells were transfected with FLAG-PGC. For the Co-IP assays, FLAG fusion magnetic beads were used for pull-down analysis, and anti-RhoA + B + C antibody was used for WB. The uncropped bolts are shown in Supplementary Materials.
Figure 6
Figure 6
PGC expression in GC is significantly negatively correlated with IQGAP1. (AC) The mRNA expression level of PGC (A) and IQGAP1 (B) and the correlation of their expression (C) were determined by using the GEPIA2 database, which suggested that PGC expression is negatively correlated with IQGAP1 at the mRNA level. The red section represents tumor tissue, and the gray section represents normal tissue. The data are shown as means ± SEM; * p < 0.05. (D,E) The prognostic roles of PGC (D) and IQGAP1 (E) mRNA expression in GC were determined by using the Kaplan-Meier Plotter database. (FH) The protein expression levels of PGC (F) and IQGAP1 (G) and the expression correlation (H) were determined by using the CPTAC database, which showed that PGC expression is negatively correlated with IQGAP1 at the protein level. (I) The mRNA expression data of 20 paired GC tissues and the correlated normal tissues revealed that PGC was downregulated while IQGAP1 was upregulated in GC tissues. The data are shown as means ± SEM; * p < 0.05, ** p < 0.01.
Figure 7
Figure 7
Schematic diagram summarizing the function of PGC on GC. PGC can downregulate its interacting protein IQGAP1 and inhibit the Rho-GTPase pathway, thereby participating in the inhibition of GC cell migration and invasion.

Similar articles

References

    1. Kageyama T. Pepsinogens, progastricsins, and prochymosins: Structure, function, evolution, and development. Cell. Mol. Life Sci. 2002;59:288–306. doi: 10.1007/s00018-002-8423-9. - DOI - PMC - PubMed
    1. Shen S., Jiang J., Yuan Y. Pepsinogen C expression, regulation and its relationship with cancer. Cancer Cell Int. 2017;17:57. doi: 10.1186/s12935-017-0426-6. - DOI - PMC - PubMed
    1. Samloff I.M. Slow moving protease and the seven pepsinogens. Electrophoretic demontration of the existence of eight proteolytic fractions in human gastric mucosa. Gastroenterology. 1969;57:659–669. doi: 10.1016/S0016-5085(19)33821-1. - DOI - PubMed
    1. Hanahan D., Weinberg R.A. Hallmarks of cancer: The next generation. Cell. 2011;144:646–674. doi: 10.1016/j.cell.2011.02.013. - DOI - PubMed
    1. Tenen D.G. Disruption of differentiation in human cancer: AML shows the way. Nat. Rev. Cancer. 2003;3:89–101. doi: 10.1038/nrc989. - DOI - PubMed