Review
. 2024 May 18;16(10):1926.
doi: 10.3390/cancers16101926.

Update on Renal Cell Carcinoma Diagnosis with Novel Imaging Approaches

Affiliations
Review

Update on Renal Cell Carcinoma Diagnosis with Novel Imaging Approaches

Marie-France Bellin et al. Cancers (Basel). .

Abstract

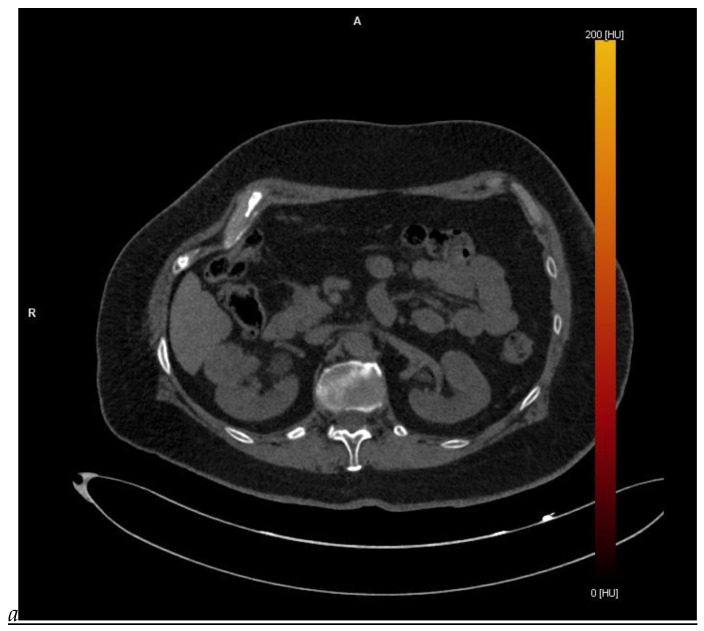
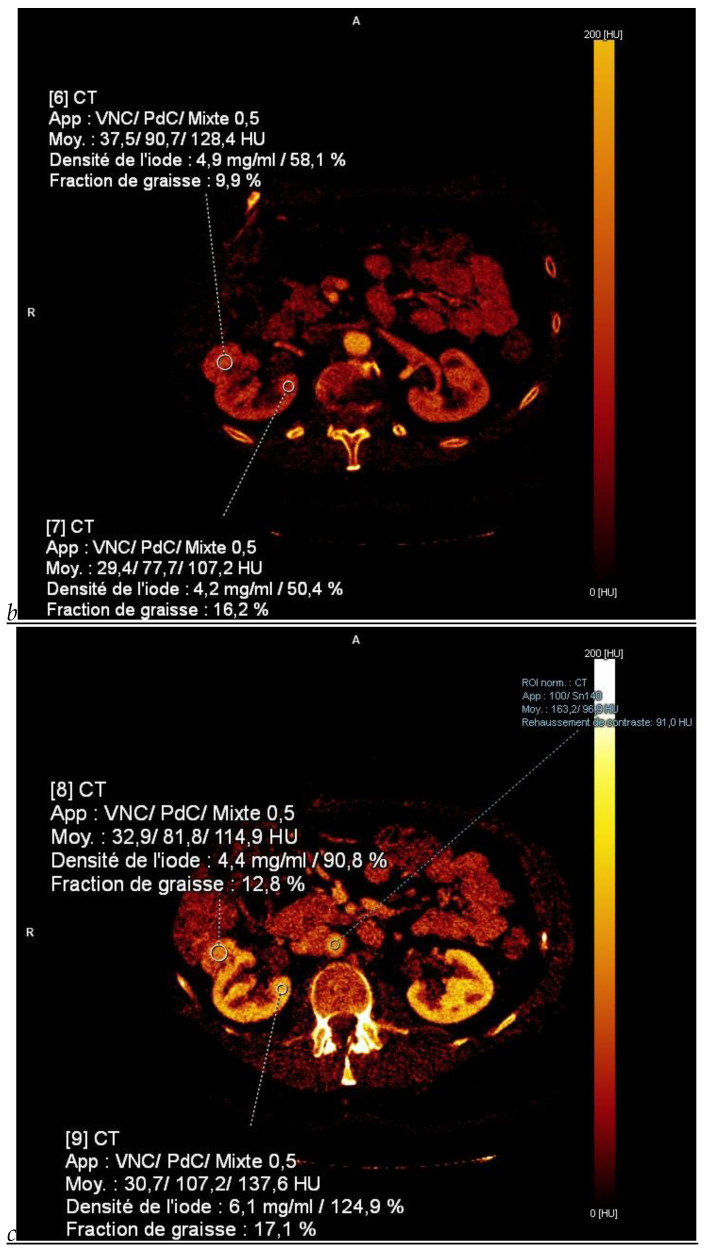
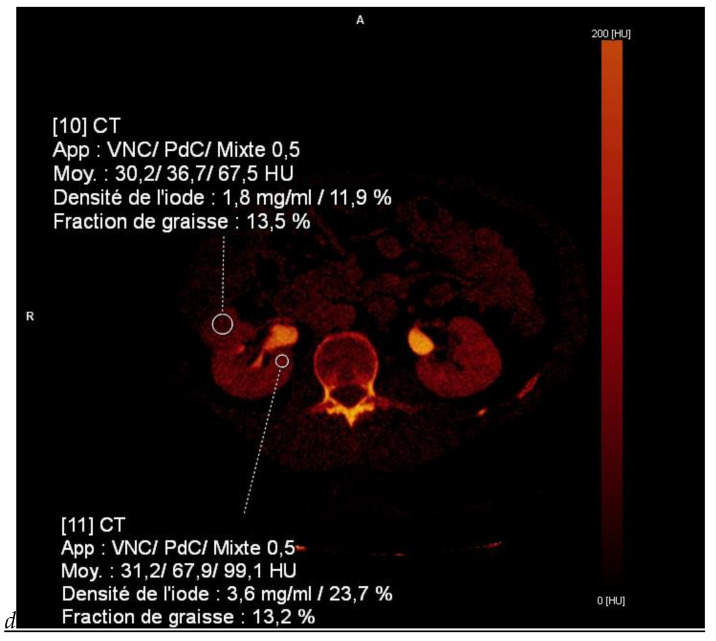
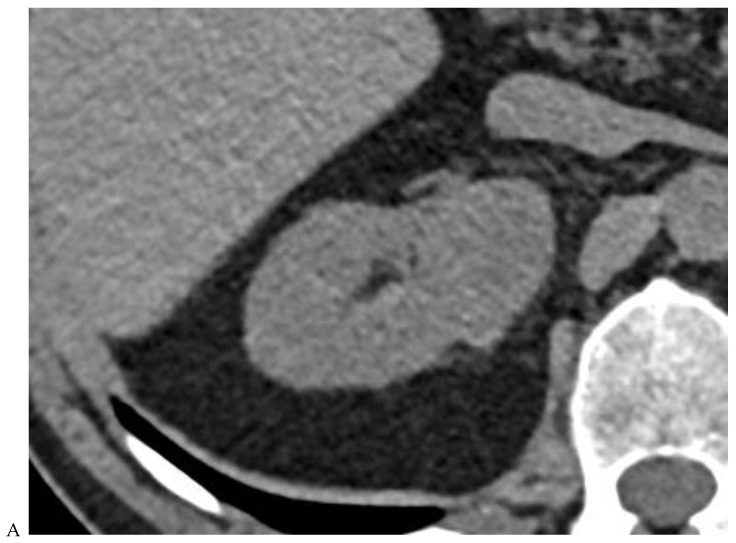
This review highlights recent advances in renal cell carcinoma (RCC) imaging. It begins with dual-energy computed tomography (DECT), which has demonstrated a high diagnostic accuracy in the evaluation of renal masses. Several studies have suggested the potential benefits of iodine quantification, particularly for distinguishing low-attenuation, true enhancing solid masses from hyperdense cysts. By determining whether or not a renal mass is present, DECT could avoid the need for additional imaging studies, thereby reducing healthcare costs. DECT can also provide virtual unenhanced images, helping to reduce radiation exposure. The review then provides an update focusing on the advantages of multiparametric magnetic resonance (MR) imaging performance in the histological subtyping of RCC and in the differentiation of benign from malignant renal masses. A proposed standardized stepwise reading of images helps to identify clear cell RCC and papillary RCC with a high accuracy. Contrast-enhanced ultrasound may represent a promising diagnostic tool for the characterization of solid and cystic renal masses. Several combined pharmaceutical imaging strategies using both sestamibi and PSMA offer new opportunities in the diagnosis and staging of RCC, but their role in risk stratification needs to be evaluated. Although radiomics and tumor texture analysis are hampered by poor reproducibility and need standardization, they show promise in identifying new biomarkers for predicting tumor histology, clinical outcomes, overall survival, and the response to therapy. They have a wide range of potential applications but are still in the research phase. Artificial intelligence (AI) has shown encouraging results in tumor classification, grade, and prognosis. It is expected to play an important role in assessing the treatment response and advancing personalized medicine. The review then focuses on recently updated algorithms and guidelines. The Bosniak classification version 2019 incorporates MRI, precisely defines previously vague imaging terms, and allows a greater proportion of masses to be placed in lower-risk classes. Recent studies have reported an improved specificity of the higher-risk categories and better inter-reader agreement. The clear cell likelihood score, which adds standardization to the characterization of solid renal masses on MRI, has been validated in recent studies with high interobserver agreement. Finally, the review discusses the key imaging implications of the 2017 AUA guidelines for renal masses and localized renal cancer.

Keywords: AUA guidelines; Bosniak classification version 2019; PSMA PET/CT; artificial intelligence; clear cell likelihood score; contrast-enhanced ultrasound; dual-energy CT; multiparametric MRI; photon-counting detector CT; quantitative computed tomography; radiomics; renal cell carcinoma; sestamibi SPECT/CT; spectral CT.


Conflict of interest statement

The authors declare no conflicts of interest.

Figures

Figure 1
Figure 1
Dual-energy CT aspect of a hypervascularized clear cell renal cell carcinoma of the upper pole of the right kidney. (a) Virtual unenhanced image. Note the presence of a solid exophytic renal mass in the upper pole of the right kidney. (b) The lesion enhances during the corticomedullary phase; measurement of the iodine concentration of the lesion (4.9 mg/mL) compared to that of the renal cortex (4.2 mg/mL) during the corticomedullary phase. (c) Monoenergetic image obtained at 40 keV during the nephrographic phase. Note the decrease in iodine concentration of the lesion (4.42 mg/mL) compared to that of the renal cortex (6.1 mg/mL). (d) Monoenergetic image obtained at 70 keV during the excretory phase. Compared to the monoenergetic image at 40 keV, the contrast between the lesion and the adjacent renal cortex is reduced. Note the washout of the lesion (iodine content: 1.8 mg/mL).
Figure 1
Figure 1
Dual-energy CT aspect of a hypervascularized clear cell renal cell carcinoma of the upper pole of the right kidney. (a) Virtual unenhanced image. Note the presence of a solid exophytic renal mass in the upper pole of the right kidney. (b) The lesion enhances during the corticomedullary phase; measurement of the iodine concentration of the lesion (4.9 mg/mL) compared to that of the renal cortex (4.2 mg/mL) during the corticomedullary phase. (c) Monoenergetic image obtained at 40 keV during the nephrographic phase. Note the decrease in iodine concentration of the lesion (4.42 mg/mL) compared to that of the renal cortex (6.1 mg/mL). (d) Monoenergetic image obtained at 70 keV during the excretory phase. Compared to the monoenergetic image at 40 keV, the contrast between the lesion and the adjacent renal cortex is reduced. Note the washout of the lesion (iodine content: 1.8 mg/mL).
Figure 2
Figure 2
Oncocytoma in the right kidney of a 42-year-old man. (A) On the unenhanced image, the 4.8 cm lesion is isodense relative to the renal parenchyma. Enhancement is seen on the corticomedullary phase image (B), followed by washout on the nephrographic (C) and excretory (D) phase images. (E) Macroscopic view of the lesion after radical nephrectomy. Courtesy of Pr S. Ferlicot, Department of Pathology, Bicêtre.
Figure 2
Figure 2
Oncocytoma in the right kidney of a 42-year-old man. (A) On the unenhanced image, the 4.8 cm lesion is isodense relative to the renal parenchyma. Enhancement is seen on the corticomedullary phase image (B), followed by washout on the nephrographic (C) and excretory (D) phase images. (E) Macroscopic view of the lesion after radical nephrectomy. Courtesy of Pr S. Ferlicot, Department of Pathology, Bicêtre.
Figure 3
Figure 3
CT aspect of a chromophobe renal cell carcinoma in the left kidney of a 68-year-old-woman. (A) Unenhanced image. Presence of an isodense, homogeneous solid lesion at the medium part of the left kidney. (B) It appears moderately hypervascularized on the corticomedullary phase image, with hyperdense septa. (C) There is progressive washout on the nephrographic phase image and the lesions appears hypodense relative to the renal parenchyma (C). (D) Macroscopic view of the lesion after partial nephrectomy. Courtesy of Pr S. Ferlicot, Department of Pathology, Bicêtre Hospital.
Figure 3
Figure 3
CT aspect of a chromophobe renal cell carcinoma in the left kidney of a 68-year-old-woman. (A) Unenhanced image. Presence of an isodense, homogeneous solid lesion at the medium part of the left kidney. (B) It appears moderately hypervascularized on the corticomedullary phase image, with hyperdense septa. (C) There is progressive washout on the nephrographic phase image and the lesions appears hypodense relative to the renal parenchyma (C). (D) Macroscopic view of the lesion after partial nephrectomy. Courtesy of Pr S. Ferlicot, Department of Pathology, Bicêtre Hospital.
Figure 4
Figure 4
Multiphasic CT enhancement of a papillary renal cell carcinoma in the middle part of the right kidney of a 63-year-old woman. (A) Mean unenhanced attenuation was 35 HU. (B) Mean corticomedullary phase attenuation was 45 HU. (C) Mean nephrographic phase attenuation was 59 HU. (D) Mean excretory phase attenuation was 65 HU.
Figure 4
Figure 4
Multiphasic CT enhancement of a papillary renal cell carcinoma in the middle part of the right kidney of a 63-year-old woman. (A) Mean unenhanced attenuation was 35 HU. (B) Mean corticomedullary phase attenuation was 45 HU. (C) Mean nephrographic phase attenuation was 59 HU. (D) Mean excretory phase attenuation was 65 HU.
Figure 5
Figure 5
Clear cell renal cell carcinoma in the right kidney of a 52-year-old-man. (A) Coronal T2-weighted fast SE image shows a large heterogeneous mass with areas of high signal intensity compared with renal parenchyma. Transverse in-phase (B,C) opposed-phase MR images show a subtle signal loss on the opposed-phase image. (D) The ADC map is heterogeneous with predominant areas of restriction of tumor diffusion. Transverse gadolinium-enhanced T1-weighted gradient-echo spoiled MR images in (E) corticomedullary, (F) nephrographic, (G) and delayed phase images show intense and rapid peripheral enhancement during the arterial and nephrographic phases followed by a rapid washout of contrast on the delayed phase. Central necrotic areas do not enhance. (H) Macroscopic view of the lesion after radical nephrectomy. The lesion appears heterogeneous. Courtesy of Pr S. Ferlicot, Department of Pathology, Bicêtre Hospital.
Figure 5
Figure 5
Clear cell renal cell carcinoma in the right kidney of a 52-year-old-man. (A) Coronal T2-weighted fast SE image shows a large heterogeneous mass with areas of high signal intensity compared with renal parenchyma. Transverse in-phase (B,C) opposed-phase MR images show a subtle signal loss on the opposed-phase image. (D) The ADC map is heterogeneous with predominant areas of restriction of tumor diffusion. Transverse gadolinium-enhanced T1-weighted gradient-echo spoiled MR images in (E) corticomedullary, (F) nephrographic, (G) and delayed phase images show intense and rapid peripheral enhancement during the arterial and nephrographic phases followed by a rapid washout of contrast on the delayed phase. Central necrotic areas do not enhance. (H) Macroscopic view of the lesion after radical nephrectomy. The lesion appears heterogeneous. Courtesy of Pr S. Ferlicot, Department of Pathology, Bicêtre Hospital.
Figure 6
Figure 6
Fat-poor angiomyolipoma in the right kidney of a 46-year-old-man. (A) Coronal T2-weighted fast SE image shows the low signal intensity of the lesion compared with the renal parenchyma. Transverse in-phase (B,C) opposed-phase MR images show a significant loss of signal intensity on the opposed-phase image. (D) The ADC map shows marked restriction of tumor diffusion into the renal mass. Transverse gadolinium-enhanced T1-weighted gradient-echo spoiled MR images in (E) corticomedullary, (F) nephrographic, (G) and delayed phase images show early enhancement and rapid washout.
Figure 6
Figure 6
Fat-poor angiomyolipoma in the right kidney of a 46-year-old-man. (A) Coronal T2-weighted fast SE image shows the low signal intensity of the lesion compared with the renal parenchyma. Transverse in-phase (B,C) opposed-phase MR images show a significant loss of signal intensity on the opposed-phase image. (D) The ADC map shows marked restriction of tumor diffusion into the renal mass. Transverse gadolinium-enhanced T1-weighted gradient-echo spoiled MR images in (E) corticomedullary, (F) nephrographic, (G) and delayed phase images show early enhancement and rapid washout.
Figure 7
Figure 7
Papillary renal cell carcinoma in the right kidney of a 75-year-old-woman. (A) Axial T2-weighted fast SE image shows a homogeneous 1.8 cm mass in the posterolateral region of the right kidney, with a lower SI compared to renal parenchyma. Transverse in-phase (B,C) opposed-phase MR images do not show a significant signal loss on the opposed-phase image. (D) The ADC map shows restriction of tumor diffusion into the renal mass. Transverse nonenhanced (E) and gadolinium-enhanced T1-weighted gradient-echo spoiled MR images in (F) corticomedullary, (G) nephrographic, (H) and delayed phase images show progressive enhancement without washout; the mass is hypovascular compared to the renal cortex.
Figure 7
Figure 7
Papillary renal cell carcinoma in the right kidney of a 75-year-old-woman. (A) Axial T2-weighted fast SE image shows a homogeneous 1.8 cm mass in the posterolateral region of the right kidney, with a lower SI compared to renal parenchyma. Transverse in-phase (B,C) opposed-phase MR images do not show a significant signal loss on the opposed-phase image. (D) The ADC map shows restriction of tumor diffusion into the renal mass. Transverse nonenhanced (E) and gadolinium-enhanced T1-weighted gradient-echo spoiled MR images in (F) corticomedullary, (G) nephrographic, (H) and delayed phase images show progressive enhancement without washout; the mass is hypovascular compared to the renal cortex.
Figure 8
Figure 8
Same lesion as Figure 3. Chromophobe renal cell carcinoma in the left kidney of a 68-year-old-woman. (A) Axial T2-weighted fast SE image shows the exophytic heterogeneous isointense renal mass with a posterior hyperintense area. Transverse in-phase (B,C) opposed-phase MR images show no significant loss of signal intensity on the opposed-phase image. (D) The ADC map shows restriction of tumor diffusion into the renal mass. Transverse nonenhanced (E) and gadolinium-enhanced T1-weighted gradient-echo spoiled MR images in (F) corticomedullary, (G) nephrographic, (H) and delayed phase images show a mid-intense enhancement of the lesion without visible washout.
Figure 8
Figure 8
Same lesion as Figure 3. Chromophobe renal cell carcinoma in the left kidney of a 68-year-old-woman. (A) Axial T2-weighted fast SE image shows the exophytic heterogeneous isointense renal mass with a posterior hyperintense area. Transverse in-phase (B,C) opposed-phase MR images show no significant loss of signal intensity on the opposed-phase image. (D) The ADC map shows restriction of tumor diffusion into the renal mass. Transverse nonenhanced (E) and gadolinium-enhanced T1-weighted gradient-echo spoiled MR images in (F) corticomedullary, (G) nephrographic, (H) and delayed phase images show a mid-intense enhancement of the lesion without visible washout.
Figure 9
Figure 9
Same lesion as Figure 2. Oncocytoma in the right kidney of a 42-year-old man. (A) The axial T2-weighted fast SE image shows a heterogeneous lesion with a central hyperintense area. Transverse in-phase (B,C) opposed-phase MR images show no significant loss of signal intensity on the opposed-phase image. (D) The lesion is hyperintense on the diffusion-weighted image. Transverse nonenhanced (E) and gadolinium-enhanced T1-weighted gradient-echo spoiled MR images in (F) corticomedullary, (G) nephrographic, (H) and delayed phase images show early enhancement and rapid washout.
Figure 9
Figure 9
Same lesion as Figure 2. Oncocytoma in the right kidney of a 42-year-old man. (A) The axial T2-weighted fast SE image shows a heterogeneous lesion with a central hyperintense area. Transverse in-phase (B,C) opposed-phase MR images show no significant loss of signal intensity on the opposed-phase image. (D) The lesion is hyperintense on the diffusion-weighted image. Transverse nonenhanced (E) and gadolinium-enhanced T1-weighted gradient-echo spoiled MR images in (F) corticomedullary, (G) nephrographic, (H) and delayed phase images show early enhancement and rapid washout.
Figure 10
Figure 10
Papillary renal cell carcinoma in the right kidney of a 54-year-old woman. (A) B-mode ultrasound shows a large right cystic renal mass with heterogeneous contents and a dependent sediment. (B) CEUS with Sonovue® (Bracco Imaging France, Massy, France) reveals the presence of a solid enhancing component at the posterior aspect of the mass. (C) The mass was resected. Pathology identified a necrotic papillary renal cell carcinoma. Courtesy of Pr S. Ferlicot, Department of Pathology, Bicêtre Hospital.
Figure 10
Figure 10
Papillary renal cell carcinoma in the right kidney of a 54-year-old woman. (A) B-mode ultrasound shows a large right cystic renal mass with heterogeneous contents and a dependent sediment. (B) CEUS with Sonovue® (Bracco Imaging France, Massy, France) reveals the presence of a solid enhancing component at the posterior aspect of the mass. (C) The mass was resected. Pathology identified a necrotic papillary renal cell carcinoma. Courtesy of Pr S. Ferlicot, Department of Pathology, Bicêtre Hospital.

Similar articles

Cited by

References

    1. Global Cancer Observatory: Cancer Today. WHO International Agency for Research on Cancer; Lyon, France: 2022. [(accessed on 2 May 2024)]. Available online: https://gco.iarc.fr/today.
    1. Ferlay J., Colombet M., Soerjomataram I., Dyba T., Randi G., Bettio M., Gavin A., Visser O., Bray F. Cancer incidence and mortality patterns in Europe: Estimates for 40 countries and 25 major cancers in 2018. Eur. J. Cancer. 2018;103:356–387. doi: 10.1016/j.ejca.2018.07.005. - DOI - PubMed
    1. Huang J., Leung D.K., Chan E.O., Lok V., Leung S., Wong I., Lao X.Q., Zheng Z.J., Chiu P.K., Ng C.F., et al. A global trend analysis of kidney cancer incidence and mortality and their associations with smoking, alcohol consumption, and metabolic syndrome. Eur. Urol. Focus. 2022;8:200–209. doi: 10.1016/j.euf.2020.12.020. - DOI - PubMed
    1. Laguna M.P., Algaba F., Cadeddu J., Clayman R., Gill I., Gueglio G., Hohenfellner M., Joyce A., Landman J., Lee B., et al. Current patterns of presentation and treatment of renal masses: A clinical research office of the endourological society prospective study. J. Endourol. 2014;28:861–870. doi: 10.1089/end.2013.0724. - DOI - PubMed
    1. Kowalewski K.F., Egen L., Fischetti C.E., Puliatti S., Juan G.R., Taratkin M., Ines R.B., Sidoti Abate M.A., Mühlbauer J., Wessels F., et al. Artificial intelligence for renal cancer: From imaging to histology and beyond. Asian J. Urol. 2022;9:243–252. doi: 10.1016/j.ajur.2022.05.003. - DOI - PMC - PubMed

LinkOut - more resources