. 2024 May 1;14(5):585.
doi: 10.3390/life14050585.

Characteristics of Gut Microbiota in Rosacea Patients-A Cross-Sectional, Controlled Pilot Study

Affiliations

Characteristics of Gut Microbiota in Rosacea Patients-A Cross-Sectional, Controlled Pilot Study

Anne Guertler et al. Life (Basel). .

Abstract

Background: Recent studies have suggested a possible connection between rosacea and patients' gut microbiota.

Objective: To investigate the differences in fecal microbial profiles between patients with rosacea and healthy controls.

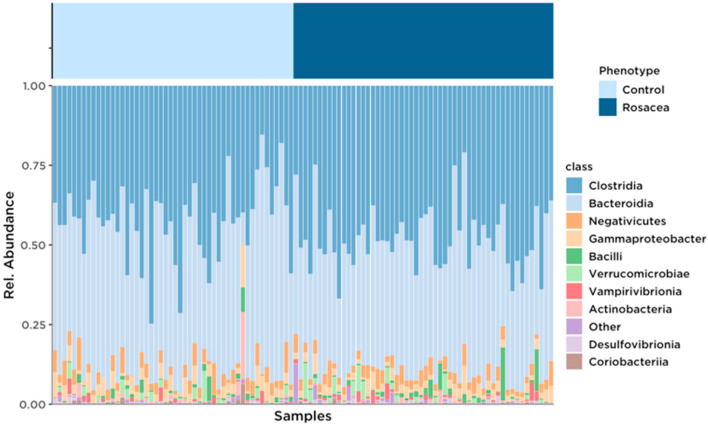
Methods: Gut microbiota of 54 rosacea patients (RP) were analyzed using MiSeq 16S rRNA sequencing. Enterotypes, the Firmicutes/Bacteroides (F/B) ratio, the significance of alpha and beta diversity, and differential abundance analysis (DAA) were calculated and compared with age- and gender-matched controls (CP, n = 50).

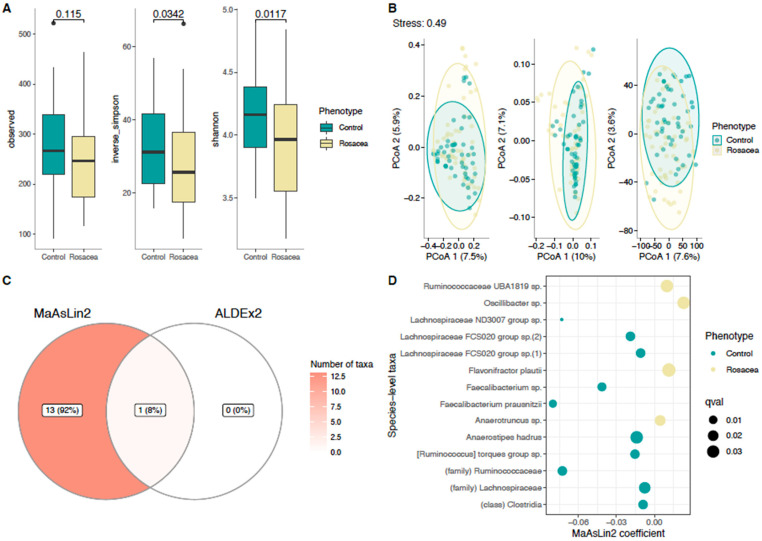
Results: Significant changes in the enterotypes and F/B ratio were observed between the RP and CP (p = 0.017 and p = 0.002, respectively). The RP showed a decreased microbial richness and diversity compared to the CP (Shannon p = 0.012, inverse Simpson p = 0.034). Beta diversity also differed between both groups (PERMANOVA, p = 0.006). Fourteen significantly different taxa were detected according to DAA. Faecalibacterium prausnitzii (coef. -0.0800, p = 0.008), Lachnoospiraceae ND 3007 group sp. (coef. -0.073, p < 0.001), and Ruminococcaceae (coef. -0.072, p = 0.015) were significantly decreased; Oscillobacter sp. (coef. 0.023, p = 0.031), Flavonifractor plautii (coef. 0.011, p = 0.037), and Ruminococccaceae UBA 1819 (coef. 0.010, p = 0.031) were significantly increased in the RP compared to the CP.

Conclusion: Significant alterations in gut microbiota were present in the RP. Taxonomic shifts and reduced richness and diversity were observed when compared to the CP. Larger prospective studies are needed to investigate correlations with clinical features and to translate these findings into future therapeutic approaches.

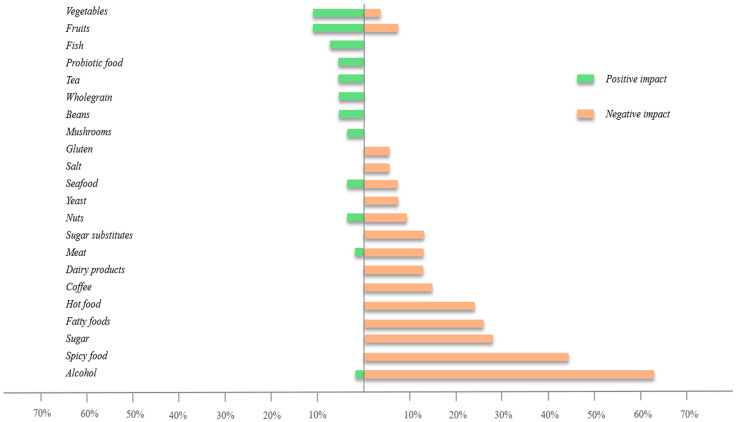
Keywords: diet; diversity; enterotypes; gut–skin axis; nutrition; stool.


Conflict of interest statement

A.G., P.H., M.I., L.E.F., B.M.C.-E., M.R. declare no conflicts of interest. C.P., N.G. and B.S. are employed by Biome Diagnostics GmbH, a medtech company that develops and sells microbiome analysis kits to end customers and research applications. This fact did not impact the design of the study or the interpretation of the results in any way.

Figures

Figure 1
Figure 1
Bar plot with calculated relative abundances in rosacea patients and controls. Taxa with the highest abundances at the class level were visualized for each sample.
Figure 2
Figure 2
(A) Microbial richness (number of observed operational taxonomic units [ASVs] (left column)) and diversity measures (inverse Simpson (middle column), Shannon index (right column)) of intestinal microbiota between rosacea patients and controls. (B) Principal coordinates analysis (PCoA) plots are shown with the percentage of explained variance. In PCoA with non-Euclidean distances, dissimilarities are first projected into similarities in a Euclidean space (with some information loss, i.e., stress) and then projected to the maximal variance axes. This means that the maximal variance axes do not necessarily reflect the correspondence of the projected distances and original distances. Hence, the classical stress function (which sums up the squared differences and scales them to the squared sum of the original ones) is reported here along the PCoA plots. Stress varies between 0 and 1, and smaller stress values mean better scaling. (C) Differential abundance analysis (DAA) using ALDEx2 and MaAsLin2. Taxa were analyzed at species level. Only statistically significant associations are shown. (D) Detailed differential abundance analysis (DAA) using MaAsLin2 between rosacea patients and controls.
Figure 3
Figure 3
Rosacea patients’ subjective assessment (%) of food items with beneficial (green) and negative impact on the clinical severity (red).

References

    1. Wollina U. Is rosacea a systemic disease? Clin. Dermatol. 2019;37:629–635. doi: 10.1016/j.clindermatol.2019.07.032. - DOI - PubMed
    1. Clanner-Engelshofen B.M., Bernhard D., Dargatz S., Flaig M.J., Gieler U., Kinberger M., Klövekorn W., Kuna A.C., Läuchli S., Lehmann P., et al. S2k guideline: Rosacea. J. Dtsch. Dermatol. Ges. 2022;20:1147–1165. doi: 10.1111/ddg.14849. - DOI - PubMed
    1. Rainer B.M., Fischer A.H., da Silva D.L.F., Kang S., Chien A.L. Rosacea is associated with chronic systemic diseases in a skin severity-dependent manner: Results of a case-control study. J. Am. Acad. Dermatol. 2015;73:604–608. doi: 10.1016/j.jaad.2015.07.009. - DOI - PubMed
    1. van Zuuren E.J., Arents B.W., van der Linden M.M., Vermeulen S., Fedorowicz Z., Tan J. Rosacea: New Concepts in Classification and Treatment. Am. J. Clin. Dermatol. 2021;22:457–465. doi: 10.1007/s40257-021-00595-7. - DOI - PMC - PubMed
    1. Sánchez-Pellicer P., Eguren-Michelena C., García-Gavín J., Llamas-Velasco M., Navarro-Moratalla L., Núñez-Delegido E., Agüera-Santos J., Navarro-López V. Rosacea, microbiome and probiotics: The gut-skin axis. Front. Microbiol. 2023;14:1323644. doi: 10.3389/fmicb.2023.1323644. - DOI - PMC - PubMed

LinkOut - more resources