

T-Cell Responses to COVID-19 Vaccines and Breakthrough Infection in People Living with HIV Receiving Antiretroviral Therapy
- PMID: 38793543
- PMCID: PMC11125792
- DOI: 10.3390/v16050661
T-Cell Responses to COVID-19 Vaccines and Breakthrough Infection in People Living with HIV Receiving Antiretroviral Therapy
Abstract
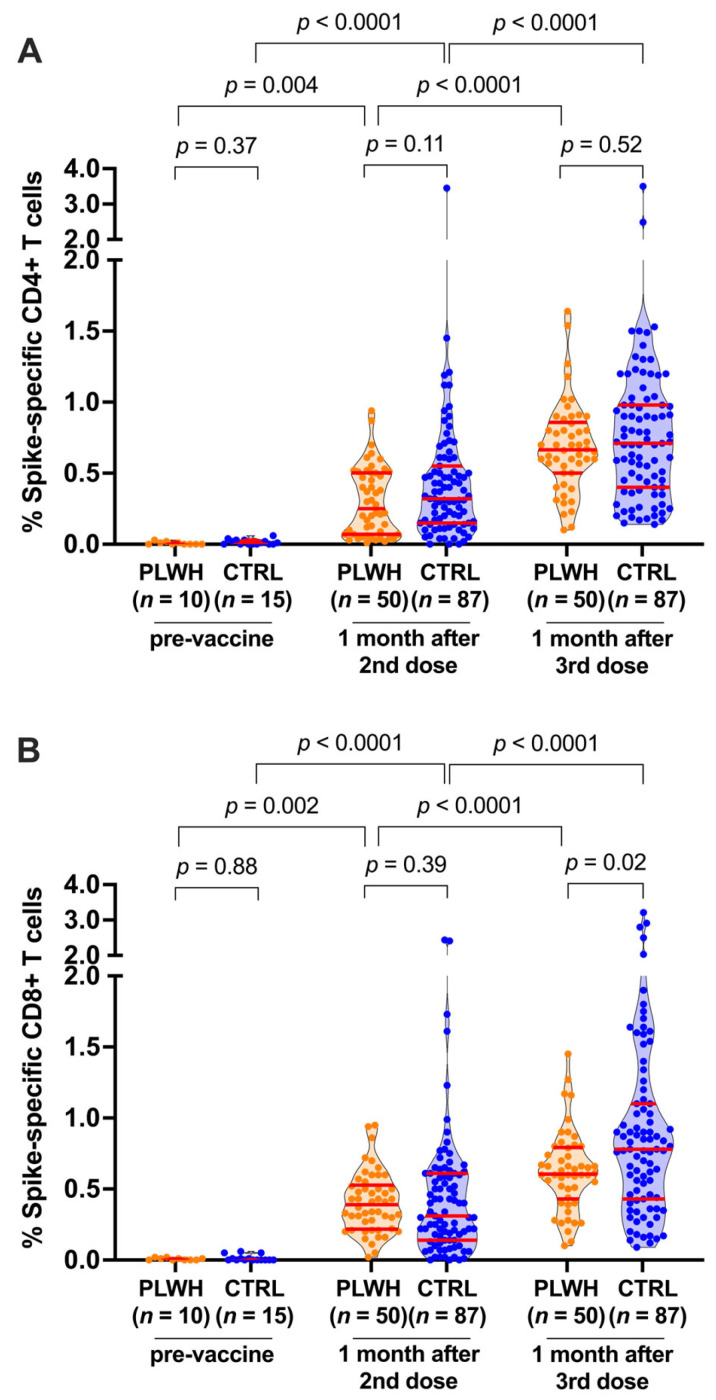
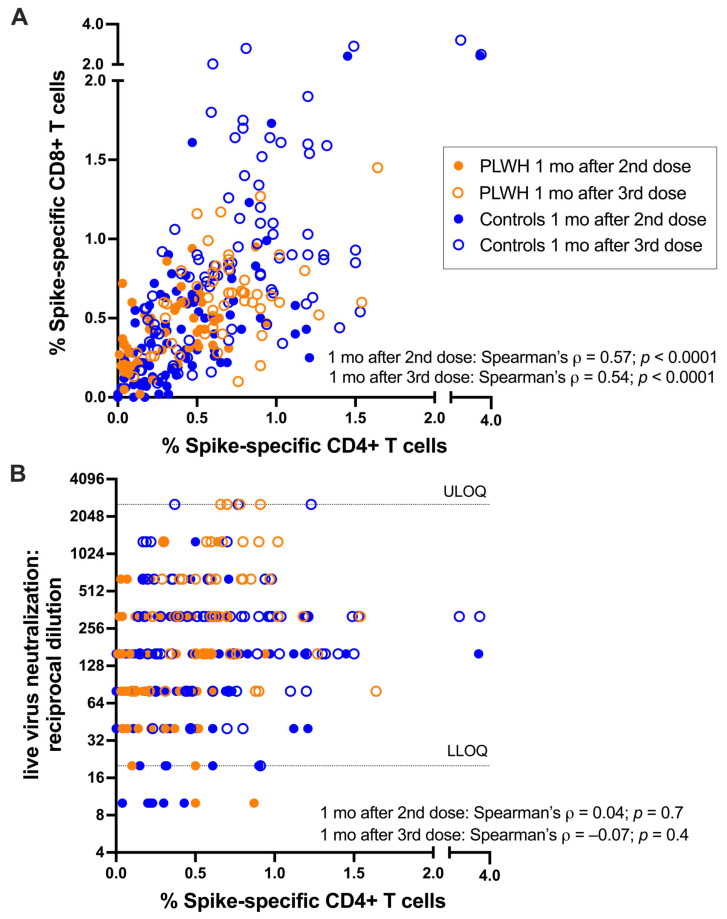
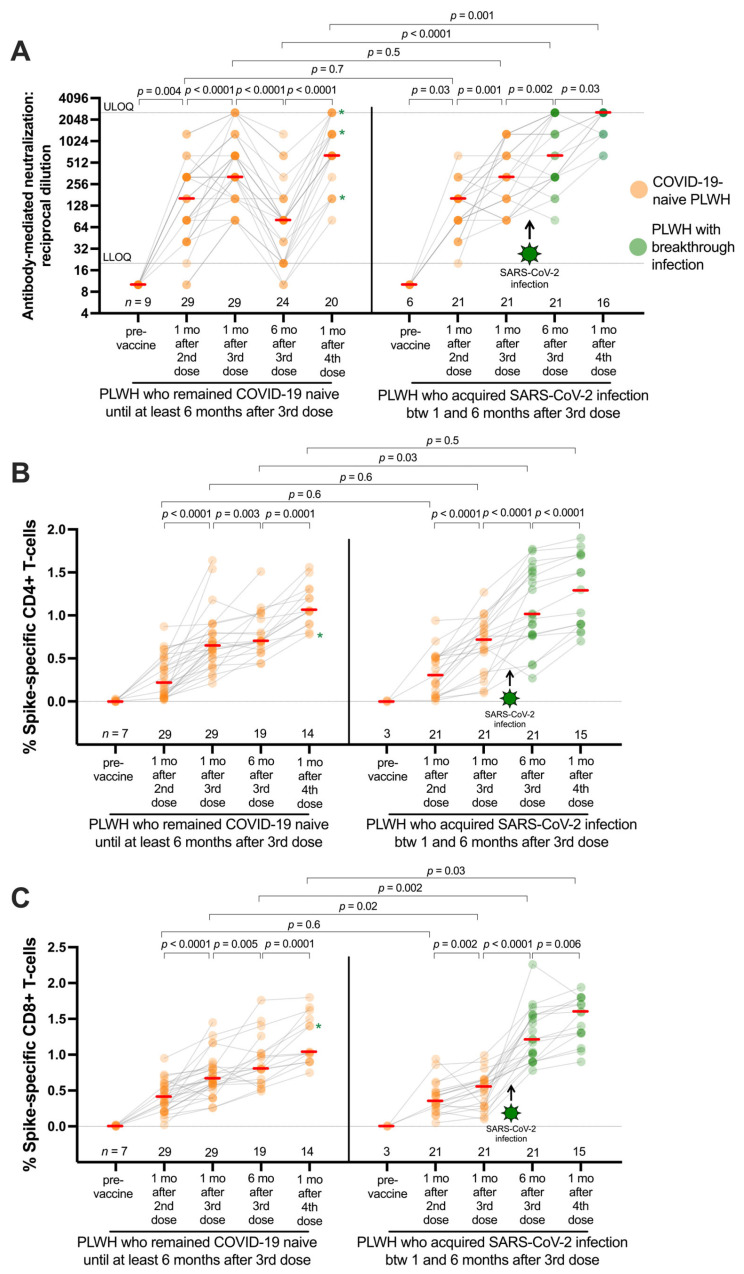
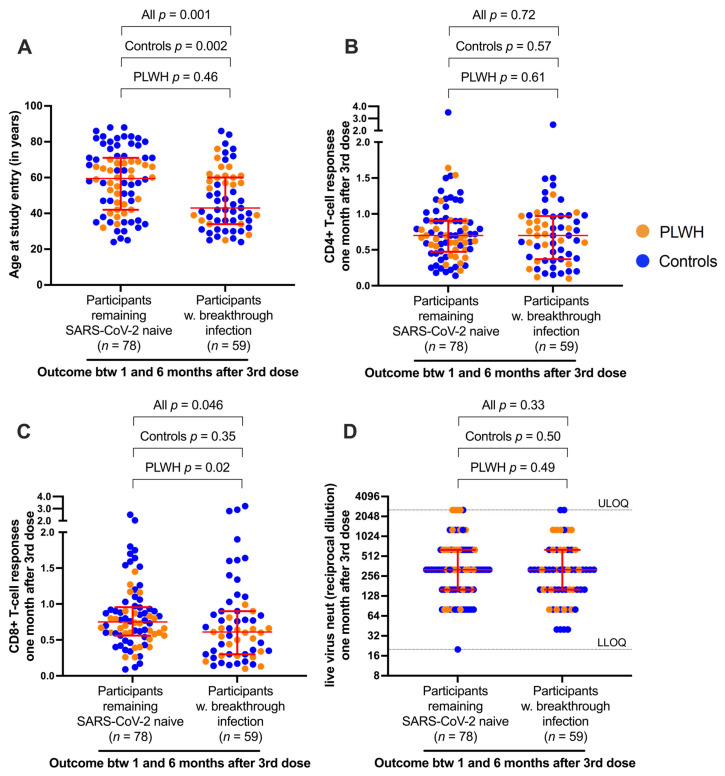
People living with HIV (PLWH) can exhibit impaired immune responses to vaccines. Accumulating evidence indicates that PLWH, particularly those receiving antiretroviral therapy, mount strong antibody responses to COVID-19 vaccines, but fewer studies have examined cellular immune responses to the vaccinations. Here, we used an activation-induced marker (AIM) assay to quantify SARS-CoV-2 spike-specific CD4+ and CD8+ T cells generated by two and three doses of COVID-19 vaccines in 50 PLWH receiving antiretroviral therapy, compared to 87 control participants without HIV. In a subset of PLWH, T-cell responses were also assessed after post-vaccine breakthrough infections and/or receipt of a fourth vaccine dose. All participants remained SARS-CoV-2 infection-naive until at least one month after their third vaccine dose. SARS-CoV-2 infection was determined by seroconversion to a Nucleocapsid (N) antigen, which occurred in 21 PLWH and 38 control participants after the third vaccine dose. Multivariable regression analyses were used to investigate the relationships between sociodemographic, health- and vaccine-related variables, vaccine-induced T-cell responses, and breakthrough infection risk. We observed that a third vaccine dose boosted spike-specific CD4+ and CD8+ T-cell frequencies significantly above those measured after the second dose (all p < 0.0001). Median T-cell frequencies did not differ between PLWH and controls after the second dose (p > 0.1), but CD8+ T-cell responses were modestly lower in PLWH after the third dose (p = 0.02), an observation that remained significant after adjusting for sociodemographic, health- and vaccine-related variables (p = 0.045). In PLWH who experienced a breakthrough infection, median T-cell frequencies increased even higher than those observed after three vaccine doses (p < 0.03), and CD8+ T-cell responses in this group remained higher even after a fourth vaccine dose (p = 0.03). In multivariable analyses, the only factor associated with an increased breakthrough infection risk was younger age, which is consistent with the rapid increase in SARS-CoV-2 seropositivity that was seen among younger adults in Canada after the initial appearance of the Omicron variant. These results indicate that PLWH receiving antiretroviral therapy mount strong T-cell responses to COVID-19 vaccines that can be enhanced by booster doses or breakthrough infection.
Keywords: COVID-19; HIV; SARS-CoV-2; T cells; antiretroviral therapy; coronavirus; vaccine.
Conflict of interest statement
The authors declare no conflicts of interest.
Figures
References
-
- Western Cape Department of Health in collaboration with the National Institute for Communicable Diseases, South Africa Risk Factors for Coronavirus Disease 2019 (COVID-19) Death in a Population Cohort Study from the Western Cape Province, South Africa. Clin. Infect. Dis. 2021;73:e2005–e2015. doi: 10.1093/cid/ciaa1198. - DOI - PMC - PubMed
-
- Geretti A.M., Stockdale A.J., Kelly S.H., Cevik M., Collins S., Waters L., Villa G., Docherty A., Harrison E.M., Turtle L., et al. Outcomes of COVID-19 related hospitalization among people with HIV in the ISARIC WHO Clinical Characterization Protocol (UK): A prospective observational study. Clin. Infect. Dis. 2021;73:e2095–e2106. doi: 10.1093/cid/ciaa1605. - DOI - PMC - PubMed
-
- Bhaskaran K., Rentsch C.T., MacKenna B., Schultze A., Mehrkar A., Bates C.J., Eggo R.M., Morton C.E., Bacon S.C.J., Inglesby P., et al. HIV infection and COVID-19 death: A population-based cohort analysis of UK primary care data and linked national death registrations within the OpenSAFELY platform. Lancet HIV. 2021;8:e24–e32. doi: 10.1016/S2352-3018(20)30305-2. - DOI - PMC - PubMed
-
- Tesoriero J.M., Swain C.E., Pierce J.L., Zamboni L., Wu M., Holtgrave D.R., Gonzalez C.J., Udo T., Morne J.E., Hart-Malloy R., et al. COVID-19 Outcomes Among Persons Living with or without Diagnosed HIV Infection in New York State. JAMA Netw. Open. 2021;4:e2037069. doi: 10.1001/jamanetworkopen.2020.37069. - DOI - PMC - PubMed
MeSH terms
Substances
Supplementary concepts
Grants and funding
LinkOut - more resources
Full Text Sources
Medical
Research Materials
Miscellaneous
