. 2024 Apr 24;16(5):662.
doi: 10.3390/v16050662.

Design and Development of an Antigen Test for SARS-CoV-2 Nucleocapsid Protein to Validate the Viral Quality Assurance Panels

Affiliations

Design and Development of an Antigen Test for SARS-CoV-2 Nucleocapsid Protein to Validate the Viral Quality Assurance Panels

Partha Ray et al. Viruses. .

Abstract

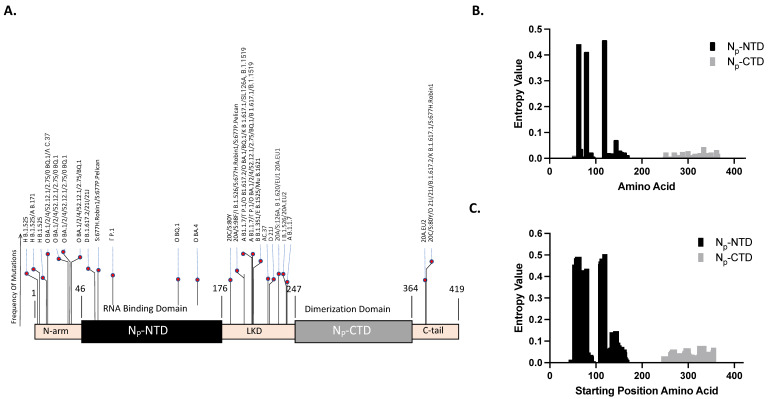
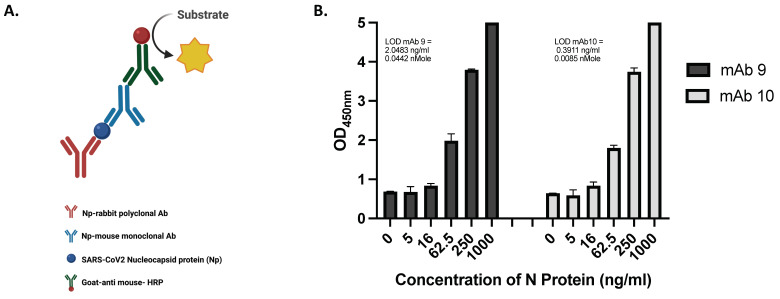
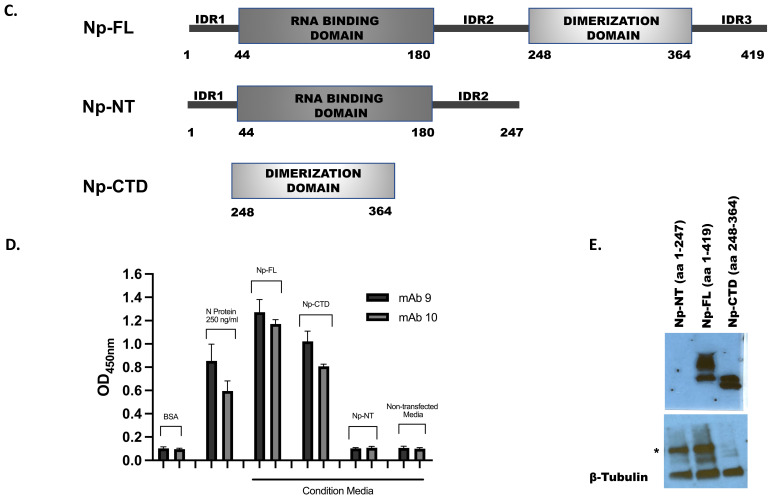
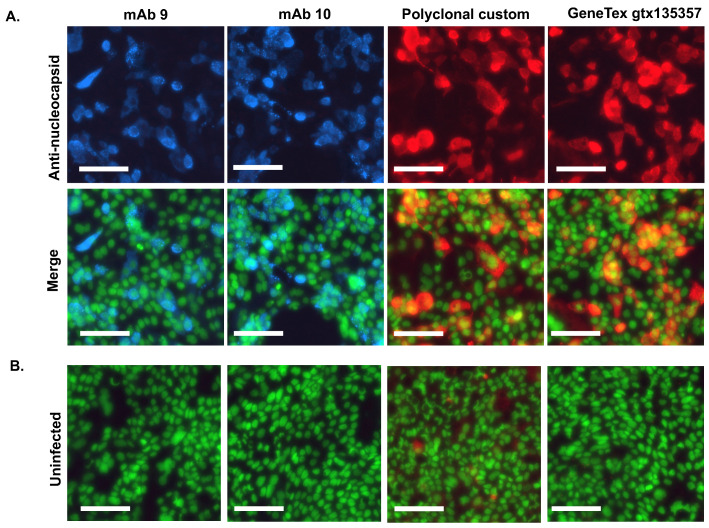
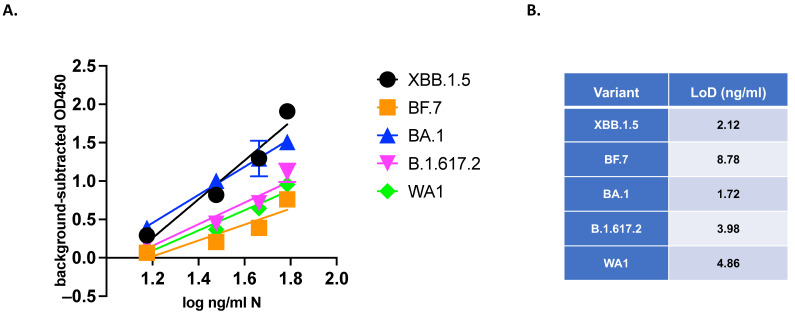
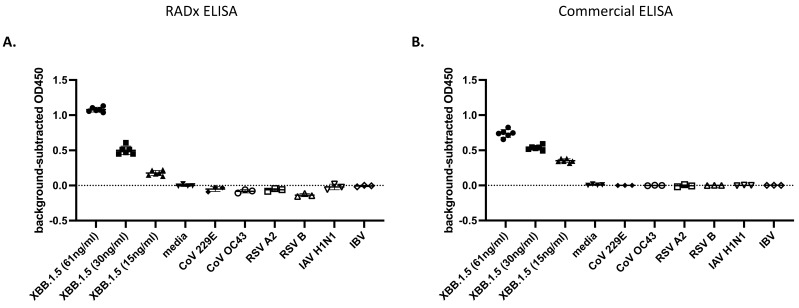
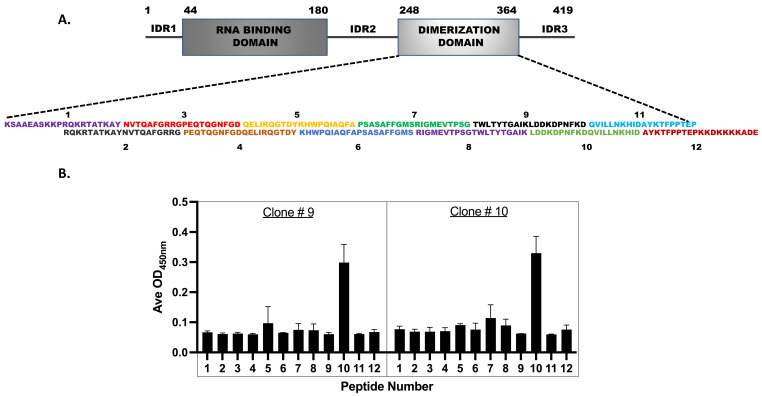
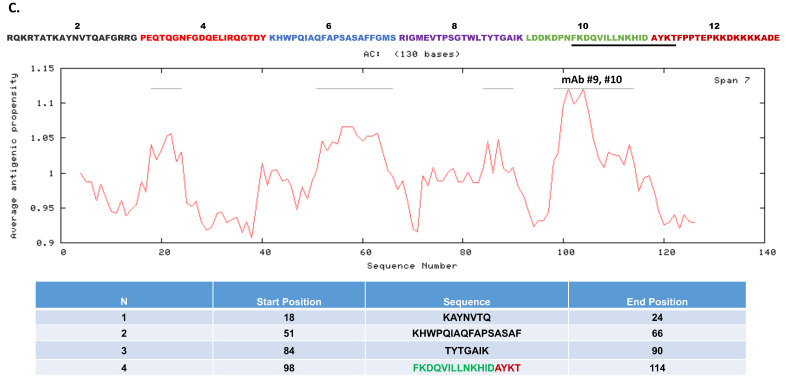
The continuing mutability of the SARS-CoV-2 virus can result in failures of diagnostic assays. To address this, we describe a generalizable bioinformatics-to-biology pipeline developed for the calibration and quality assurance of inactivated SARS-CoV-2 variant panels provided to Radical Acceleration of Diagnostics programs (RADx)-radical program awardees. A heuristic genetic analysis based on variant-defining mutations demonstrated the lowest genetic variance in the Nucleocapsid protein (Np)-C-terminal domain (CTD) across all SARS-CoV-2 variants. We then employed the Shannon entropy method on (Np) sequences collected from the major variants, verifying the CTD with lower entropy (less prone to mutations) than other Np regions. Polyclonal and monoclonal antibodies were raised against this target CTD antigen and used to develop an Enzyme-linked immunoassay (ELISA) test for SARS-CoV-2. Blinded Viral Quality Assurance (VQA) panels comprised of UV-inactivated SARS-CoV-2 variants (XBB.1.5, BF.7, BA.1, B.1.617.2, and WA1) and distractor respiratory viruses (CoV 229E, CoV OC43, RSV A2, RSV B, IAV H1N1, and IBV) were assembled by the RADx-rad Diagnostics core and tested using the ELISA described here. The assay tested positive for all variants with high sensitivity (limit of detection: 1.72-8.78 ng/mL) and negative for the distractor virus panel. Epitope mapping for the monoclonal antibodies identified a 20 amino acid antigenic peptide on the Np-CTD that an in-silico program also predicted for the highest antigenicity. This work provides a template for a bioinformatics pipeline to select genetic regions with a low propensity for mutation (low Shannon entropy) to develop robust 'pan-variant' antigen-based assays for viruses prone to high mutational rates.

Keywords: COVID-19 diagnostics; Enzyme-linked immunoassay; RADx; SARS-CoV-2; monoclonal and polyclonal antibodies; nucleocapsid protein; peptide epitope mapping; viral quality assurance.


Conflict of interest statement

The authors declare no conflict of interest.

Figures

Figure 1
Figure 1
Bioinformatics approach to select the Nucleocapsid protein antigenic region: (A) Bar graph illustrating the defining mutations for the N-protein. The location of each mutation is plotted on the x-axis, and the height of each bar indicates the number of variants carrying that specific mutation. Notably, no defining mutations are observed in the CTD region. (B) Single-point Shannon entropy of the NTD and CTD regions based on 1800 genomic sequences (150 samples per each of the 12 SARS-CoV-2 variants). Each bar represents the entropy value at a specific amino acid position, indicating the variability at that site. (C) Windowed Shannon entropy analysis using an epitope-sized window (10 amino acids). Each bar indicates the entropy of the window beginning at the position of the bar on the x-axis. In both (B) and (C), the NTD exhibits higher entropy values compared to the CTD, indicating more variability in the former, as supported by statistically significant p-values of <0.005.
Figure 2
Figure 2
Developing the RADx sandwich ELISA: (A) Schema of the ELISA: The rabbit polyclonal antibodies raised against the antigen, Nucleocapsid protein (Np) CTD, were used to coat the microtiter plates for capturing the SARS-CoV-2 Np. The two mouse monoclonal antibodies (either mAb 9 or mAb 10) raised against the antigen Np CTD were used as detection antibodies, and the colorimetric assay was developed using the goat-anti-mouse antibodies conjugated to HRP. The figure was made using BioRender (B). Recombinant purified full-length (FL) Np at indicated concentrations were titrated to determine the ELISA’s limit of detection (LoD). All experiments were performed in triplicate sets (n = 3). Data were plotted with error bars denoting the standard deviation of the mean. (C) Nucleocapsid protein full length (Np-FL), N-terminal portion (Np-NT), and C-terminal Domain (Np-CTD), as indicated by their size, were cloned and expressed as recombinant proteins in mammalian cells. (D) The expressed proteins secreted in the conditioned media were used to determine the specificity of the ELISA. All experiments were performed in triplicate sets (n = 3). Data were plotted with error bars that denoted the standard deviation of the mean. (E) The conditioned media were subjected to the Western blots assay using mAb 10. The bands were detected in the Np-CTD and Np-FL; no bands were detected in the Np-NT-conditioned media. The higher migrating bands are due to the post-translational modification of the Np. Beta-tubulin was used as the loading marker; the higher migrating bands, indicated by asterisks, were the Beta-tubulin dimer.
Figure 2
Figure 2
Developing the RADx sandwich ELISA: (A) Schema of the ELISA: The rabbit polyclonal antibodies raised against the antigen, Nucleocapsid protein (Np) CTD, were used to coat the microtiter plates for capturing the SARS-CoV-2 Np. The two mouse monoclonal antibodies (either mAb 9 or mAb 10) raised against the antigen Np CTD were used as detection antibodies, and the colorimetric assay was developed using the goat-anti-mouse antibodies conjugated to HRP. The figure was made using BioRender (B). Recombinant purified full-length (FL) Np at indicated concentrations were titrated to determine the ELISA’s limit of detection (LoD). All experiments were performed in triplicate sets (n = 3). Data were plotted with error bars denoting the standard deviation of the mean. (C) Nucleocapsid protein full length (Np-FL), N-terminal portion (Np-NT), and C-terminal Domain (Np-CTD), as indicated by their size, were cloned and expressed as recombinant proteins in mammalian cells. (D) The expressed proteins secreted in the conditioned media were used to determine the specificity of the ELISA. All experiments were performed in triplicate sets (n = 3). Data were plotted with error bars that denoted the standard deviation of the mean. (E) The conditioned media were subjected to the Western blots assay using mAb 10. The bands were detected in the Np-CTD and Np-FL; no bands were detected in the Np-NT-conditioned media. The higher migrating bands are due to the post-translational modification of the Np. Beta-tubulin was used as the loading marker; the higher migrating bands, indicated by asterisks, were the Beta-tubulin dimer.
Figure 3
Figure 3
Immunofluorescence assay using the antibodies to detect nucleocapsid in SARS-CoV-2 infected cells: Calu-3 cells infected with SARS-CoV-2 variant BA.2.12.1 were fixed at 24 h post-infection and processed for immunofluorescence. (A) Nucleocapsid was detected with monoclonal and polyclonal antibodies at a concentration of 1:100 or commercial polyclonal antibody (GeneTex gtx135357) at 1:1000 (upper panels). Nuclei were counterstained with Sytox Green (lower panels, Merge). (B) Uninfected controls were treated as above for each antibody (Uninfected, merge). The scale bar is 100µm.
Figure 4
Figure 4
Comparison of ELISA using UV-inactivated SARS-CoV-2 variants: (A) SARS-CoV-2 variants XBB.1.5, BF.7, BA.1, B.1.617.2, and WA1 were UV-inactivated, and ng/mL N of stocks was determined by a commercial ELISA. Stocks were normalized to equal ng/mL N and serially diluted in VTM. Triplicate aliquots (n = 3) of each dilution were measured by the ELISA using antibodies by a blinded experimenter. Graphs are mean +/− SD of blank-subtracted OD450 values from triplicate samples. The best-fit line was calculated on log-transformed concentrations in GraphPad Prism 10. (B) The LoDs of each variant are listed.
Figure 5
Figure 5
ELISA specificity to SARS-CoV-2: (A) SARS-CoV-2 variant XBB.1.5 and additional respiratory viruses were UV-inactivated, diluted in media, and measured by the ELISA. (B) An identical dilution series was prepared at the same time and assayed using the Ray Biotech SARS-CoV-2 nucleocapsid ELISA. Both ELISAs were performed blind on non-SARS-CoV-2 (n = 3) and SARS-CoV-2 (n = 6) virus samples. Graphs are mean +/− SD of blank-subtracted OD450 values. The best-fit line was calculated on log-transformed concentrations in GraphPad Prism 10.
Figure 6
Figure 6
Epitope mapping for the monoclonal antibodies: (A) Twelve overlapping peptides spanning the Np-CTD were designed to determine the linear epitopes for the mAb 9 and 10 antibodies. (B) The synthesized peptides were subjected to the ELISA using the pepscan method. Peptide #10 demonstrated the highest binding to the mAb 9 and 10, indicating that the major epitope for the monoclonal antibodies is present within these twenty amino acids long linear peptides. All experiments were performed in triplicate sets (n = 3). Data were plotted with error bars that denoted the standard deviation of the mean. (C) An in-silico program (http://imed.med.ucm.es/Tools/antigenic.pl) (accessed on 5 December 2023) predicted the Np-CTD’s four major linear epitopes (listed in the table). Notably, the peptide epitope (N = 4) with the predicted highest antigenicity was part of the same peptide #10 determined by our pepscan assay. The predicted epitope spanning peptides 10 and 12 is underscored.
Figure 6
Figure 6
Epitope mapping for the monoclonal antibodies: (A) Twelve overlapping peptides spanning the Np-CTD were designed to determine the linear epitopes for the mAb 9 and 10 antibodies. (B) The synthesized peptides were subjected to the ELISA using the pepscan method. Peptide #10 demonstrated the highest binding to the mAb 9 and 10, indicating that the major epitope for the monoclonal antibodies is present within these twenty amino acids long linear peptides. All experiments were performed in triplicate sets (n = 3). Data were plotted with error bars that denoted the standard deviation of the mean. (C) An in-silico program (http://imed.med.ucm.es/Tools/antigenic.pl) (accessed on 5 December 2023) predicted the Np-CTD’s four major linear epitopes (listed in the table). Notably, the peptide epitope (N = 4) with the predicted highest antigenicity was part of the same peptide #10 determined by our pepscan assay. The predicted epitope spanning peptides 10 and 12 is underscored.

Similar articles

Cited by

References

    1. Kevadiya B.D., Machhi J., Herskovitz J., Oleynikov M.D., Blomberg W.R., Bajwa N., Soni D., Das S., Hasan M., Patel M., et al. Diagnostics for SARS-CoV-2 infections. Nat. Mater. 2021;20:593–605. doi: 10.1038/s41563-020-00906-z. - DOI - PMC - PubMed
    1. Peeling R.W., Heymann D.L., Teo Y.Y., Garcia P.J. Diagnostics for COVID-19: Moving from pandemic response to control. Lancet. 2022;399:757–768. doi: 10.1016/S0140-6736(21)02346-1. - DOI - PMC - PubMed
    1. Dong T., Wang M., Liu J., Ma P., Pang S., Liu W., Liu A. Diagnostics and analysis of SARS-CoV-2: Current status, recent advances, challenges and perspectives. Chem. Sci. 2023;14:6149–6206. doi: 10.1039/d2sc06665c. - DOI - PMC - PubMed
    1. Lancet Commission on COVID-19 Vaccines. Therapeutics Task Force Members Operation Warp Speed: Implications for global vaccine security. Lancet. Glob. Health. 2021;9:e1017–e1021. doi: 10.1016/S2214-109X(21)00140-6. - DOI - PMC - PubMed
    1. RADxSM Radical. [(accessed on 8 March 2024)]. Available online: https://www.radxrad.org/

MeSH terms

Supplementary concepts