. 2024 Apr 25;16(5):670.
doi: 10.3390/v16050670.

HIV-1 Capsid Rapidly Induces Long-Lived CPSF6 Puncta in Non-Dividing Cells, but Similar Puncta Already Exist in Uninfected T-Cells

Affiliations

HIV-1 Capsid Rapidly Induces Long-Lived CPSF6 Puncta in Non-Dividing Cells, but Similar Puncta Already Exist in Uninfected T-Cells

Anabel Guedán et al. Viruses. .

Abstract

The HIV-1 capsid (CA) protein forms the outer shell of the viral core that is released into the cytoplasm upon infection. CA binds various cellular proteins, including CPSF6, that direct HIV-1 integration into speckle-associated domains in host chromatin. Upon HIV-1 infection, CPSF6 forms puncta in the nucleus. Here, we characterised these CPSF6 puncta further in HeLa cells, T-cells and macrophages and confirmed that integration and reverse transcription are not required for puncta formation. Indeed, we found that puncta formed very rapidly after infection, correlating with the time that CA entered the nucleus. In aphidicolin-treated HeLa cells and macrophages, puncta were detected for the length of the experiment, suggesting that puncta are only lost upon cell division. CA still co-localised with CPSF6 puncta at the latest time points, considerably after the peak of reverse transcription and integration. Intriguingly, the number of puncta induced in macrophages did not correlate with the MOI or the total number of nuclear speckles present in each cell, suggesting that CA/CPSF6 is only directed to a few nuclear speckles. Furthermore, we found that CPSF6 already co-localised with nuclear speckles in uninfected T-cells, suggesting that HIV-1 promotes a natural behaviour of CPSF6.

Keywords: CPSF5; CPSF6; HIV-1; T-cell; capsid; macrophage; nuclear speckle; uncoating.


Conflict of interest statement

The authors declare no conflicts of interest. The sponsors had no role in the design, execution, interpretation, or writing of the study.

Figures

Figure 1
Figure 1
HIV-1 CA induces the relocalisation of CPSF6 to nuclear speckles. HeLa cells (A,C) or primary MDMs (B,D) were infected with equal RT units of wild-type (WT) HIV-1-GFP and fixed at 16 h post-infection (h.p.i.) or 5 days post-infection (d.p.i.), respectively. Uninfected and infected cells were immunostained with primary antibodies against SC35 and CPSF6, followed by species-specific secondary antibodies conjugated to Alexa Fluor fluorophores. (A,B) Representative images of SC35 (white) and CPSF6 (magenta) staining. White arrowheads point to SC35 and CPSF6 co-localisation. Scale bars are 5 μm. (C,D) Representative intensity profiles of SC35 and CPSF6 staining in HeLa (C) and primary MDMs (D). The graphs show the fluorescence intensity along the white lines shown in the merged images in (A,B), respectively.
Figure 2
Figure 2
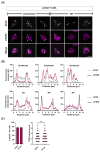
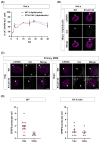
CPSF6 staining is punctate in uninfected Jurkat cells and co-localises with nuclear speckles. Jurkat T-cells were infected with WT HIV-1-GFP and fixed at 24 h.p.i. Uninfected and infected cells were immunostained with primary antibodies against SC35 and CPSF6, followed by species-specific secondary antibodies conjugated to Alexa Fluor fluorophores. (A) Representative images of SC35 (white) and CPSF6 (magenta) staining. White arrowheads point to SC35 and CPSF6 co-localisation. Blue arrowheads point to small, bright foci. Scale bars are 5 μm. (B) Representative intensity profiles of SC35 and CPSF6 staining from cells in uninfected (top graphs) and infected (bottom graphs) Jurkat T-cell populations. The graphs show the fluorescence intensity along the white lines shown in the merged images (A). (C) Quantification of the percentage of cells positive for CPSF6 foci (left graph) and the number of CPSF6 puncta per cell (right graph). Points indicate individual cells (~150 cells per repeat were analysed for quantification) ns = p > 0.05, analysed by a paired t-test.
Figure 3
Figure 3
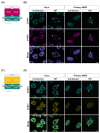
HIV-1 CA induces relocalisation of CPSF5 and CPSF6 but not CPSF7. (A,C) Schematic diagrams of the CFIm complexes with CPSF5 and CPSF6 (A), and CPSF5 and CPSF7 (C). (B,D) HeLa cells and primary MDMs were synchronously infected with equal RT units of WT HIV-1-GFP and fixed at 16 h.p.i. and 72 h.p.i., respectively. Representative images of uninfected and infected cells immunostained for CPSF5 and CPSF6 (B) or CPSF5 and CPSF7 (D) are shown. White arrowheads point to co-localisation. Scale bars are 5 μm.
Figure 4
Figure 4
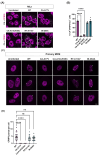
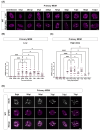
CPSF6 relocalisation is independent of reverse transcription and integration. (A) HeLa cells were infected with equal titres of WT or mutant HIV-1-GFP (CA-A77V, CA-A14C/E45C, RT-A114V and IN-D64A) for 16 h.p.i. Uninfected cells were used as a control. Cells were incubated with primary antibodies against HIV-1 CA (white) and CPSF6 (magenta), followed by species-specific secondary antibodies conjugated to Alexa Fluor fluorophores. Representative merged images are shown. The scale bar is 5 μm. (B) The bar chart represents the percentage of CA-positive cells that showed CPSF6 redistribution to puncta. Points indicate individual biological repeats (~150 cells per repeat were analysed for quantification), and bars show the mean ± SEM; **** = p < 0.0001, analysed by one-way ANOVA with Dunnet’s multiple comparisons test. (C) Primary MDMs were synchronously infected with equal RT units of WT or mutant VLP (CA-A77V, CA-A14C/E45C, RT-A114V and IN-D64A) for 72 h.p.i. Cells were immunostained for CPSF6. Three representative images are shown per condition. The scale bar is 5 μm. (D) Quantification of the number of CPSF6 puncta per cell in infected MDMs. Points indicate individual biological repeats, **** = p < 0.0001, ns = p > 0.3, analysed by one-way ANOVA with Dunnet’s multiple comparisons test.
Figure 5
Figure 5
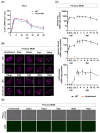
CPSF6 puncta form rapidly and decay slowly in HeLa cells but can exist over two weeks in primary MDM. (A) HeLa cells were synchronously infected with equal ng p24 of WT and RT-A114V HIV-1-GFP and fixed at 0, 2, 4, 8, 16, 24, 30 and 48 h.p.i. Cells were immunostained for HIV-1 CA and CPSF6. The graph displays the percentage of CA-positive cells that showed CPSF6 redistribution to puncta. Data is plotted as mean ± SEM of at least three biological repeats (~150 cells per repeat were analysed). (B) Primary MDMs were synchronously infected with equal ng p24 of WT and RT-A114V HIV-1-GFP and fixed at 0 h, 30 min, 4 h, 24 h, 72 h, 5 d, 7 d, 10 d and 14 d.p.i. Cells were immunostained for CPSF6. Representative images from three biological repeats are shown. The scale bar is 5 μm. (C,D) Primary MDMs were synchronously infected with equal RT units of WT HIV-1-GFP and harvested for DNA extraction at 0 h, 30 min, 3 h, 6 h, 24 h, 48 h, 72 h, 5 d, 7 d, 10 d and 14 d.p.i. (C) Early (minus strand strong stop, top panel) and late (second strand, middle panel) viral cDNA products and 2-LTR circles (bottom panel) were measured by qPCR. The data are shown as mean ± SEM of three biological repeats. Arrows indicate data points that lie out of range of the y-axis. (D) Representative images of GFP-expressing cells (bottom panels) at some of the time points are shown in (C). Pictures were taken before harvesting the cells for DNA extraction. The scale bar is 100 μm.
Figure 6
Figure 6
CPSF6 puncta remain in non-dividing cells and are associated with CA even at late times. (A,B) HeLa cells were arrested in S phase by pre-treatment with Aphidicolin (2 μg/μL) for 24 h prior to a synchronous infection with equal RT units of WT or RT-A114V HIV-1-GFP. Aphidicolin was kept in the media throughout the experiment. Cells were fixed at 0, 4, 24, 30 and 48 h.p.i. and immunostained for HIV-1 CA and CPSF6. (A) The graph displays the percentage of CA-positive cells that showed CPSF6 redistribution to puncta. Data is plotted as mean ± SEM of 2–3 biological repeats (~150 cells per experiment were used for quantification). (B) Representative images of Aphidicolin-treated cells infected with WT or RT-A114V HIV-1-GFP for 48 h. (C) Primary MDMs were synchronously infected with equal RT units of WT or RT-A114V HIV-1-GFP and fixed at 7 and 10 d.p.i. Cells were immunostained for HIV-1 CA and CPSF6. Representative images are shown. (B,C) White arrowheads point to HIV-1 CA and CPSF6 co-localisation. The scale bar is 5 μm. (D) Quantification of the number of CPSF6 puncta per cell in infected MDMs at 7 and 10 d.p.i.
Figure 7
Figure 7
In primary MDMs, the number of CPSF6 puncta remains constant regardless of the MOI or the number of nuclear speckles. (AC) Primary MDMs were synchronously infected with either low (0.3 mU RT activity) or high (12 mU RT activity) amounts of WT HIV-1-GFP. Cells were fixed at the following times post-infection: 0 h, 30 min, 4 h, 24 h, 72 h, 5 d, 7 d, 10 d and 14 d and immunostained for CPSF6. (A) Representative images are shown. The scale bar is 5 μm. (B,C) Graphs show the quantification of the number of CPSF6 puncta per cell in cells infected with low (B) or high (C) RT units of WT VLP. Each dot represents an individual cell. The mean ± SEM from at least two biological repeats is shown. **** = p < 0.0001, *** = p < 0.001, ns = p > 0.05, analysed by one-way ANOVA with Dunnet’s multiple comparisons test. (D) Primary MDMs were synchronously infected with equal RT units of WT HIV-1-GFP and fixed and immunostained for SC35 and CPSF6 at 7 and 10 d.p.i. Representative images are shown. White arrowheads point to SC35 and CPSF6 co-localisation. The scale bar is 5 μm.

Similar articles

Cited by

References

    1. Gres A.T., Kirby K.A., KewalRamani V.N., Tanner J.J., Pornillos O., Sarafianos S.G. X-ray crystal structures of native HIV-1 capsid protein reveal conformational variability. Science. 2015;349:99–103. doi: 10.1126/science.aaa5936. - DOI - PMC - PubMed
    1. Pornillos O., Ganser-Pornillos B.K., Kelly B.N., Hua Y., Whitby F.G., Stout C.D., Sundquist W.I., Hill C.P., Yeager M. X-ray structures of the hexameric building block of the HIV capsid. Cell. 2009;137:1282–1292. doi: 10.1016/j.cell.2009.04.063. - DOI - PMC - PubMed
    1. Mattei S., Glass B., Hagen W.J., Krausslich H.G., Briggs J.A. The structure and flexibility of conical HIV-1 capsids determined within intact virions. Science. 2016;354:1434–1437. doi: 10.1126/science.aah4972. - DOI - PubMed
    1. Guedan A., Caroe E.R., Barr G.C.R., Bishop K.N. The Role of Capsid in HIV-1 Nuclear Entry. Viruses. 2021;13:1425. doi: 10.3390/v13081425. - DOI - PMC - PubMed
    1. Cosnefroy O., Murray P.J., Bishop K.N. HIV-1 capsid uncoating initiates after the first strand transfer of reverse transcription. Retrovirology. 2016;13:58. doi: 10.1186/s12977-016-0292-7. - DOI - PMC - PubMed

Substances

LinkOut - more resources