. 2024 May 1;16(5):721.
doi: 10.3390/v16050721.

Epigenetic Modifications of White Blood Cell DNA Caused by Transient Fetal Infection with Bovine Viral Diarrhea Virus

Affiliations

Epigenetic Modifications of White Blood Cell DNA Caused by Transient Fetal Infection with Bovine Viral Diarrhea Virus

Hana Van Campen et al. Viruses. .

Abstract

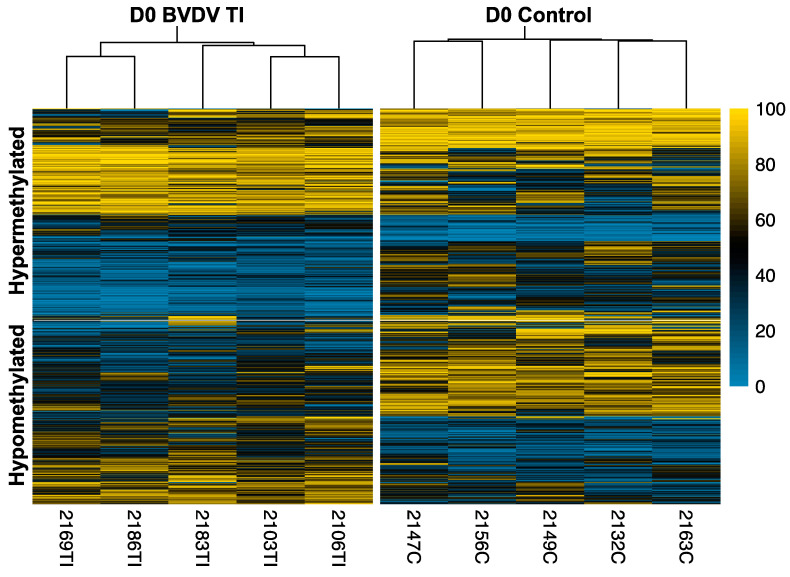
Bovine viral diarrhea virus (BVDV) infections cause USD 1.5-2 billion in losses annually. Maternal BVDV after 150 days of gestation causes transient fetal infection (TI) in which the fetal immune response clears the virus. The impact of fetal TI BVDV infections on postnatal growth and white blood cell (WBC) methylome as an index of epigenetic modifications was examined by inoculating pregnant heifers with noncytopathic type 2 BVDV or media (sham-inoculated controls) on Day 175 of gestation to generate TI (n = 11) and control heifer calves (n = 12). Fetal infection in TI calves was confirmed by virus-neutralizing antibody titers at birth and control calves were seronegative. Both control and TI calves were negative for BVDV RNA in WBCs by RT-PCR. The mean weight of the TI calves was less than that of the controls (p < 0.05). DNA methyl seq analysis of WBC DNA demonstrated 2349 differentially methylated cytosines (p ≤ 0.05) including 1277 hypomethylated cytosines, 1072 hypermethylated cytosines, 84 differentially methylated regions based on CpGs in promoters, and 89 DMRs in islands of TI WBC DNA compared to controls. Fetal BVDV infection during late gestation resulted in epigenomic modifications predicted to affect fetal development and immune pathways, suggesting potential consequences for postnatal growth and health of TI cattle.

Keywords: bovine viral diarrhea virus; epigenetics; immune system; intrauterine growth restriction; pathway analysis; transient infection.


Conflict of interest statement

The authors declare no conflicts of interest.

Figures

Figure 1
Figure 1
Control and TI heifer calf birth weights with mean (kg), *, p < 0.05.
Figure 2
Figure 2
Heatmap of 1072 hypermethylated and 1277 hypomethylated DMCs identified using logistic regression, using a chi-squared test and 25% methylation difference cut-off. Each column represents a replicate for controls and treatment. The horizontal axis shows clustering within the two groups. The yellow color palette indicates higher percent methylation and a density plot on the right shows the distribution of percent methylation values of the map.
Figure 3
Figure 3
The location and percentage of hyper- and hypomethylated DMCs on each chromosome.
Figure 4
Figure 4
Top twenty canonical pathways in IPA based on DMCs with the total number of DMCs listed. The bars indicate the percentage of hypermethylated genes (shown in green) and hypomethylated genes (shown in red) in the pathway.
Figure 5
Figure 5
Top upstream regulators and top diseases and functions in IPA based on DMCs. The # Molecules represent the total molecules in the pathway. The p-value refers to the upstream regulator or network identified. The p-value range is for each disease and biological function pathway listed. Values (1–9) underneath the graphic represent the −log10 (p-value). For example, a p-value of 1 × 10⁻⁸ represents a value of 9 [−log10 (p-value)] in the scale below the graphic. Symbols represent genes in the pathway with DMCs with p-values ranging from 0.001 to 1 × 10⁸. The DMC symbols with p-values less than 1 × 10⁹ are not shown in the graphic due to space limitations. The blue vertical line on the scale represents the median of the p-value exponents. If one or more p-values are < 10−10, then a single dot is shown at the right side of the scale.
Figure 6
Figure 6
Prediction Legend, Graphical Summary Legend, Network Shapes and Path Designer Shapes for Ingenuity Pathway Analysis. The double pink outlines around a shape indicate the gene is found in the DMC data. See IPA link for more details: https://qiagen.my.salesforce-sites.com/KnowledgeBase/articles/Knowledge/Legend, accessed on 1 March 2024).
Figure 7
Figure 7
T helper 1 Activation Pathway. There were 173 genes in this pathway with 6 downregulated (or hypermethylated) and 7 upregulated (or hypomethylated) genes. This T helper 1 Pathway overlaps on the upper right-hand side with the T helper cell Pathway described in Figure 8. Genes are predicted to change as indicated in the Prediction Legend (Figure 6).
Figure 8
Figure 8
T helper 2 Activation Pathway. Note overlap with Figure 7, in upper left hand side. Genes are predicted to change as indicated in the Prediction Legend (Figure 6).
Figure 9
Figure 9
The predicted effects of TI on Transcriptional Regulatory Network in Embryonic Stem Cells in IPA. There were 164 genes in this pathway with 9 downregulated (or hypermethylated) and 13 upregulated (or hypomethylated) genes. Genes are predicted to change as described in the Prediction Legend (Figure 6).
Figure 10
Figure 10
The predicted effects of TI on Human Embryonic Stem Cell Pluripotency in IPA. Genes are predicted to change as described in the Prediction Legend in Figure 6.
Figure 11
Figure 11
Role of Osteoblasts in Rheumatoid Arthritis Pathway. There were 234 genes in this pathway with 12 downregulated (or hypermethylated) and 12 upregulated (or hypomethylated) genes. Other genes are predicted to change as described in the Prediction Legend in Figure 6. Other predicted upregulated and downregulated genes affecting osteoclasts and chondrocytes in this pathway can be found in Figures S4 and S5.
Figure 12
Figure 12
Pathways containing CpGs in promoters predicted in IPA. The bars indicate the percentage of hypermethylated genes (shown in green) and hypomethylated genes (shown in red) in the pathway. The total number of CpGs is listed on the right.
Figure 13
Figure 13
B Cell Receptor Signaling Pathway, KEGG. Differentially methylated genes are marked with red stars, hypermethylated/downregulated genes are indicated by green arrows, and hypomethylated/upregulated genes are indicated by red arrows.
Figure 14
Figure 14
Graphical summary of the epigenetic modifications caused by transient BVDV fetal infection on the WBC methylome obtained at birth. Representative hypermethylated genes such as WNT, LIF, and FGFR are downregulated (indicated by the green arrows), negatively impacting fetal growth and organ development. These epigenetic changes are supported by an observed decrease in the mean weight of TI calves at birth compared to uninfected controls. Hypomethylated genes such as Notch1, CD8, and IL-11 (red arrows) are potentially upregulated due to the fetal immune response to BVDV infection. Activation of these genes with activation of the adaptive immune response is supported by the presence of BVDV-specific antibodies in serum and clearance of the virus by TI calves at birth.

Similar articles

Cited by

References

    1. Simmonds P., Becher B., Bukh J., Gould E.A., Meyers G., Monath T., Muerhoff S., Pletnev A., Rico-Hesse R., Smith D.B., et al. ICTV Report Consortium, ICTV Virus Taxonomy Profile: Flaviviridae. J. Gen. Virol. 2017;98:2–3. doi: 10.1099/jgv.0.000672. - DOI - PMC - PubMed
    1. Baker J.C. The clinical manifestations of bovine viral diarrhea infection. Vet. Clin. N. Am. Food Anim. Pract. 1995;11:425–445. doi: 10.1016/S0749-0720(15)30460-6. - DOI - PubMed
    1. Corapi W., Elliott R., French T., Arthur D., Bezek D., Dubovi E. Thrombocytopenia and hemorrhages in veal calves infected with bovine viral diarrhea virus. J. Am. Vet. Med. Assoc. 1990;196:590–596. doi: 10.2460/javma.1990.196.04.590. - DOI - PubMed
    1. Pellerin C., Van Den Hurk J., Lecomte J., Tijssen P. Identification of a new group of bovine viral diarrhea virus strains associated with severe outbreaks and high mortalities. Virology. 1994;203:260–268. doi: 10.1006/viro.1994.1483. - DOI - PubMed
    1. Bielefeldt-Ohmann H. The pathologies of bovine viral diarrhea virus infection: A window on the pathogenesis. Vet. Clin. N. Am. Food Anim. Pract. 1995;11:447–476. doi: 10.1016/S0749-0720(15)30461-8. - DOI - PMC - PubMed

Substances