. 2024 May 18;12(5):553.
doi: 10.3390/vaccines12050553.

A Low Number of Baselines γδ T Cells Increases the Risk of SARS-CoV-2 Post-Vaccination Infection

Affiliations

A Low Number of Baselines γδ T Cells Increases the Risk of SARS-CoV-2 Post-Vaccination Infection

Juan Carlos Andreu-Ballester et al. Vaccines (Basel). .

Abstract

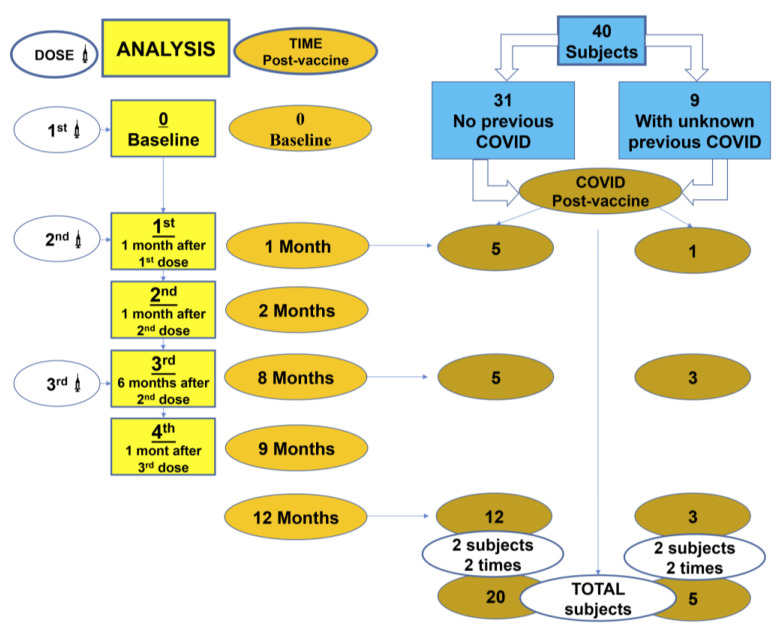
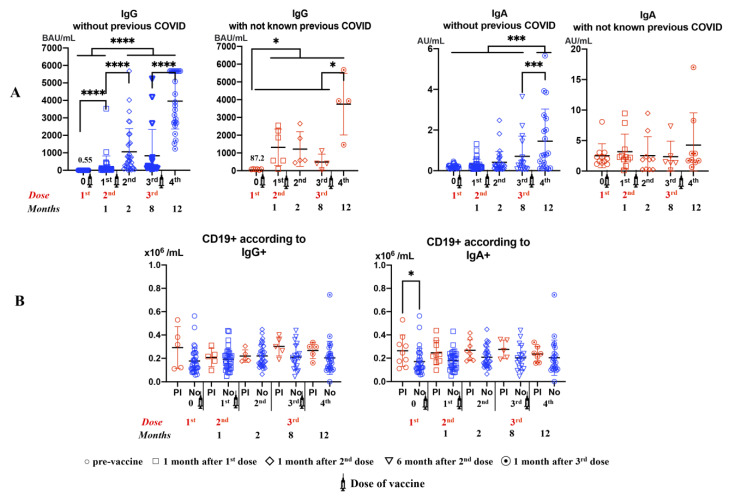
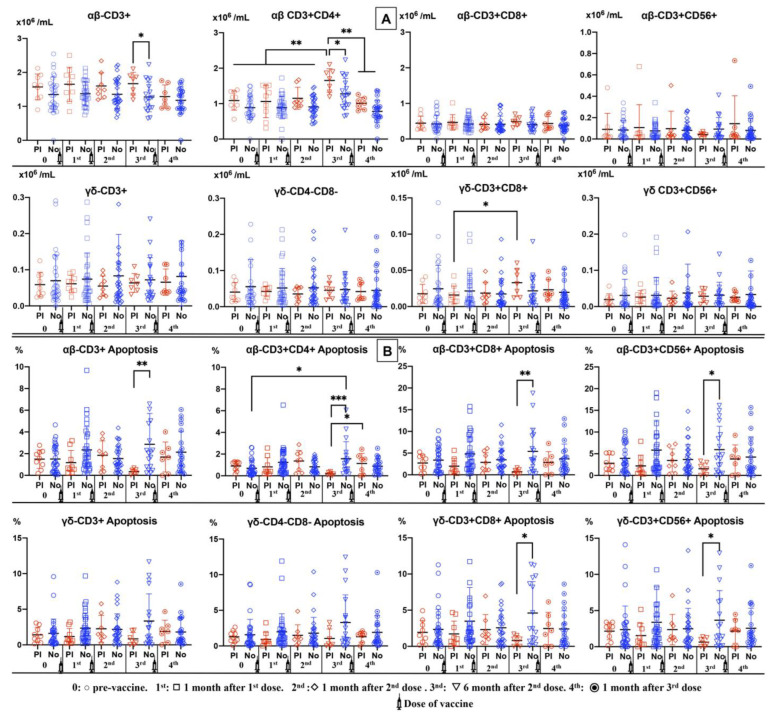
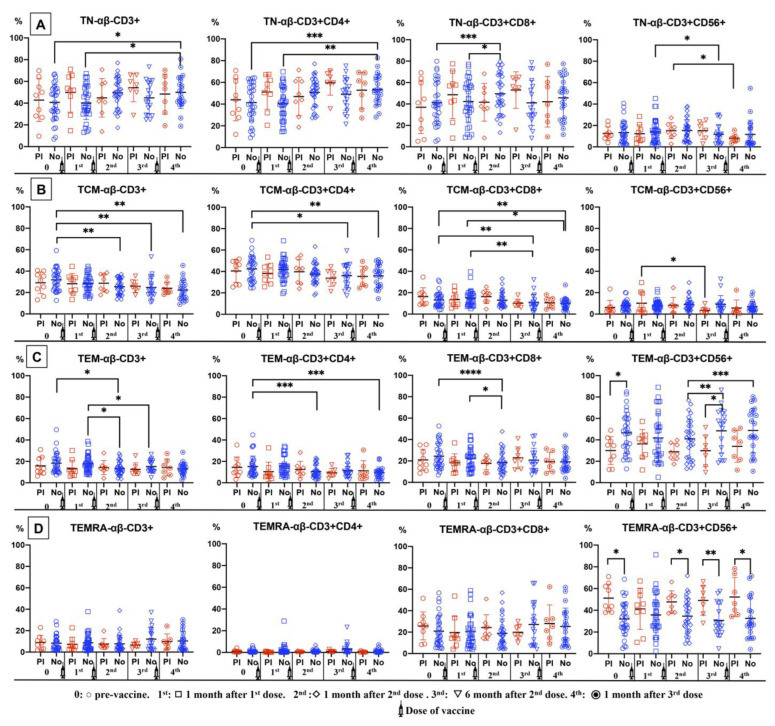
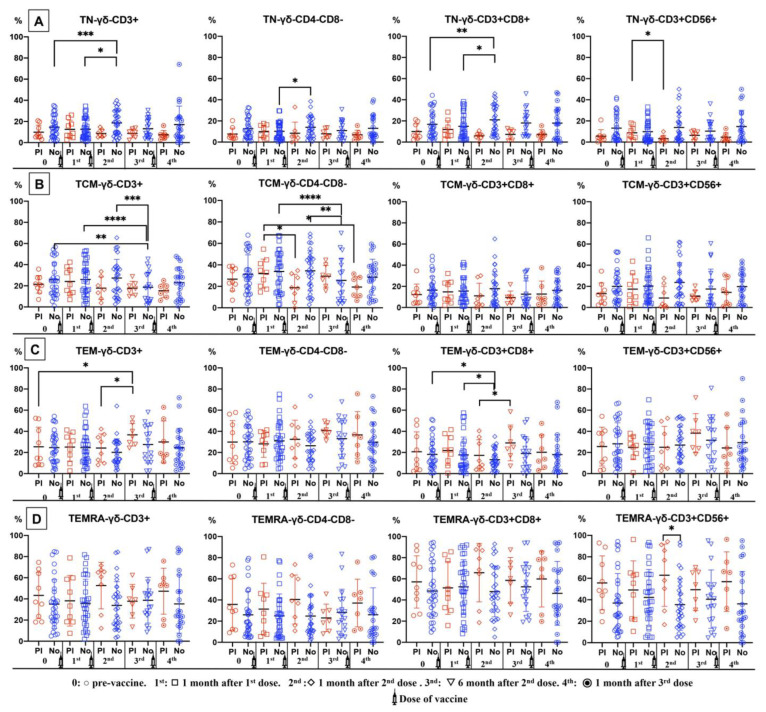
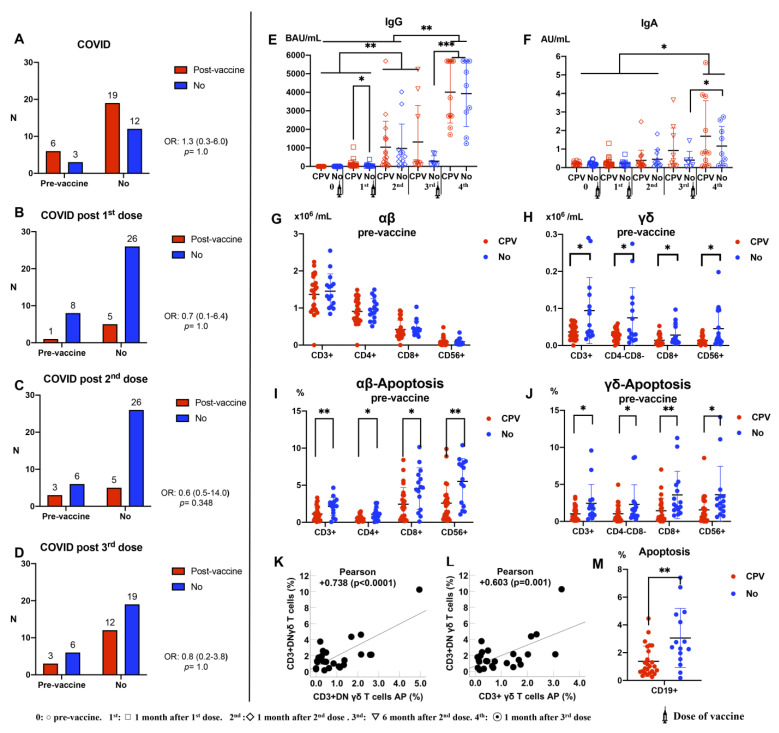
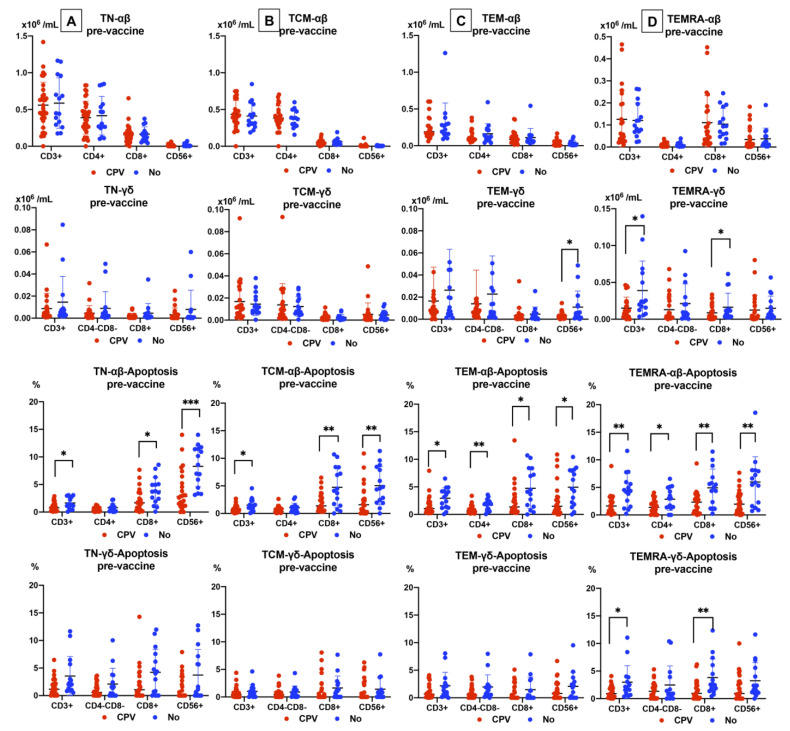
Background: The COVID-19 pandemic is the biggest global health problem in the last hundred years. The efficacy of the vaccine to protect against severe disease is estimated to be 70-95% according to the studies carried out, although there are aspects of the immune response to the vaccine that remain unclear. Methods: Humoral and cellular immunity after the administration of three doses of the Pfizer-BioNTech and Oxford AstraZeneca vaccines against SARS-CoV-2 over one year and the appearance of post-vaccination COVID-19 were studied. SARS-CoV-2 IgG and IgA antibodies, αβ and γδ T-cell subsets, and their differentiation stages and apoptosis were analyzed. Results: Anti-SARS-CoV-2 IgG and IgA antibodies showed a progressive increase throughout the duration of the study. This increase was the greatest after the third dose. The highest levels were observed in subjects who had anti-SARS-CoV-2 antibodies prior to vaccination. There was an increase in CD4+ αβ, CD8+ γδ and TEM CD8+ γδ T cells, and a decrease in apoptosis in CD4+ CD8+ and CD56+ αβ and γδ T cells. Post-vaccination SARS-CoV-2 infection was greater than 60%. The symptoms of COVID-19 were very mild and were related to a γδ T cell deficit, specifically CD8+ TEMRA and CD56+ γδ TEM, as well as lower pre-vaccine apoptosis levels. Conclusions: The results unveil the important role of γδ T cells in SARS-CoV-2-vaccine-mediated protection from the disease.

Keywords: SARS-CoV-2; antibodies; vaccine; αβ T cells; γδ T cells.


Conflict of interest statement

The authors declare no conflicts of interest.

Figures

Scheme 1
Scheme 1
Evolution time of vaccination and post-vaccination COVID-19 infection. Analysis: 0 (baseline), pre-vaccine; 1st: 1 month after the first dose; 2nd: 1 month after the second dose; 3rd: 6 months after the second dose; 4th: 1 month after the third dose.
Figure 1
Figure 1
(Panel A): SARS-CoV-2 IgG and IgA antibodies after vaccination. 0 = pre-vaccine; 1st: 1 month after the first dose; 2nd: 1 month after the second dose; 3rd: 6 months after the second dose; 4th: 1 month after the third dose. (Panel B): CD19+ B cells according to IgG- and IgA-positive pre-vaccination (PI) or not (No). The number B cells is expressed as the mean, and double T bars denote the standard deviation (* p < 0.05, *** p < 0.001, **** p < 0.0001). For the differences between five analyses, the Wilcoxon matched-pair signed rank test was used. For the differences between pre-infection (PI) and no infection (No), the Mann–Whitney U test was used.
Figure 2
Figure 2
Number (Panel A) and percentages (apoptosis) (Panel B) of αβ and γδ T-cell subsets (CD3+, CD3+CD4+, CD3+CD4-CD8-, CD3+CD56+) in the peripheral blood of subjects vaccinated against SARS-CoV-2, according to pre-anti-SARS-CoV-2 antibodies (PI) (red) or not (blue). Analysis during vaccination: 0 = pre-vaccine; 1st: 1 month after the first dose; 2nd: 1 month after the second dose; 3rd: 6 months after the second dose; 4th: 1 month after the third dose. A non-parametric Wilcoxon test was used to compare the evolution of antibodies of γδ T-cell subsets. The Mann–Whitney U test was used was used to compare the differences between pre-infection (PI) and no infection (No). Significance: * p < 0.05, ** p < 0.01, *** p < 0.001.
Figure 3
Figure 3
Percentages of αβ T-cell subsets (CD3+, CD3+CD4+, CD3+CD4-CD8-, CD3+CD56+) at differentiation stages (TN: naïve = Panel A, TCM: central memory = Panel B, TEM: effector memory = Panel C and TEMRA: terminal effector memory = Panel D) in the peripheral blood of subjects vaccinated against SARS-CoV-2, according to pre-infection (PI) (red) or no infection (blue). Analysis during vaccination: 0 = pre-vaccine; 1st: 1 month after the first dose; 2nd: 1 month after the second dose; 3rd: 6 months after the second dose; 4th: 1 month after the third dose. A non-parametric Wilcoxon test was used to compare the evolution of antibodies mean of αβ T-cell subsets. The Mann–Whitney U test was used was used to compare the differences between pre-infection (PI) and no infection (No). Significance: * p < 0.05, ** p < 0.01, *** p < 0.001, **** p < 0.0001.
Figure 4
Figure 4
Percentages of γδ T-cell subsets (CD3+, CD3+CD4+, CD3+CD4-CD8-, CD3+CD56+) at differentiation stages (TN: naïve = Panel A, TCM: central memory = Panel B, TEM: effector memory = Panel C, TEMRA: terminal effector memory = Panel D) in the peripheral blood of subjects vaccinated against SARS-CoV-2, according to pre-infection (PI) (red) or no infection (blue). Analysis during vaccination: 0 = pre-vaccine; 1st: 1 month after the first dose; 2nd: 1 month after the second dose; 3rd: 6 months after the second dose; 4th: 1 month after the third dose. A non-parametric Wilcoxon test was used to compare the evolution of antibodies of γδ T-cell subsets. The Mann–Whitney U test was used was used to compare the differences between pre-infection (PI) and no infection (No). Significance: * p < 0.05, ** p < 0.01, *** p < 0.001, **** p < 0.0001.
Figure 5
Figure 5
(A) Relationship between COVID-19 at some point during the vaccination period (COVID-19 post-vaccine (CPV)) (n = 25) and pre-vaccination anti-SARS-CoV-2. (B) Post-vaccine COVID-19 after the first dose. (C) Post-vaccine COVID-19 after the second dose. (D) Post-vaccine COVID-19 after the third dose. (E,F) IgG and IgA according to CPV (COVID-19 post-vaccine), respectively. (G,H) Pre-vaccine αβ-γδ T-cell subset number according to CPV (COVID-19 post-vaccine). (I,J) αβ-γδ T-cell subset apoptosis pre-vaccine according to CPV (COVID-19 post-vaccine). The U test was used to compare the differences between CPV and not. Significance: * p < 0.05, ** p < 0.01, *** p < 0.001. (K,L) Relationship between γδ T cells and apoptosis (n = 25) (Pearson’s test was used). DN = double-negative (CD4-CD8-). (M) Pre-vaccine B (CD19+)-cell subset number according to CPV (COVID-19 post-vaccine).
Figure 6
Figure 6
Differentiation stages of αβ-γδ T-cell subset number and apoptosis pre-vaccine according to CPV (COVID-19 post-vaccine). TN: naïve = Panel A, TCM: central memory = Panel B, TEM: effector memory = Panel C, TEMRA: terminal effector memory = Panel D. Significance: * p < 0.05, ** p < 0.01, *** p < 0.001.

Similar articles

References

    1. Blann A.D., Heitmar R. SARS-CoV-2 and COVID-19: A Narrative Review. Br. J. Biomed. Sci. 2022;79:10426. doi: 10.3389/bjbs.2022.10426. - DOI - PMC - PubMed
    1. Troiano G., Nardi A. Vaccine hesitancy in the era of COVID-19. Public Health. 2021;194:245–251. doi: 10.1016/j.puhe.2021.02.025. - DOI - PMC - PubMed
    1. Zheng C., Shao W., Chen X., Zhang B., Wang G., Zhang W. Real-world effectiveness of COVID-19 vaccines: A literature review and meta-analysis. Int. J. Infect. Dis. 2022;114:252–260. doi: 10.1016/j.ijid.2021.11.009. - DOI - PMC - PubMed
    1. Gutfreund M.C., Kobayashi T., Callado G.Y., Pardo I., Hsieh M.K., Lin V., Perencevich E.N., Salinas J.L., Edmond M.B., Mendonça E., et al. The effectiveness of the COVID-19 vaccines in the prevention of post-COVID conditions in children and adolescents: A systematic literature review and meta-analysis. Antimicrob. Steward. Healthc. Epidemiol. 2024;4:e54. doi: 10.1017/ash.2024.42. - DOI - PMC - PubMed
    1. Zhu C., Pang S., Liu J., Duan Q. Current Progress, Challenges and Prospects in the Development of COVID-19 Vaccines. Drugs. 2024;84:402–423. doi: 10.1007/s40265-024-02013-8. - DOI - PubMed