

RI2AP: Robust and Interpretable 2D Anomaly Prediction in Assembly Pipelines
- PMID: 38794098
- PMCID: PMC11125630
- DOI: 10.3390/s24103244
RI2AP: Robust and Interpretable 2D Anomaly Prediction in Assembly Pipelines
Abstract
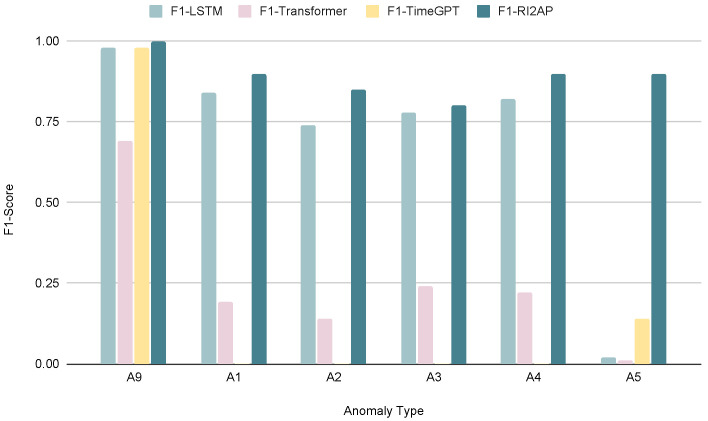
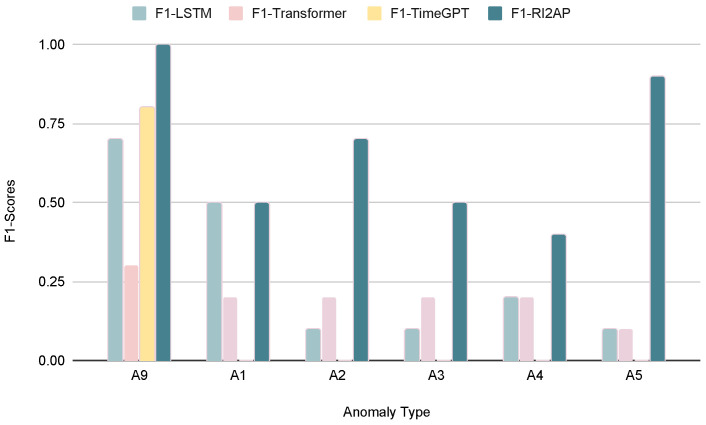
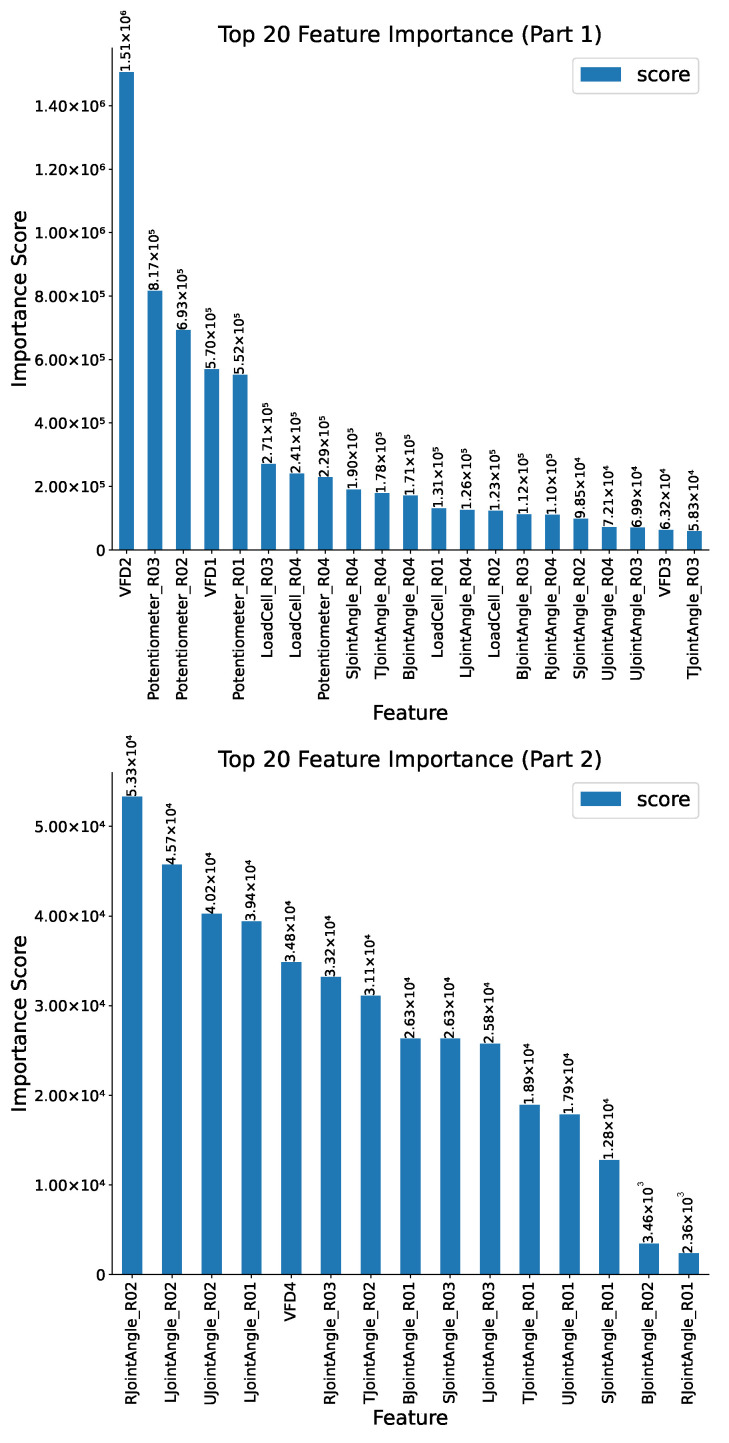
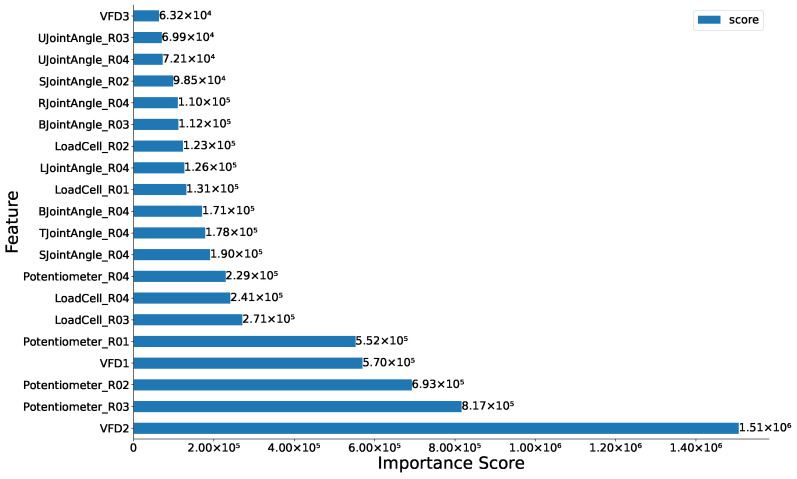
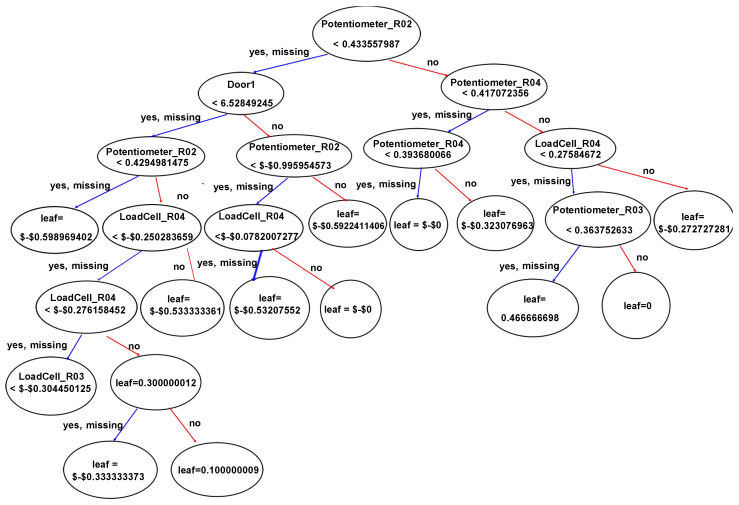
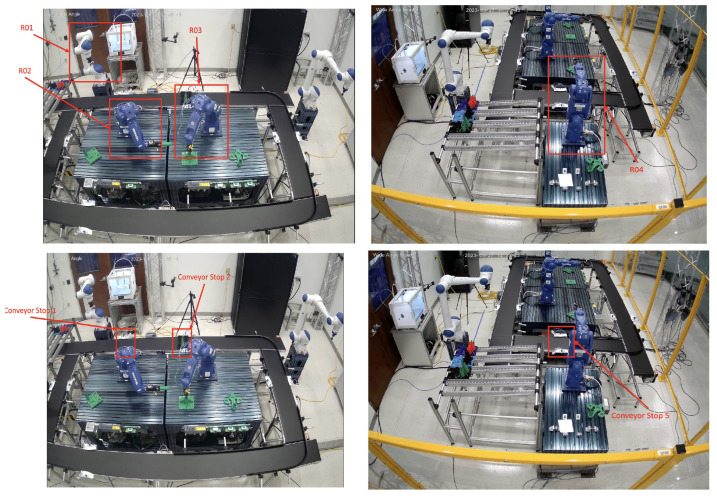
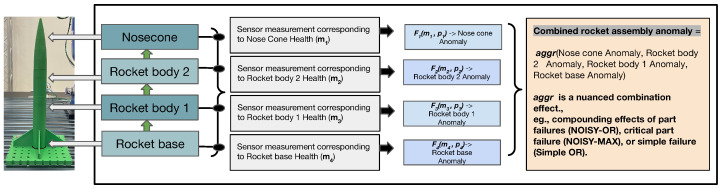
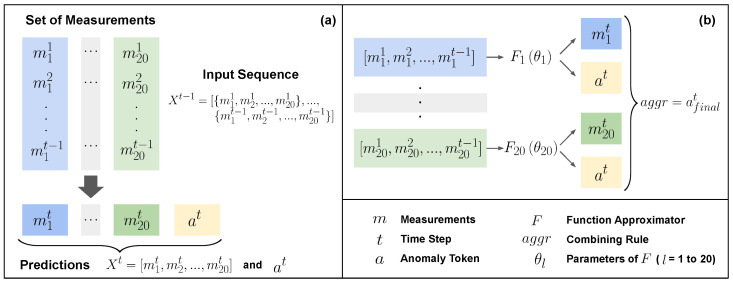
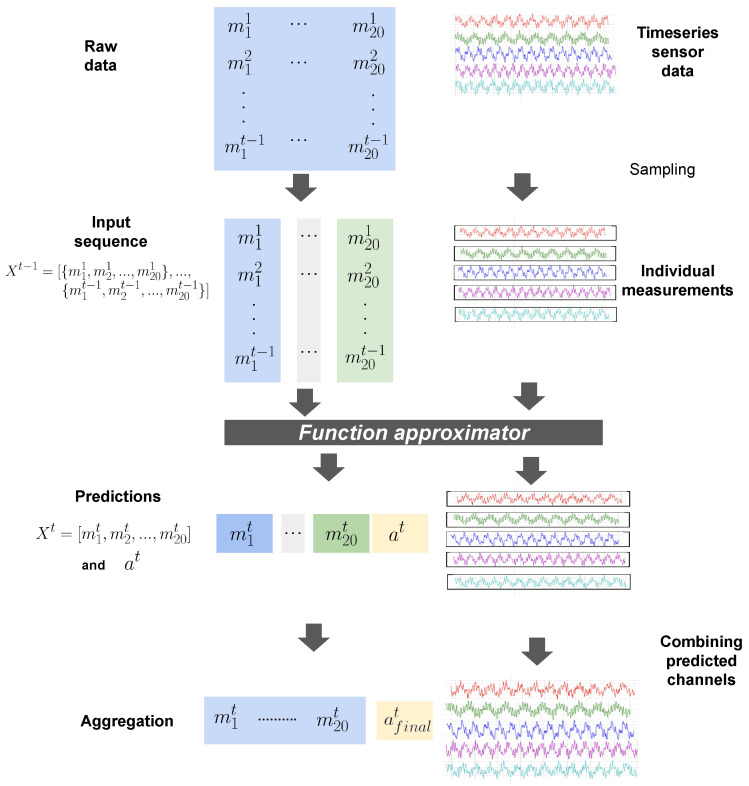
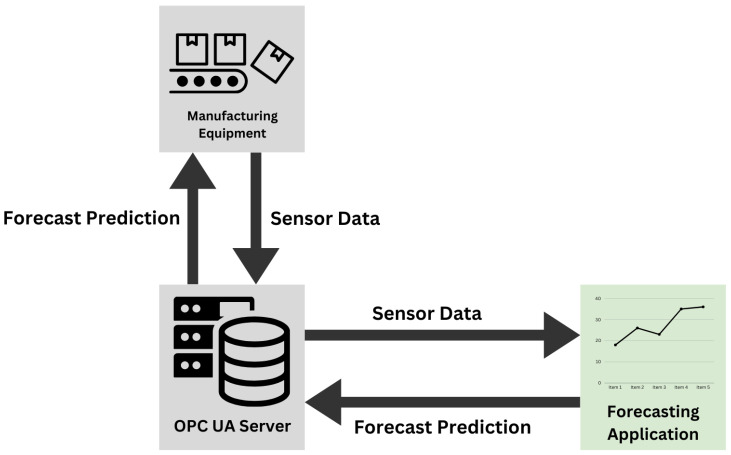
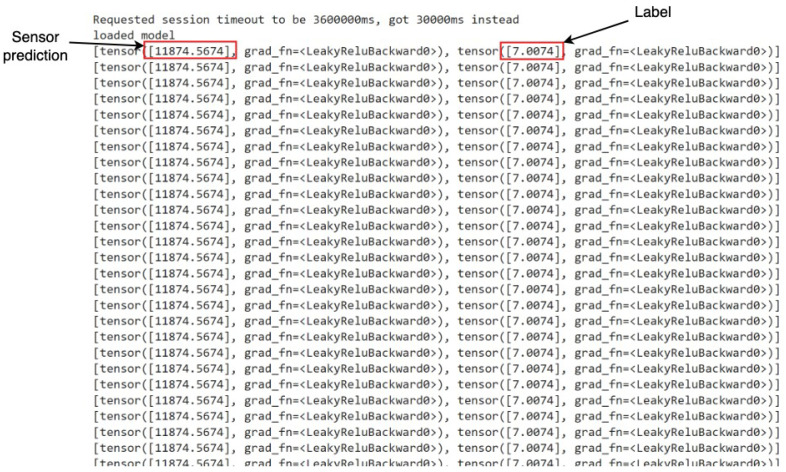
Predicting anomalies in manufacturing assembly lines is crucial for reducing time and labor costs and improving processes. For instance, in rocket assembly, premature part failures can lead to significant financial losses and labor inefficiencies. With the abundance of sensor data in the Industry 4.0 era, machine learning (ML) offers potential for early anomaly detection. However, current ML methods for anomaly prediction have limitations, with F1 measure scores of only 50% and 66% for prediction and detection, respectively. This is due to challenges like the rarity of anomalous events, scarcity of high-fidelity simulation data (actual data are expensive), and the complex relationships between anomalies not easily captured using traditional ML approaches. Specifically, these challenges relate to two dimensions of anomaly prediction: predicting when anomalies will occur and understanding the dependencies between them. This paper introduces a new method called Robust and Interpretable 2D Anomaly Prediction (RI2AP) designed to address both dimensions effectively. RI2AP is demonstrated on a rocket assembly simulation, showing up to a 30-point improvement in F1 measure compared to current ML methods. This highlights its potential to enhance automated anomaly prediction in manufacturing. Additionally, RI2AP includes a novel interpretation mechanism inspired by a causal-influence framework, providing domain experts with valuable insights into sensor readings and their impact on predictions. Finally, the RI2AP model was deployed in a real manufacturing setting for assembling rocket parts. Results and insights from this deployment demonstrate the promise of RI2AP for anomaly prediction in manufacturing assembly pipelines.
Keywords: anomaly prediction; assembly processes; sensor data; smart manufacturing; time series analysis.
Conflict of interest statement
The authors declare no conflicts of interest.
Figures
Similar articles
-
A two-step machine learning approach for predictive maintenance and anomaly detection in environmental sensor systems.MethodsX. 2025 Jan 28;14:103181. doi: 10.1016/j.mex.2025.103181. eCollection 2025 Jun. MethodsX. 2025. PMID: 39981060 Free PMC article.
-
Anomaly Detection and Inter-Sensor Transfer Learning on Smart Manufacturing Datasets.Sensors (Basel). 2023 Jan 2;23(1):486. doi: 10.3390/s23010486. Sensors (Basel). 2023. PMID: 36617091 Free PMC article.
-
Evaluating the Role of Data Enrichment Approaches towards Rare Event Analysis in Manufacturing.Sensors (Basel). 2024 Aug 2;24(15):5009. doi: 10.3390/s24155009. Sensors (Basel). 2024. PMID: 39124055 Free PMC article.
-
Discovering anomalies in big data: a review focused on the application of metaheuristics and machine learning techniques.Front Big Data. 2023 Aug 17;6:1179625. doi: 10.3389/fdata.2023.1179625. eCollection 2023. Front Big Data. 2023. PMID: 37663272 Free PMC article. Review.
-
Advancements of data anomaly detection research in wireless sensor networks: a survey and open issues.Sensors (Basel). 2013 Aug 7;13(8):10087-122. doi: 10.3390/s130810087. Sensors (Basel). 2013. PMID: 23966182 Free PMC article. Review.
References
-
- Tao F., Qi Q., Liu A., Kusiak A. Data-driven smart manufacturing. J. Manuf. Syst. 2018;48:157–169. doi: 10.1016/j.jmsy.2018.01.006. - DOI
-
- Oztemel E., Gursev S. Literature review of Industry 4.0 and related technologies. J. Intell. Manuf. 2020;31:127–182. doi: 10.1007/s10845-018-1433-8. - DOI
-
- Morariu C., Borangiu T. Time series forecasting for dynamic scheduling of manufacturing processes; Proceedings of the 2018 IEEE International Conference on Automation, Quality and Testing, Robotics (AQTR); Cluj-Napoca, Romania. 24–26 May 2018; pp. 1–6. - DOI
Grants and funding
LinkOut - more resources
Full Text Sources
