. 2024 May 9;16(5):638.
doi: 10.3390/pharmaceutics16050638.

Topotecan and Ginkgolic Acid Inhibit the Expression and Transport Activity of Human Organic Anion Transporter 3 by Suppressing SUMOylation of the Transporter

Affiliations

Topotecan and Ginkgolic Acid Inhibit the Expression and Transport Activity of Human Organic Anion Transporter 3 by Suppressing SUMOylation of the Transporter

Zhou Yu et al. Pharmaceutics. .

Abstract

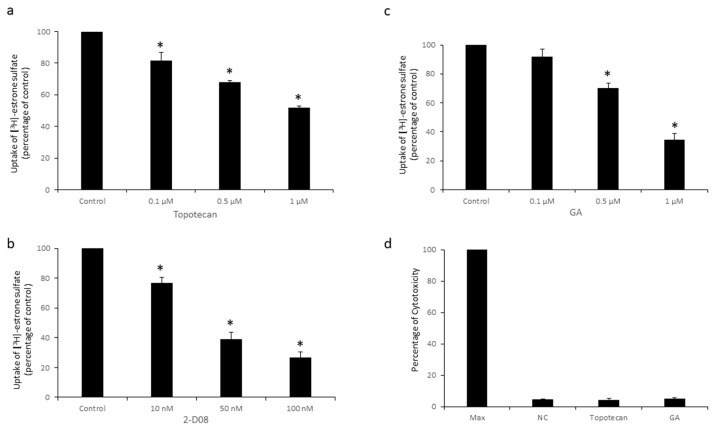
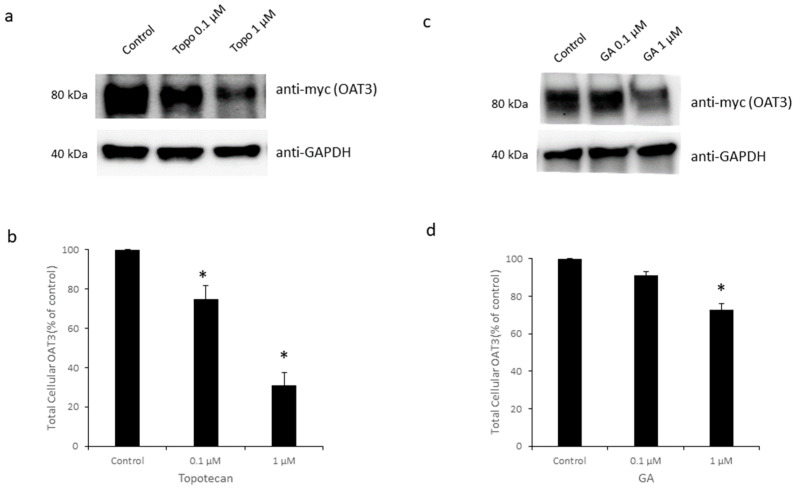
Organic anion transporter 3 (OAT3), expressed at the basolateral membrane of kidney proximal tubule cells, facilitates the elimination of numerous metabolites, environmental toxins, and clinically important drugs. An earlier investigation from our laboratory revealed that OAT3 expression and transport activity can be upregulated by SUMOylation, a post-translational modification that covalently conjugates SUMO molecules to substrate proteins. Topotecan is a semi-synthetic derivative of the herbal extract camptothecin, approved by the FDA to treat several types of cancer. Ginkgolic acid (GA) is one of the major components in the extract of Ginkgo biloba leaves that has long been used in food supplements for preventing dementia, high blood pressure, and supporting stroke recovery. Both topotecan and GA have been shown to affect protein SUMOylation. In the current study, we tested our hypothesis that topotecan and GA may regulate OAT3 SUMOylation, expression, and transport function. Our data show that the treatment of OAT3-expressing cells with topotecan or GA significantly decreases the SUMOylation of OAT3 by 50% and 75%, respectively. The same treatment also led to substantial reductions in OAT3 expression and the OAT3-mediated transport of estrone sulfate, a prototypical substrate. Such reductions in cell surface expression of OAT3 correlated well with an increased rate of OAT3 degradation. Mechanistically, we discovered that topotecan enhanced the association between OAT3 and the SUMO-specific protease SENP2, a deSUMOylation enzyme, which contributed to the significant decrease in OAT3 SUMOylation. In conclusion, this study unveiled a novel role of topotecan and GA in inhibiting OAT3 expression and transport activity and accelerating OAT3 degradation by suppressing OAT3 SUMOylation. During comorbidity therapies, the use of topotecan or Ginkgo biloba extract could potentially decrease the transport activity of OAT3 in the kidneys, which will in turn affect the therapeutic efficacy and toxicity of many other drugs that are substrates for the transporter.

Keywords: SUMOylation; drug transporter; organic anion transporter 3; post-translational modification; regulation; topotecan.


Conflict of interest statement

The authors declare no conflicts of interest.

Figures

Figure 1
Figure 1
Effects of Topotecan and GA on OAT3 SUMOylation. (a) Top Panel: cells expressing OAT3 were treated with topotecan (0.1 or 1 µM, 12 h). OAT3 was immunoprecipitated (IP) by an anti-myc antibody and immune detected (IB) by anti-SUMO2/3 to assess the level of OAT3 SUMOylation. Bottom panel: the same blot was re-probed with an anti-myc antibody to measure the amount of pulled-down OAT3. (b) The densitometry of results from Figure 1a and other repeats. Density values were normalized by total OAT3 pulled down. Values are mean ± S.D. (n = 3). * p < 0.05. (c) Top Panel: cells expressing OAT3 were treated with GA (0.1 or 1 µM, 6 h). OAT3 was immunoprecipitated (IP) by an anti-myc antibody, and immune detected (IB) with anti-SUMO2/3. Bottom panel: The same blot was re-probed with an anti-myc antibody to measure the amount of pulled-down OAT3. (d) The densitometry of results from Figure 1c and other repeats. Density values were normalized by total OAT3 pulled down. Values are mean ± S.D. (n = 3). * p < 0.05.
Figure 2
Figure 2
Effects of Topotecan and GA on OAT3 Transport Activity in COS-7 cells. (a) COS-7 cells stably expressing OAT3 were treated with multiple concentrations of topotecan (0.1–1 µM) for 12 h, followed by [3H]-ES uptake. Uptake activity was plotted as percentage of the values from control. The data represent uptake into OAT3-expressing cells minus uptake into parental cells. Values are mean ± S.D. (n = 3). * p < 0.05. (b) COS-7 cells stably expressing OAT3 were treated with various concentrations of GA (0.1–1 µM) for 6 h, followed by a [3H]-ES uptake assay. Values are mean ± S.D. (n = 3). * p < 0.05. (c) COS-7 cells expressing OAT3 were treated with various concentrations of 2-D08 (10–100 nM) for 6 h, followed by an uptake assay. Values are mean ± S.D. (n = 3). * p < 0.05. (d) Cytotoxicity was assessed using a cyQUANT LDH Cytotoxicity Assay after topotecan (12 h) or GA (6 h) treatment on OAT3-expressing COS-7 cells. Max, maximal LDH reading. NC, negative control. Values are mean ± S.D. (n = 3).
Figure 3
Figure 3
Effects of Topotecan and GA on OAT3 Transport Activity in HEK293 cells. (a) HEK293 cells stably expressing OAT3 were treated with multiple concentrations of topotecan (0.1–1 µM) for 12 h, followed by [3H]-ES uptake. Uptake activity was plotted as percentage of the uptake from control. The data represent uptake into OAT3-expressing cells minus uptake into parental cells. Values are mean ± S.D. (n = 3). * p < 0.05. (b) HEK293 cells expressing OAT3 were treated with various concentrations of GA (0.1–1 µM) for 6 h, followed by an uptake assay. Values are mean ± S.D. (n = 3). * p < 0.05.
Figure 4
Figure 4
The reversibility of Topotecan and GA on OAT3 Transport Activity. (a) COS-7 cells expressing OAT3 were treated with topotecan (1 µM) for 12 h and allowed to recover in DMEM medium in a cell incubator for 1–6 h, followed by a [3H]-ES uptake assay. Uptake activity was plotted as percentage of the uptake from control. The data represent uptake into OAT3-expressing cells minus uptake into parental cells. Values are mean ± S.D. (n = 3). (b) COS-7 cells expressing OAT3 were treated with GA (1 µM) for 6 h and allowed to recover in normal DMEM medium in a cell incubator for 1–6 h, followed by a [3H]-ES uptake assay. Values are mean ± S.D. (n = 3).
Figure 5
Figure 5
Effects of Topotecan and GA on OAT3 Expression at the Cell Surface. (a) Top panel: Topotecan on cell surface expression of OAT3. OAT3-expressing cells were treated with topotecan (0.1 or 1 µM, 12 h). After biotin labeling, cells were washed and lysed. Biotin-labeled proteins were captured by streptavidin resin. Immunoblotting (IB) was used to detect myc-tagged OAT3. Bottom panel: The same blot was re-probed with anti-E-cadherin. E-cadherin is a marker for cell membrane proteins. (b) Densitometry of Figure 5a and other repeats. Density values were normalized by E-cadherin. Values are mean ± S.D. (n = 3). * p < 0.05. (c) Top panel: GA on cell surface expression of OAT3. Cells expressing OAT3 were treated with GA (0.1 or 1 µM, 6 h). Bottom panel: the same blot was re-probed with anti-E-cadherin. (d) Densitometry of Figure 5c and other repeats. Density values were normalized by E-cadherin. Values are mean ± S.D. (n = 3). * p < 0.05.
Figure 6
Figure 6
Effects of Topotecan and GA on total protein expression of OAT3. (a) Top panel: Topotecan on total cellular expression of OAT3. Cells expressing OAT3 were treated with topotecan (0.1 or 1 µM, 12 h). The cells were lysed and immunodetected with an anti-myc antibody. Bottom panel: the same blot was re-probed with anti-GAPDH as a total protein marker. (b) The densitometry of Figure 6a and other repeats. Density values were normalized to control protein GAPDH. Values are mean ± S.D. (n = 3). * p < 0.05. (c) Top panel: GA on total cellular expression of OAT3. Bottom panel: the same blot was re-probed with anti-GAPDH. (d) The densitometry of Figure 6c and other repeats. Density values were normalized to GAPDH. Values are mean ± S.D. (n = 3). * p < 0.05.
Figure 7
Figure 7
Effects of Topo and GA on OAT3 stability. (a) OAT3-expressing cells were firstly biotin labeled and treated with 1 µM of topotecan for 3, 6, or 9 h under normal culture conditions. The degradation rate of OAT3 was measured as described in “Materials and Methods”. (b) The densitometry of Figure 7a and other repeats. The undegraded OAT3 was displayed as a percentage of the amount of initial OAT3. Values are mean ± S.D. (n = 3). * p < 0.05. (c) OAT3-expressing cells were biotin labeled and treated with 1 µM of GA for 2, 4, or 6 h under normal culture conditions. The degradation rate of OAT3 was then measured. (d) The densitometry of Figure 7c and other repeats. The undegraded OAT3 was displayed as a percentage of the amount of initial OAT3. Values are mean ± S.D. (n = 3). * p < 0.05.
Figure 8
Figure 8
Effects of Topotecan on Ubc9. (a) Top Panel: cells expressing OAT3 were treated with topotecan (1 µM, 12 h) and lysed, followed by immunoblotting (IB) with anti-Ubc9 to detect endogenous Ubc9 in the whole-cell lysate. Bottom panel: the same blot was re-probed with anti-GAPDH to assess the total protein marker GAPDH. (b) The densitometry of Figure 8a and other repeats. Density values were normalized to GAPDH. Values are mean ± S.D. (n = 3). ns, not significant. (c) Top Panel: Cells expressing OAT3 were treated with topotecan (1 µM, 12 h). OAT3 was immunoprecipitated (IP) by an anti-myc antibody, followed by immunoblotting (IB) with anti-Ubc9 to assess endogenous Ubc9 that bound to OAT3. Bottom panel: The same blot was re-probed with an anti-myc antibody to assess the amount of OAT3 pulled down. (d) The densitometry of Figure 8c and other repeats. Density values were normalized to total OAT3 pulled down. Values are mean ± S.D. (n = 3). ns, not significant.
Figure 9
Figure 9
Effects of Topotecan on SENP2. (a) Top Panel: cells expressing OAT3 were treated with topotecan (1 µM, 12 h) and lysed, followed by immunoblotting (IB) with anti-SENP2 to measure endogenous SENP2 in the whole-cell lysate. Bottom panel: The same blot was re-probed with anti-GAPDH to detect the total protein marker GAPDH. (b) The densitometry of Figure 9a and other repeats. Density values were normalized to GAPDH. Values are mean ± S.D. (n = 3). ns, not significant. (c) Top Panel: Cells expressing OAT3 were treated with topotecan (1 µM, 12 h). OAT3 was immunoprecipitated (IP) first and immunoblotted (IB) with anti-SENP2 to detect SENP2 that bound to OAT3. Bottom panel: The same blot was re-probed with an anti-myc antibody to assess the total amount of OAT3 pulled down. (d) The densitometry of Figure 9c and other repeats. Density values were normalized to total pulled-down OAT3. Values are mean ± S.D. (n = 3). * p < 0.05.
Figure 10
Figure 10
Effects of Topotecan and GA on the SUMOylation, Protein Expression, and Transport Activity of OAT3.

Similar articles

Cited by

References

    1. Czuba L.C., Hillgren K.M., Swaan P.W. Post-Translational Modifications of Transporters. Pharmacol. Ther. 2018;192:88–99. doi: 10.1016/j.pharmthera.2018.06.013. - DOI - PMC - PubMed
    1. Lee W., Ha J., Sugiyama Y. Post-Translational Regulation of the Major Drug Transporters in the Families of Organic Anion Transporters and Organic Anion–Transporting Polypeptides. J. Biol. Chem. 2020;295:17349–17364. doi: 10.1074/jbc.REV120.009132. - DOI - PMC - PubMed
    1. Zhang J., Wang H., Fan Y., Yu Z., You G. Regulation of Organic Anion Transporters: Role in Physiology, Pathophysiology, and Drug Elimination. Pharmacol. Ther. 2021;217:107647. doi: 10.1016/j.pharmthera.2020.107647. - DOI - PMC - PubMed
    1. Wang L., Sweet D.H. Interaction of Natural Dietary and Herbal Anionic Compounds and Flavonoids with Human Organic Anion Transporters 1 (SLC22A6), 3 (SLC22A8), and 4 (SLC22A11) Evid.-Based Complement. Altern. Med. 2013;2013:612527. doi: 10.1155/2013/612527. - DOI - PMC - PubMed
    1. Yee S.W., Giacomini K.M. Emerging Roles of the Human Solute Carrier 22 Family. Drug Metab. Dispos. 2022;50:1193–1210. doi: 10.1124/dmd.121.000702. - DOI - PMC - PubMed

LinkOut - more resources