

A Diverging Species within the Stewartia gemmata (Theaceae) Complex Revealed by RAD-Seq Data
- PMID: 38794366
- PMCID: PMC11124813
- DOI: 10.3390/plants13101296
A Diverging Species within the Stewartia gemmata (Theaceae) Complex Revealed by RAD-Seq Data
Abstract
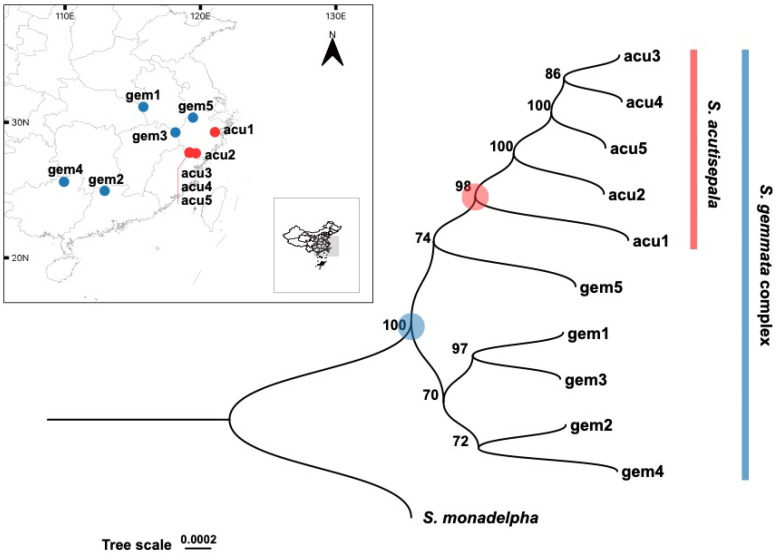
Informed species delimitation is crucial in diverse biological fields; however, it can be problematic for species complexes. Showing a peripatric distribution pattern, Stewartia gemmata and S. acutisepala (the S. gemmata complex) provide us with an opportunity to study species boundaries among taxa undergoing nascent speciation. Here, we generated genomic data from representative individuals across the natural distribution ranges of the S. gemmata complex using restriction site-associated DNA sequencing (RAD-seq). Based on the DNA sequence of assembled loci containing 41,436 single-nucleotide polymorphisms (SNPs) and invariant sites, the phylogenetic analysis suggested strong monophyly of both the S. gemmata complex and S. acutisepala, and the latter was nested within the former. Among S. gemmata individuals, the one sampled from Mt. Tianmu (Zhejiang) showed the closest evolutionary affinity with S. acutisepala (which is endemic to southern Zhejiang). Estimated from 2996 high-quality SNPs, the genetic divergence between S. gemmata and S. acutisepala was relatively low (an Fst of 0.073 on a per-site basis). Nevertheless, we observed a proportion of genomic regions showing relatively high genetic differentiation on a windowed basis. Up to 1037 genomic bins showed an Fst value greater than 0.25, accounting for 8.31% of the total. After SNPs subject to linkage disequilibrium were pruned, the principal component analysis (PCA) showed that S. acutisepala diverged from S. gemmata along the first and the second PCs to some extent. By applying phylogenomic analysis, the present study determines that S. acutisepala is a variety of S. gemmata and is diverging from S. gemmata, providing empirical insights into the nascent speciation within a species complex.
Keywords: RAD-seq; nascent species; peripatric distribution; phylogenomic analysis; taxonomic implication.
Conflict of interest statement
The authors declare no conflicts of interest.
Figures


References
-
- Darwin C. On the Origin of Species by Means of Natural Selection. John Murray; London, UK: 1859.
-
- Mayr E. Systematics and the Origin of Species. Columbia University Press; New York, NY, USA: 1942.
-
- Simpson G.G. The species concept. Evolution. 1951;5:285–298. doi: 10.2307/2405675. - DOI
-
- Michener C.D. Diverse approaches to systematics. Evol. Biol. 1970;4:1–38.
-
- Van Valen L. Ecological species, multispecies, and oaks. Taxon. 1976;25:233–239. doi: 10.2307/1219444. - DOI
Grants and funding
LinkOut - more resources
Full Text Sources
Miscellaneous
