. 2024 Dec 20;40(1):133-150.
doi: 10.1093/ndt/gfae118.

Propionate and butyrate counteract renal damage and progression to chronic kidney disease

Affiliations

Propionate and butyrate counteract renal damage and progression to chronic kidney disease

Viviana Corte-Iglesias et al. Nephrol Dial Transplant. .

Abstract

Background: Short-chain fatty acids (SCFAs), mainly acetate, propionate and butyrate, are produced by gut microbiota through fermentation of complex carbohydrates that cannot be digested by the human host. They affect gut health and can contribute at the distal level to the pathophysiology of several diseases, including renal pathologies.

Methods: SCFA levels were measured in chronic kidney disease (CKD) patients (n = 54) at different stages of the disease, and associations with renal function and inflammation parameters were examined. The impact of propionate and butyrate in pathways triggered in tubular cells under inflammatory conditions was analysed using genome-wide expression assays. Finally, a pre-clinical mouse model of folic acid-induced transition from acute kidney injury to CKD was used to analyse the preventive and therapeutic potential of these microbial metabolites in the development of CKD.

Results: Faecal levels of propionate and butyrate in CKD patients gradually reduce as the disease progresses, and do so in close association with established clinical parameters for serum creatinine, blood urea nitrogen and the estimated glomerular filtration rate. Propionate and butyrate jointly downregulated the expression of 103 genes related to inflammatory processes and immune system activation triggered by tumour necrosis factor-α in tubular cells. In vivo, the administration of propionate and butyrate, either before or soon after injury, respectively, prevented and slowed the progression of damage. This was indicated by a decrease in renal injury markers, the expression of pro-inflammatory and pro-fibrotic markers, and recovery of renal function over the long term.

Conclusions: Propionate and butyrate levels are associated with a progressive loss of renal function in CKD patients. Early administration of these SCFAs prevents disease advancement in a pre-clinical model of acute renal damage, demonstrating their therapeutic potential independently of the gut microbiota.

Keywords: AKI-to-CKD transition; acute kidney injury; fibrosis; inflammation; short-chain fatty acids.


Conflict of interest statement

The authors have no conflicts of interest to declare.

Figures

Graphical Abstract
Graphical Abstract
Figure 1:
Figure 1:
Faecal levels of propionic (Prop) and butyric (But) acids are decreased in CKD patients. SCFAs (acetic, Prop, But, Prop + But) and BCFAs (isobutyric and isovaleric acids) were quantified in faecal samples from patients at KDIGO stages 3a (n = 7), 3b (n = 21), 4 (n = 16) and 5 (n = 10). Values for each patient are shown as absolute numbers. Stage results are represented as the mean ± SD. Groups were compared using the Kruskal–Wallis test; values of P < .05 were considered significant (*).
Figure 2:
Figure 2:
Correlation between propionic and butyric acids levels and clinical parameters in CKD patients. The associations between the absolute concentration of propionic or butyric acid and the levels of eGFR, creatinine, BUN and ACR were determined in all CKD patients (n = 54) at different stages of their disease. Spearman correlation coefficients were calculated; values of P < .05 were considered statistically significant (*).
Figure 3:
Figure 3:
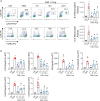
Propionate (Prop) and butyrate (But) modulate transcriptional profiles induced by TNF-α (TN) in TECs. HK2 cells were treated with Prop (15 mM) or But (3 mM) for 24 h before induction with TNF-α (5 ng/mL) for 3 h. RNA sequencing was conducted in duplicate under basal conditions (control group, Ctrl), after TNF-α induction, and in samples pre-treated with Prop (PRTN) and But (BUTN) before TNF-α induction. (A) Principal component (PC) analysis of gene expression profiles (two biological replicates) of the sequenced samples. (B) Volcano plots of the TN vs Ctrl comparison showing the differentially expressed genes (DEGs). Downregulated genes (n = 448) are shown in blue and upregulated genes (n = 338) in red if they fulfil the criteria of >1.5-fold change (fc) and adjusted P-value <.05. Some of the most significant DEGs are indicated. (C) Venn diagrams showing the upregulated genes for the two comparisons [TN vs Ctrl and PRTN vs Ctrl or BUTN vs Ctrl; >1.5-fold change (fc) and adjusted P < .05] to identify the genes induced by TNF-α that are not increased in the presence of Prop or But. (D) Histogram of the 10 most significant biological process, according to the Gene Ontology (GO) functional enrichment analysis with the DAVID database, of the 147 common genes induced by TNF-α (TN) and that are not increased in the presence of Prop (PRTN) or But (BUTN).
Figure 4:
Figure 4:
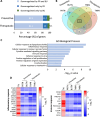
Similar preventive and therapeutic effects of propionate (Prop) and butyrate (But) treatment under inflammatory conditions. HK2 cells were treated with Prop (15 mM) or But (3 mM) for 24 h, before (preventive effect, PRTN or BUTN) or after (therapeutic effect, TNPR or TNBU) inflammation induction with TNF-α (5 ng/mL) for 3 h. Whole-genome RNA sequencing was performed. (A) Histogram showing the percentage of genes downregulated by Prop, But or both in preventive and therapeutic treatments. (B) Venn diagram showing the comparisons among genes downregulated by Prop or But under preventive and therapeutic conditions. (C) Histograms of the ten most significant biological processes determined by Gene Ontology (GO) functional enrichment analysis of the 103 common genes regulated by propionate and butyrate, in both preventive and therapeutic treatments. (D) Heatmaps of the ‘inflammatory response’ and ‘immune response’ biological processes showing the upregulated genes (red) with TNF-α (TN) and downregulated genes (blue) by Prop and But (PRTN, BUTN, TNPR, TNBU). Data are shown as the log2 fold change (FC) of each experimental condition compared with control (untreated cells).
Figure 5:
Figure 5:
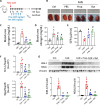
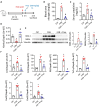
Administration of propionate (Prop) and butyrate (But) after acute damage restores renal function and injury markers. (A) Graphic representation of the AKI-to-CKD transition mouse model induced by high doses of folic acid (250 mg/kg) and ip administration of Prop (200 mg/kg) and But (500 mg/kg), beginning 3 h after damage and continuing for 5 consecutive days. Renal function and kidneys were analysed at Day +45 in the following groups: control (Ctrl; n = 6), folic acid nephropathy (FAN; n = 6), FAN pre-treated with Prop (Prop + FAN; n = 8) and FAN pre-treated with But (But + FAN; n = 8). (B) Representative images of kidneys from the different groups. Determinations of the BUN at early time, 48 h (C), and at long term, 45 days (D), and measurement of the transcutaneous GFR at Day +45 (E) (n = 4 mice per group). Expression of the renal damage markers KIM-1 and NGAL from each group by RT-PCR (F) and western blotting (G) analyses (n = 6–8 mice per group). Gapdh and vinculin were used as endogenous controls for each respective assay. Data are shown as the mean ± SD. *P < .05 vs Ctrl; #P < .05 vs FAN as determined by the Mann–Whitney test.
Figure 6:
Figure 6:
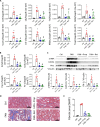
Early administration of propionate (Prop) and butyrate (But) after renal damage limits progression to CKD. Mice were treated with high doses of folic acid (250 mg/kg) and 3 h after damage Prop (200 mg/kg) and But (500 mg/kg) were administered over the next 5 days. Kidneys were examined at Day +45 in the following groups: control (Ctrl; n = 6), folic acid nephropathy (FAN; n = 6), FAN pre-treated with Prop (Prop + FAN; n = 8) and FAN pre-treated with But (But + FAN; n = 8). (A) Transcriptional expression of pro-inflammatory molecules in kidney tissue analysed by RT-PCR (n = 6-8 mice per group). Expression of fibrosis markers by RT-PCR (B) and western blot (C) in kidney tissue (n = 6-8 mice per group). Gapdh and vinculin were used as endogenous controls for the respective assays. (D, E) Representative images (40× magnification) of Masson's trichrome staining at Day +45 in the different groups and the corresponding quantification of their fibrotic areas (%HPF, high-power field). Scale bar is indicated in the images. *P < .05 vs Ctrl; #P < .05 vs FAN as determined by the Mann–Whitney test. Data are shown as the mean ± SD.
Figure 7:
Figure 7:
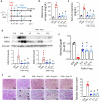
Therapeutic window of propionate (Prop) to revert initial renal damage. (A) Graphic representation of the renal damage mouse model induced by high doses of folic acid (250 mg/kg). Prop (200 mg/kg) was ip administered 3 h, 6 h and 12 h after folic acid, and parameters were analysed 24 h after initial damage. Groups: control (Ctrl; n = 3), folic acid nephropathy (FAN; n = 5), FAN + Prop 3h (n = 4), FAN + Prop 6h (n = 5) and FAN + Prop 12h (n = 5). Quantification of the serum levels of BUN (B) and creatinine (C). (D) Determination of protein levels of the renal injury markers KIM-1 and NGAL in kidney tissue by western blotting. Vinculin was used as an endogenous control. (E) Quantification of transcriptional levels of klotho (Kl). Gapdh was used as an endogenous control. (F) Representative images of periodic acid–Schiff-stained sections (upper panel = 20×; bottom panel = 40× magnification) and quantification of the damage in the different groups. Scale bars are indicated in the images. Arrows indicate presence of tubular casts, cell desquamation, microhematuria and loss of brush border. Data are shown as the mean ± SD. *P < .05 vs Ctrl; #P < .05 vs FAN as determined by the Mann–Whitney test.
Figure 8:
Figure 8:
Propionate (Prop) decreases immune cell infiltration and inflammation shortly after kidney damage. (A) Determination by flow cytometry analysis of the number of neutrophils and monocytes infiltrating the kidney in the mouse groups: control (Ctrl; n = 3), folic acid nephropathy (FAN; n = 5), FAN + Prop 3h (n = 4), FAN + Prop 6h (n = 5) and FAN + Prop 12h (n = 5). The left panels show representative dot plots of each group, and numbers indicate the percentage of neutrophils or monocytes from parental cells. Complete gating strategy is shown in Supplementary data, Fig. S9. The right histograms represent the quantification of the total cell number, neutrophils or monocytes, per kidney. (B) Expression of pro-inflammatory molecules in kidney tissue analysed by RT-PCR in the different groups. Gapdh was used as an endogenous control (n = 3–5 mice per group). Data are shown as the mean ± SD. *P < .05 vs Ctrl; #P < .05 vs FAN as determined by the Mann–Whitney test.
Figure 9:
Figure 9:
Propionate (Prop) and butyrate (But) alleviate renal damage independently of the gut microbiota. (A) Graphic representation of the renal damage model induced in mice pre-treated with broad-spectrum antibiotics (Ab mix) for 2 weeks, followed by ip administration of a high dose of folic acid (250 mg/kg) and Prop (200 mg/kg, 3 h after FA). Mice were sacrificed 24 h after damage. Groups: control (Ctrl; n = 3–5), folic acid nephropathy (FAN; n = 4–5), FAN treated with Prop (FAN + Prop; n = 5). Quantification of the serum levels of BUN (B) and creatinine (C). (D) Quantification of the transcriptional levels of klotho. (E) Determination of protein levels of the renal injury markers KIM-1 and NGAL in kidney tissue by western blotting. (F) Expression of pro-inflammatory molecules in kidney tissue analysed by RT-PCR in the different groups. Gapdh and vinculin were used as endogenous controls for RT-PCR and western blotting, respectively. Data are shown as the mean ± SD. *P < .05 vs Ctrl; #P < .05 vs FAN as determined by the Mann–Whitney test.

References

    1. Jager KJ, Kovesdy C, Langham Ret al. . A single number for advocacy and communication-worldwide more than 850 million individuals have kidney diseases. Nephrol Dial Transplant 2019;34:1803–5. 10.1093/ndt/gfz174 - DOI - PubMed
    1. Ortiz A. RICORS2040: the need for collaborative research in chronic kidney disease. Clin Kidney J 2022;15:372–87. 10.1093/ckj/sfab170 - DOI - PMC - PubMed
    1. Kurzhagen JT, Dellepiane S, Cantaluppi Vet al. . AKI: an increasingly recognized risk factor for CKD development and progression. J Nephrol 2020;33:1171–87. 10.1007/s40620-020-00793-2 - DOI - PubMed
    1. Gerhardt LMS, Koppitch K, van Gestel Jet al. . Lineage tracing and single-nucleus multiomics reveal novel features of adaptive and maladaptive repair after acute kidney injury. J Am Soc Nephrol 2023;34:554–71. 10.1681/ASN.0000000000000057 - DOI - PMC - PubMed
    1. Hu EA, Coresh J, Anderson CAMet al. . Adherence to healthy dietary patterns and risk of CKD progression and all-cause mortality: findings from the CRIC (Chronic Renal Insufficiency Cohort) Study. Am J Kidney Dis 2021;77:235–44. 10.1053/j.ajkd.2020.04.019 - DOI - PMC - PubMed

MeSH terms