. 2024 May 25;22(1):285.
doi: 10.1186/s12951-024-02518-0.

Exosome-sheathed porous silica nanoparticle-mediated co-delivery of 3,3'-diindolylmethane and doxorubicin attenuates cancer stem cell-driven EMT in triple negative breast cancer

Affiliations

Exosome-sheathed porous silica nanoparticle-mediated co-delivery of 3,3'-diindolylmethane and doxorubicin attenuates cancer stem cell-driven EMT in triple negative breast cancer

Rupali Sarkar et al. J Nanobiotechnology. .

Abstract

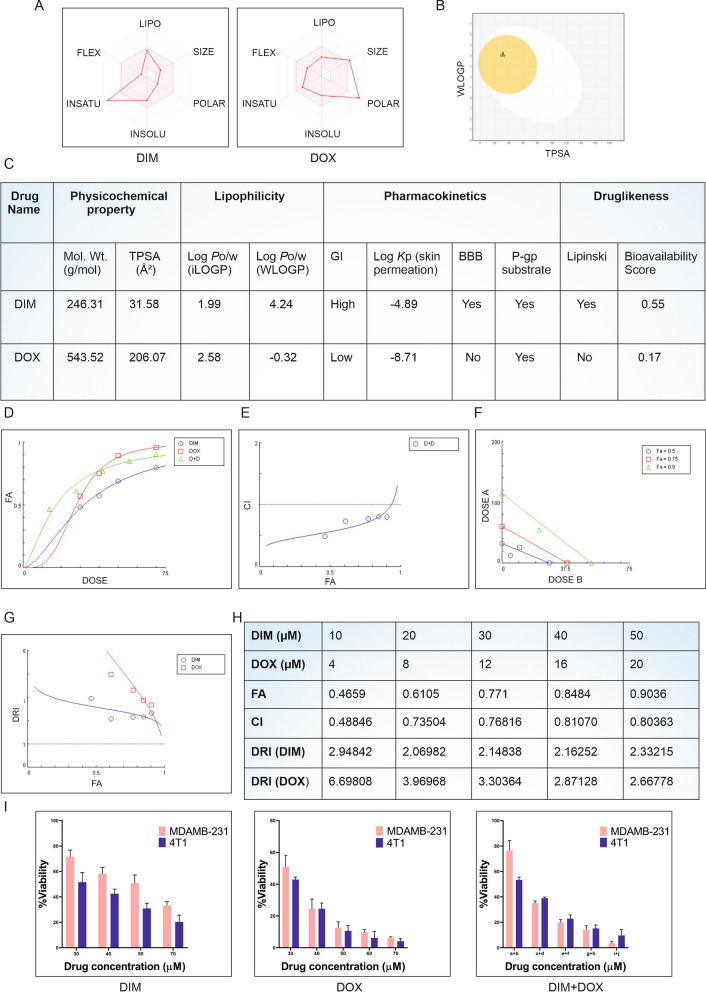
Background: Therapeutic management of locally advanced and metastatic triple negative breast cancer (TNBC) is often limited due to resistance to conventional chemotherapy. Metastasis is responsible for more than 90% of breast cancer-associated mortality; therefore, the clinical need to prevent or target metastasis is immense. The epithelial to mesenchymal transition (EMT) of cancer stem cells (CSCs) is a crucial determinant in metastasis. Doxorubicin (DOX) is the frequently used chemotherapeutic drug against TNBC that may increase the risk of metastasis in patients. After cancer treatment, CSCs with the EMT characteristic persist, which contributes to advanced malignancy and cancer recurrence. The latest developments in nanotechnology for medicinal applications have raised the possibility of using nanomedicines to target these CSCs. Hence, we present a novel approach of combinatorial treatment of DOX with dietary indole 3,3'-diindolylmethane (DIM) which is an intriguing field of research that may target CSC mediated EMT induction in TNBC. For efficient delivery of both the compounds to the tumor niche, advance method of drug delivery based on exosomes sheathed with mesoporous silica nanoparticles may provide an attractive strategy.

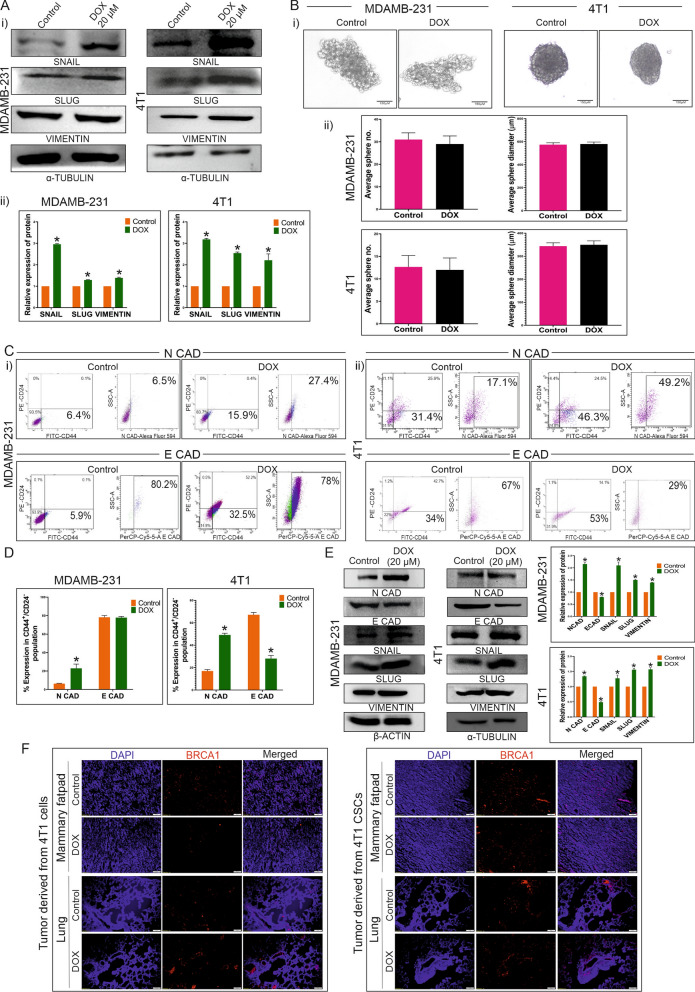
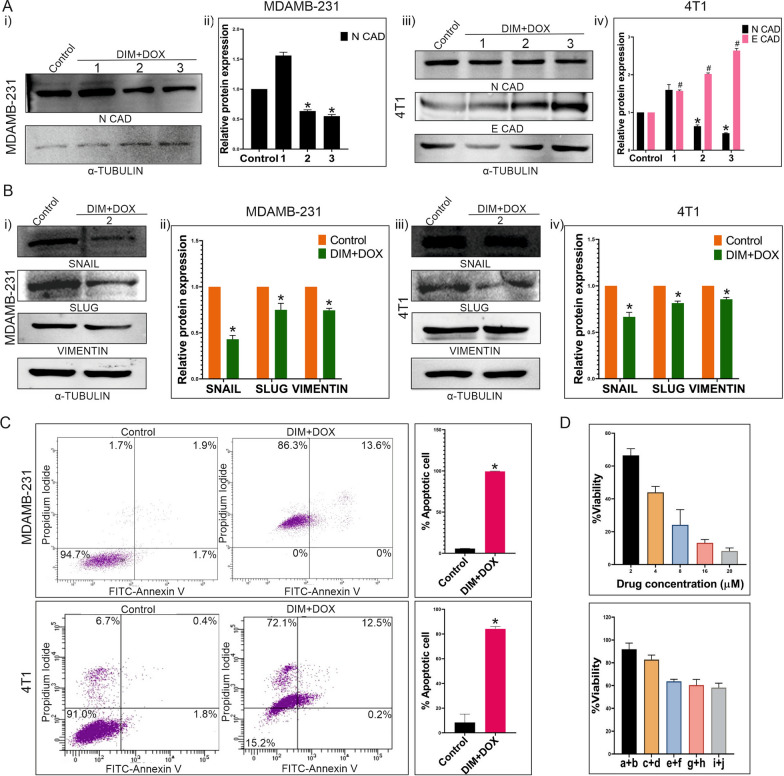
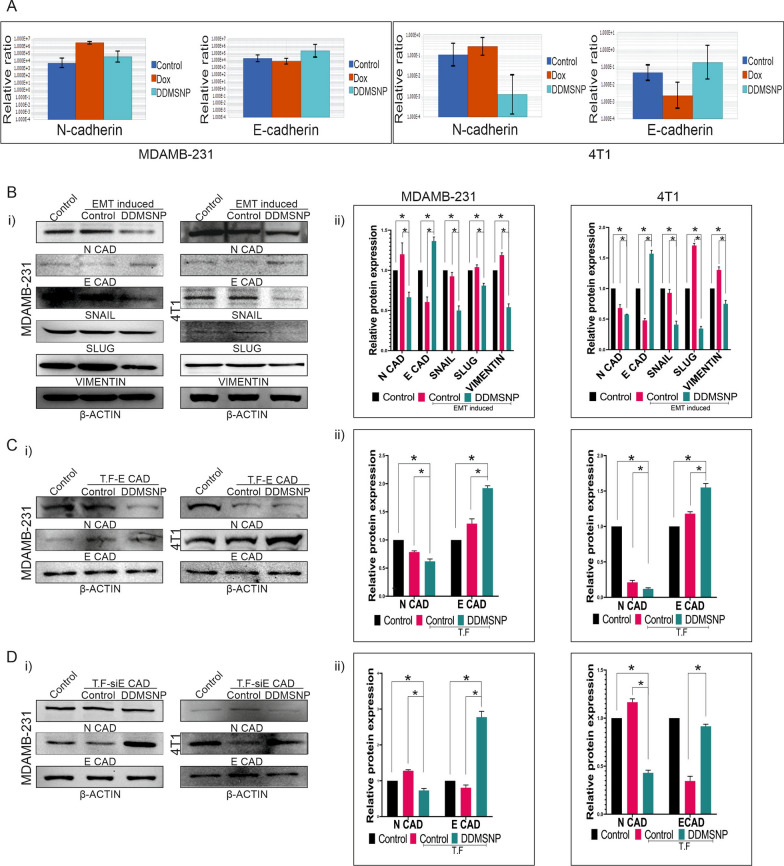
Results: DOX, according to our findings, was able to induce EMT in CSCs, making the breast cancer cells more aggressive and metastatic. In CSCs produced from spheres of MDAMB-231 and 4T1, overexpression of N-cadherin, Snail, Slug, and Vimentin as well as downregulation of E-cadherin by DOX treatment not only demonstrated EMT induction but also underscored the pressing need for a novel chemotherapeutic combination to counteract this detrimental effect of DOX. To reach this goal, DIM was combined with DOX and delivered to the CSCs concomitantly by loading them in mesoporous silica nanoparticles encapsulated in exosomes (e-DDMSNP). These exosomes improved the specificity, stability and better homing ability of DIM and DOX in the in vitro and in vivo CSC niche. Furthermore, after treating the CSC-enriched TNBC cell population with e-DDMSNP, a notable decrease in DOX mediated EMT induction was observed.

Conclusion: Our research seeks to propose a new notion for treating TNBC by introducing this unique exosomal nano-preparation against CSC induced EMT.

Keywords: 3,3′-diindolylmethane; Cancer stem cell; Doxorubicin; EMT; Exosome; TNBC.


Conflict of interest statement

The authors declare that they have no known competing financial interests or personal relationships that could have appeared to influence the work reported in this paper.

Figures

Fig. 1
Fig. 1
Synthesis and characterization of MSNP and DDMSNP. A Modified Stӧber synthesis protocol for the preparation of MSNP and DDMSNP. B SEM image shows spherical conformations and ~ 100 nm size of synthesized MSNPs. C TEM image represents the morphological analysis of the empty MSNP as well as the loading of DIM and DOX within the MSNP. D DLS analysis shows an average size of DDMSNP to be 80–150 nm. E FTIR analysis shows comparative spectra of DIM, DOX, MSNP, NDIM, NDOX and DDMSNP to confirm successful encapsulation of DIM and DOX in the nanoparticles. F Drug release study of DDMSNP shows a prolonged release of DIM and DOX from the nanoparticle at physiological pH 7.4
Fig. 2
Fig. 2
Effect of DOX on TNBC cells and CSCs derived from MDAMB-231 and 4T1 cell lines. A Overexpression of Snail, Slug and Vimentin by DOX treatment. (i) Figure shows expression of Snail, Slug and Vimentin in control and 20 µM DOX treated groups of MDAMB-231 and 4T1 cells by western blot analysis. (ii) Graphical illustration denotes mean ± SD, n = 3. * indicates P ≤ 0.0002. B (i) Figure represents the sizes of CESs derived from MDAMB-231 and 4T1 cell line after DOX treatment compared to the control. (ii) Graphical representation of diameter and number of CESs of control and DOX treated groups shows no significant differences. C (i, ii) FACS analysis evaluates the expressions of N-cadherin and E-cadherin in CD44 + /CD24-/low CSC population in both cell line derived spheres of both control and 4 h DOX treated groups. D Bar diagram represents significant difference between N-cadherin expression of control and DOX treated groups, * indicates (P < 0.0001) and nonsignificant difference between E-cadherin expression of the same groups in MDAMB-231 derived CESs (left panel). The right panel denotes significant differences between N-cadherin and E-cadherin expressions of 4T1 derived CESs, * indicates (P < 0.0001). E Western blot data represents expressions of N-cadherin, E-cadherin, Snail, Slug and Vimentin in DOX treated CESs derived from MDAMB-231 and 4T1 cells. Graphical representation shows the significant differences between the expressions of these proteins in control and DOX treated groups, * indicates (P < 0.01). F Immunofluorescence study assesses BRCA1 (red) expression in mammary fatpad and metastatic lung in DOX treated and untreated groups of 4T1 cells-derived tumor-bearing BALB/c mice (n = 6 in each group) (left panel) and 4T1 CSCs- derived tumor-bearing BALB/c mice (n = 6 in each group) (right panel)
Fig. 3
Fig. 3
Synergistic effect of DIM and DOX. A Bioavailability radar model, B boiled-egg model and C SwissADME properties of native DIM and DOX is depicted in the figure. CompuSyn analysis of DIM and DOX represents. D Dose effect plot of DIM, DOX and D + D (DIM + DOX), E plots with CI values of < 1 indicating synergism between D + D (DIM + DOX), F isobologram representing effective doses required for inhibition at 50% (Fa 0.5), 75% (Fa 0.75) and 90% (Fa 0.9) for each individual drug. Synergism is demonstrated by the dose pair plotted as a point (symbol) below their respective Fa isobole or line. G DRI of the drug combination of DIM and DOX is presented and DRI value > 1 indicates favourable drug combination. H All data are the representation of three independent experimental repeats. Fa, fraction affected; CI, combination index; DRI, dose reduction index. I MTT data demonstrates individual and the combinatorial effects of DIM and DOX in both the MDAMB-231 and 4T1 cell lines after 24 h of treatment. In this figure, a + b = DIM 10 µM + DOX 4 µM, c + d = DIM 20 µM + DOX 8 µM, e + f = DIM 30 µM + DOX 12 µM, g + h = DIM 40 µM + DOX 16 µM and i + j = DIM 50 µM + DOX 20 µM
Fig. 4
Fig. 4
Effect of DIM and DOX combination on EMT induction or apoptosis of TNBC. A (i) Expression of N-cadherin upon combinatorial treatment compared with the control. Here, “1” = DIM 10 µM + DOX 4 µM, “2” = DIM 21 µM + DOX 8 µM and “3” = DIM 30 µM + DOX 12 µM. (ii) Graphical representation shows significant change of N-cadherin expression in DIM and DOX treated MDAMB-231 cells compared to the control, * denotes P < 0.05. (iii) Immunoblotting shows the expressions of N-cadherin and E-cadherin. α-Tubulin is considered as the loading control. (iv) Bar graphs depict significant differences of N-cadherin and E-cadherin expressions between control and other groups in 4T1 cells (P < 0.001). Here, “1” = DIM 10 µM + DOX 4 µM, “2” = DIM 17 µM + DOX 7 µM and “3” = DIM 30 µM + DOX 12 µM. B (i, iii) Blots shown are the representative of expression of Snail, Slug and Vimentin in DOX treated MDAMB-231 and 4T1 cells compared to the control. α-Tubulin is used as a loading control. (ii, iv) Graphical representation illustrates significant changes in the expressions of Snail, Slug and Vimentin compared to the control (P < 0.002). C FACS analysis evaluates apoptotic cell population after 48 h of treatment with DIM and DOX in combination to MDAMB-231 and 4T1 cells. Left most panel shows control plot of untreated cells. This experiment is represented graphically in the rightmost panel (P < 0.0001). D Figure depicts the percentage of viable cells after 24 h of treatment with DOX or DIM and DOX in combination to MCF 10A cells. Here, a + b = DIM 30 µM + DOX 4 µM, c + d = DIM 40 µM + DOX 8 µM, e + f = DIM 50 µM + DOX 12 µM, g + h = DIM 60 µM + DOX 16 µM and i + j = DIM 70 µM + DOX 20 µM
Fig. 5
Fig. 5
Effect of DDMSNP on TNBC cells and CSCs involved in EMT. A Bar diagram represents MTT data showing the percentages of viable cells after 24 h of DDMSNP treatment encapsulating a + b = DIM 0.13 µM + DOX 0.05 µM, c + d = DIM 0.25 µM + DOX 0.1 µM, e + f = DIM 0.5 µM + DOX 0.2 µM, g + h = DIM 1 µM + DOX 0.4 µM, i + j = DIM 2 µM + DOX 0.8 µM and k + l = DIM 4 µM + DOX 1.6 µM. B (i) Immunoblotting analysis of DDMSNP (DIM 0.77 µM + DOX 0.31 µM) treated MDAMB-231 and DDMSNP (DIM 0.57 µM + DOX 0.23 µM) treated 4T1 cells shows expression of the proteins involved in EMT. (ii) Graphical representation shows significant changes in the expressions of N-cadherin, Snail, Slug and Vimentin (P < 0.05) in MDAMB-231 and E-cadherin along with the same proteins (P < 0.05) in 4T1 upon DDMSNP treatment. C (i, ii) Figures compare the number and diameter of CESs treated with DDMSNP to the control group (P < 0.01). D FACS analysis for the expressions of N-cadherin and E-cadherin in CD44 + /CD24-/low CSC population in DDMSNP treated group compared to the control in CSCs derived from MDAMB-231 and 4T1 derived CESs. E Graphical illustration denotes change in expression of EMT markers in CSCs derived from MDAMB-231 and 4T1 derived CESs. Figure shows no significant change of the markers in MDAMB-231 CSCs and significant change in 4T1 CSCs (P < 0.0001). F Western blot (left panel) and bar diagram (right panel) analysis represents the comparison between expressions of N-cadherin, E-cadherin, Snail, Slug and Vimentin in DDMSNP treated and untreated groups of CSCs from MDAMB-231 (P < 0.01) and 4T1 (P < 0.001) derived CESs. G Identification of BRCA1 (red) expression in mammary fatpad and in the metastatic lung of BALB/c mice injected with both 4T1 cells and CSCs by immunofluorescence study
Fig. 6
Fig. 6
Regulation of in vitro alteration of EMT markers by DDMSNP. A Total RNA extracted from DOX and DDMSNP treated and untreated MDAMB-231 and 4T1 derived CSCs are analyzed by qRT-PCR for N-cadherin and E-cadherin. B (i) Western blot data depicts the differences between the expressions of N-cadherin, E-cadherin, Snail, Slug and Vimentin in presence of DDMSNP compared to the untreated EMT induced or uninduced CSCs. β-actin is used as a loading control. (ii) The bar diagrams show relative protein expressions. * denotes P < 0.05. C (i) Western blot data from CSCs of MDAMB-231 (left panel) and 4T1 (right panel) transfected with E-cadherin expressing vectors shows differential expressions of N-cadherin and E-cadherin in non-transfected control, transfected control and DDMSNP treated transfected CSCs. (ii) Densitometric comparison for N-cadherin and E-cadherin expression among non-transfected control, transfected control and DDMSNP treated transfected CSCs is depicted by bar graphs. * denotes P < 0.05. D (i) The expressions of N-cadherin and E-cadherin in non-transfected control CSCs, transfected control CSCs and DDMSNP treated siE Cadherin (siE CAD) transfected CSCs are represented in Western blot data. (ii) Bar graphs show the densitometric comparison of N- and E-cadherin expression in non-transfected control, siE CAD transfected control, and siE CAD transfected CSCs treated with DDMSNP. * denotes P < 0.05
Fig. 7
Fig. 7
Anti-metastatic effect of e-DDMSNP on TNBC-CSCs derived tumors. A (i) Encapsulation of DDMSNP within exosomes, (ii) The morphology of an empty exosome and DDMSNP loaded exosomes captured by TEM. B Images from confocal microscopy represents the uptake of e-DDMSNP in cells (upper left panel) and sphere (lower left panel). Z-stacking analysis shows internalization of e-DDMSNP in cells (upper right panel) and in the sphere (lower right panel). C Schematic representation of experimental design to study the efficacy of DOX and e-DDMSNP in 4T1 CSC derived tumor-bearing mice. D Figure represents growth inhibition of tumors derived from 4T1 CSCs in BALB/c mice after DOX and e-DDMSNP treatment. E Figure shows decreased size of tumors in treated groups compared to untreated group. F Graph represents body weight changes during treatment. Data are expressed as the mean ± SD (n = 6). G Bar diagram represents tumor volume and tumor weight of control mice and mice receiving either DOX or e-DDMSNP (n = 6, mean ± SD), * denotes P < 0.0001. H Mass spectrometric analysis shows internalization of e-DDMSNP in tumors. Highest intensity peak in graphical representation denotes molecular mass of native DIM and native DOX. Graph shows same peak with highest intensity defining exact molecular mass of DIM and DOX in tissue extracts of e-DDMSNP treated tumors. I Fluorescence and bright field imaging represents tumor tissues of control, DOX and e-DDMSNP treated groups. J Fluorescence imaging of lung of treated and untreated groups indicates lung metastasis. K Effect of DOX and e-DDMSNP treatment on survivability of RFP expressing 4T1 CSCs derived solid tumor-bearing mice. Data are analyzed using Kaplan–Meier method. L Images denote H&E staining (× 20 ×  magnification) of tumors and lungs of treated and untreated groups. M Immunofluorescence assay represents the expressions of N-cadherin (red) and E-cadherin (green) in untreated control and DOX or e-DDMSNP treated 4T1 CSC derived solid tumors

References

    1. Yin L, Duan J-J, Bian X-W, Yu S. Triple-negative breast cancer molecular subtyping and treatment progress. Breast Cancer Res. 2020;22:61. doi: 10.1186/s13058-020-01296-5. - DOI - PMC - PubMed
    1. Pantel K, Brakenhoff RH. Dissecting the metastatic cascade. Nat Rev Cancer. 2004;4:448–456. doi: 10.1038/nrc1370. - DOI - PubMed
    1. Wang Y, Zhou BP. Epithelial-mesenchymal transition—a hallmark of breast cancer metastasis. Cancer Hallm. 2013;1:38–49. doi: 10.1166/ch.2013.1004. - DOI - PMC - PubMed
    1. Ayob AZ, Ramasamy TS. Cancer stem cells as key drivers of tumour progression. J Biomed Sci. 2018;25:20. doi: 10.1186/s12929-018-0426-4. - DOI - PMC - PubMed
    1. Kuşoğlu A, Biray AÇ. Cancer stem cells: a brief review of the current status. Gene. 2019;681:80–85. doi: 10.1016/j.gene.2018.09.052. - DOI - PubMed