. 2024 May 25;15(1):4455.
doi: 10.1038/s41467-024-48734-y.

Lipidome atlas of the adult human brain

Affiliations

Lipidome atlas of the adult human brain

Maria Osetrova et al. Nat Commun. .

Abstract

Lipids are the most abundant but poorly explored components of the human brain. Here, we present a lipidome map of the human brain comprising 75 regions, including 52 neocortical ones. The lipidome composition varies greatly among the brain regions, affecting 93% of the 419 analyzed lipids. These differences reflect the brain's structural characteristics, such as myelin content (345 lipids) and cell type composition (353 lipids), but also functional traits: functional connectivity (76 lipids) and information processing hierarchy (60 lipids). Combining lipid composition and mRNA expression data further enhances functional connectivity association. Biochemically, lipids linked with structural and functional brain features display distinct lipid class distribution, unsaturation extent, and prevalence of omega-3 and omega-6 fatty acid residues. We verified our conclusions by parallel analysis of three adult macaque brains, targeted analysis of 216 lipids, mass spectrometry imaging, and lipidome assessment of sorted murine neurons.


Conflict of interest statement

The authors declare no competing interests.

Figures
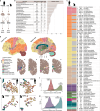
Fig. 1
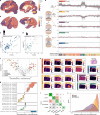
Fig. 1. Lipidome analysis of human and rhesus macaque brain regions.
a Experimental scheme displaying numbers of subjects and lipids analyzed by mass spectrometry-based techniques (HRMS and MRM). b Numbers of lipids detected in the human brain by HRMS and MRM in lipid classes defined as corresponding LIPID MAPS subclasses. c, d List of assessed brain regions (c) and their anatomical localization in the human brain (d). Brain images were adapted from ref. . e Visualization of the total lipidome variation in the human and macaque brains using t-SNE based on HRMS and MRM measurements. Each circle represents a brain region, colors according to (d). f, g Correlation of lipid intensity profiles across brain regions between HRMS and MRM (f) and between humans (n = 4 individuals) and macaques (n = 3 animals) (g). Random pairs distributions represent the correlation between lipid intensity profiles of two datasets with permuted region labels. Source data are provided as a Source Data file.
Fig. 2
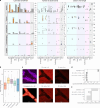
Fig. 2. Normalized abundance profiles of lipids sorted by class and unsaturation across brain regions.
a Heatmaps illustrating the relative abundance of each lipid class in every brain region. The normalized abundance refers to the average signal intensity of each lipid class in a given brain region normalized to its global average intensity, calculated across all 75 regions, and then averaged across individuals (n = 4 individuals). Each row represents a lipid class, each column corresponds to a brain region. The color bars underneath the plots here and in panel b indicate the anatomical assignment of brain regions as shown in Fig. 1d. Lipid classes are grouped based on their geometry, which is illustrated in an insert on the right side of the figure. The gray bars on the right side represent the number of detected lipids in each lipid class (Supplementary Data 2). The brain regions on the right side are colored according to the relative abundance levels of cholesterol. Brain images were adapted from ref. . b Heatmaps representing the normalized abundance levels of lipids containing a defined total number of double bonds in their fatty acid residues (rows) across brain regions (columns), averaged across individuals (n = 4 individuals). The gray bars on the right side represent the number of detected lipids in each fatty acid unsaturation group (Supplementary Data 2). The brain regions on the right side are colored according to the relative abundance levels of lipids with a total of six double bonds in their fatty acid residues. Brain images were adapted from ref. . Source data are provided as a Source Data file.
Fig. 3
Fig. 3. Lipidome patterns within the human brain.
a, b Schematic representation of the human (a) and macaque (b) brains colored according to the relative myelin content determined using sMRI T1w/T2w image data. Brain images were adapted from. c, d Correlation between lipidome variation based on PC1 of HRMS measurements and myelin content derived from sMRI image data in human (n = 210 individuals) (c) and macaque (n = 19 animals) (d) brains. e Schematic drawing of the lipid profile classification protocol and visualization of the resulting average category profiles (red line) and profiles of individual lipids within the category (gray lines). For each category plot: the y-axis shows normalized lipid intensity and the x-axis corresponds to 75 brain regions arranged according to hierarchical clustering outcome (see Fig. 2a). f Volcano plot showing significant lipid intensity differences between human white and gray matter calculated using public data (n = 5 individuals) and colored according to lipid category classification from this study. P-values were calculated using two-sided t test, BH-corrected. g, h Visualization of spatial intensity distributions of 19 lipids detected by HRMS using MALDI imaging of human prefrontal cortical sections (n = 4 individuals) (h) and their intensities’ ratio between white and gray matter areas of the sections (g). Here and in Figs. 4b, d, 5d, h, 6c, j, box plots represent the median, 25th and 75th percentiles; the whiskers extend to the largest and smallest value no further than 1.5 interquartile range. MALDI image panel headings indicate category placement of the lipids determined by HRMS data analysis. i Correspondence percentage of the lipid placement into the five categories between human (n = 4 individuals) and macaque (n = 3 animals) HRMS data. Green color indicates a perfect match, red—a mismatch, and gray—a non-contradictory alternative assignment. Color intensity reflects the number of overlapping lipids. j Distributions of the correlation coefficients for lipid intensity profile comparisons between humans (n = 4 individuals) and macaques (n = 3 animals) for the three main lipid categories. Source data are provided as a Source Data file.
Fig. 4
Fig. 4. Characterization of lipids within five brain-profile categories.
a Distribution of detected lipid compounds among lipid classes within each category (left panel, total number of lipids within each category, from the top: 274, 71, 46, 20, 8) in humans (n = 4 individuals). Сolored bars indicate significantly enriched classes (two-sided hypergeometric test, BH-corrected, ***p < 0.001; **p < 0.01; *p < 0.05;.p < 0.1). Hatched bars mark lipid classes previously assigned to brain white matter. Distribution of total double bond count (central panel) and carbon chain lengths (right panel) of fatty acid residues within each lipid class in each category. Circles represent lipid compounds. Lipid compounds are represented by circles, with circle colors indicating higher (orange) or lower (blue) number of double bonds or fatty acid residues of particular length in a given class compared to the other clusters (p < 0.05 for number of double bonds and p < 0.1 for carbon chain length). Background color represents geometry groups as indicated in Fig. 2a. b Distribution of predicted membrane fluidity effects in humans (n = 4 individuals) for each lipid in a category (two-sided Mann–Whitney U test, BH-corrected, ***p < 0.001). c, d Visualization of the spatial intensity distributions of five lipid head group ions using SIMS imaging of human cerebellar sections (n = 3 individuals) (c) and their intensities’ ratio between white and gray matter areas of the sections (d). e Difference in prevalence of lipids in myelin+ and myelin clusters shown as a proportion difference calculated for lipid class sets containing the same head group, as measured by ToF-SIMS in HRMS data (two-sided hypergeometric test, BH-corrected, **p < 0.01). Source data are provided as a Source Data file.
Fig. 5
Fig. 5. Associations between lipid profiles and particular cell types.
a Correlation of 35 brain region mRNA expression profiles of marker genes used in cell type deconvolution analysis in humans (n = 4 individuals here and in be). b Clustering of 419 HRMS lipids based on their intensity profiles across brain regions using tSNE colored by category (left) and assigned cell type (right). c Proportion of lipids assigned to cell types within each category and their relative enrichment (one-sided hypergeometric test, BH-corrected, ***p < 0.0001; **p < 0.001; *p < 0.05). d Distributions of correlation coefficients for human-mouse (n = 4 humans and n = 3 mice) comparisons based on lipid intensity profiles matched and mismatched between the species. e Lipid class association with main brain cell types. Two lipid classes (PE and HexCer) show significant and specific associations. P-values were calculated using one-sided hypergeometric test, BH-corrected. f Comparison of the relative lipid species proportion of PE and HexCer among four cell types in the human brain (n = 4 individuals) and relative intensities of these two lipid classes in the corresponding cell type lines in the mouse brain (n = 3 animals). Error bars represent the standard deviation. g Scheme of mouse cell sorting experiment. h The intensity ratio between lipids associated with neuronal and non-neuronal cell types in our data in the lipidomes of sorted pyramidal neurons and the rest of sorted cells (n = 2 animals). P-value was calculated using one-sided Wilcoxon test. Source data are provided as a Source Data file.
Fig. 6
Fig. 6. Association between brain lipidome and the functional architecture.
a Location of 56 brain regions assigned and colored according to their processing hierarchy (HR) within the brain. Brain images were adapted from ref. . b Relationship between PC2 of the total variation of 419 HRMS lipids and HR in the human brain (n = 4 individuals here and in ck). Circles represent brain regions. Circle marks the piriform cortex. c Significance of the relationship between lipid intensity and HR levels shown as correlation test p-value distribution based on all lipids within a category: negative correlations—left, positive—right. Asterisks indicate the significance of the difference among categories (one-sided Mann–Whitney U test, **p < 0.01; *p < 0.05). dg Volcano (top) and distribution (bottom) plots showing properties of lipids significantly correlated with HR: lipid class allocation (d), fatty acid residue unsaturation (e), omega-3/omega-6 prevalence based on docosahexaenoic (DHA) or adrenic (AdA) acid occurrence (f), and cell type assignment (g). P-values were calculated via slope for a linear model, BH-corrected. h Location of 59 brain regions assigned and colored according to the inverted first principal component (–PC1) of their functional connectivity within the brain. Brain images were adapted from ref. . i Relationship between PC2 of the total variation of 419 HRMS lipids and –PC1 of FC. Circles represent brain regions. j Distributions of correlation coefficients between lipid intensity and FC in each lipid category. Asterisks indicate the significance of the difference among categories (one-sided Mann–Whitney U test, **p < 0.01; *p < 0.05). k Significantly higher correlation with FC for individual lipid classes (one-sided Mann–Whitney U test). Source data are provided as a Source Data file.
Fig. 7
Fig. 7. Summary of lipid properties in the five profile-defined categories.
Columns, from left to right, show the following information: (1) The number and percentage of all detected lipids occupied by the category. (2) Significantly enriched lipid classes. (3) Bar plots depicting the distribution of the total number of double bonds within lipid fatty acid residues, color-coded based on their number (light gray—one, gray—two, deep gray—three). (4) Density plots showing the total lipid fatty acid chain length distribution, combining information for lipids with different numbers of fatty acid residues (left peak—one, middle peak—two, right peak—three). The counts for each group were normalized to maintain the relative heights of the peaks. (5) Numbers of lipids associated with the main brain cell types within each category. Lipid-cell type assignments were based on a Pearson correlation threshold of 0.5 between lipid intensity and mRNA expression profiles of cell-type marker genes across 35 brain regions. If correlations did not meet this threshold, the lipid was not assigned to a particular cell type (cell type = “none” including also ubiquitous lipids). (6) Conservation of lipid profiles between human (n = 4 individuals) and macaque (n = 3 animals) brains as the percentage of human lipids falling into the same category in macaques. (7) Correlation of lipid profiles with brain information processing hierarchy, with a darker shade of gray indicating lipids with correlation p < 0.05. (8) The strength and significance of the correlation between the lipid intensity matrices and the functional connectivity matrix. Asterisks, when present, indicate the enrichment of a specific lipid group within a given lipid category (hypergeometric test, BH-corrected, *p < 0.001; **p < 0.01; *p < 0.05). Source data are provided as a Source Data file.

References

    1. Khrameeva E, et al. Single-cell-resolution transcriptome map of human, chimpanzee, bonobo, and macaque brains. Genome Res. 2020;30:776–789. doi: 10.1101/gr.256958.119. - DOI - PMC - PubMed
    1. Lake BB, et al. Neuronal subtypes and diversity revealed by single-nucleus RNA sequencing of the human brain. Science. 2016;352:1586–1590. doi: 10.1126/science.aaf1204. - DOI - PMC - PubMed
    1. Hawrylycz MJ, et al. An anatomically comprehensive atlas of the adult human brain transcriptome. Nature. 2012;489:391–399. doi: 10.1038/nature11405. - DOI - PMC - PubMed
    1. Hawrylycz M, et al. Canonical genetic signatures of the adult human brain. Nat. Neurosci. 2015;18:1832–1844. doi: 10.1038/nn.4171. - DOI - PMC - PubMed
    1. Tran MN, et al. Single-nucleus transcriptome analysis reveals cell-type-specific molecular signatures across reward circuitry in the human brain. Neuron. 2021;109:3088–3103.e5. doi: 10.1016/j.neuron.2021.09.001. - DOI - PMC - PubMed