

Investigating the biochemical response of proton minibeam radiation therapy by means of synchrotron-based infrared microspectroscopy
- PMID: 38796617
- PMCID: PMC11128026
- DOI: 10.1038/s41598-024-62373-9
Investigating the biochemical response of proton minibeam radiation therapy by means of synchrotron-based infrared microspectroscopy
Abstract
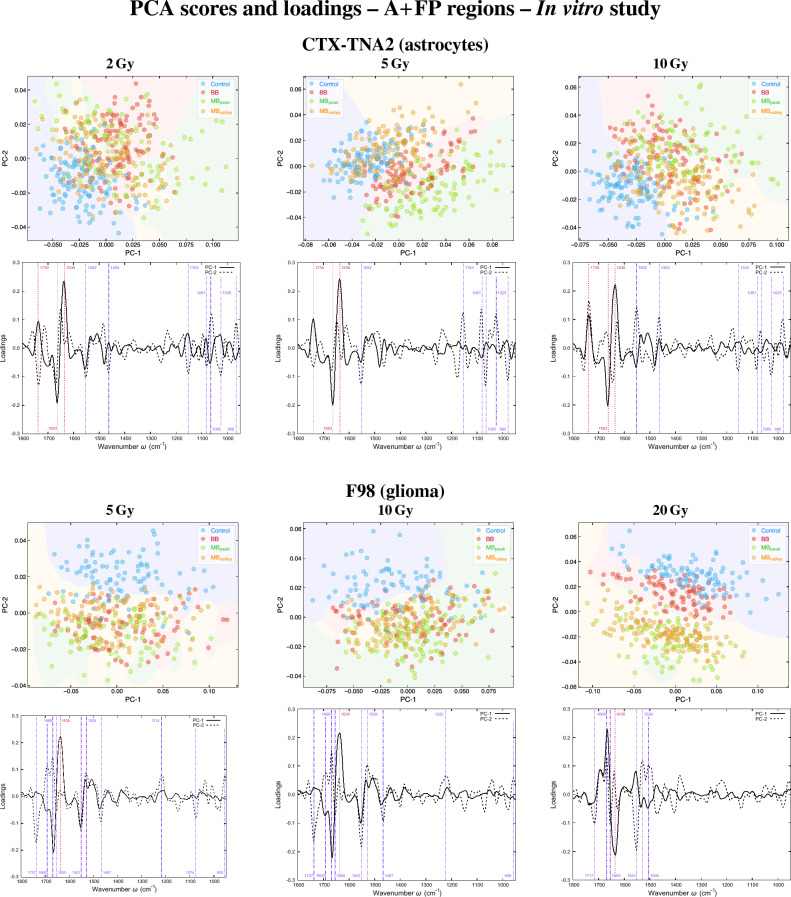
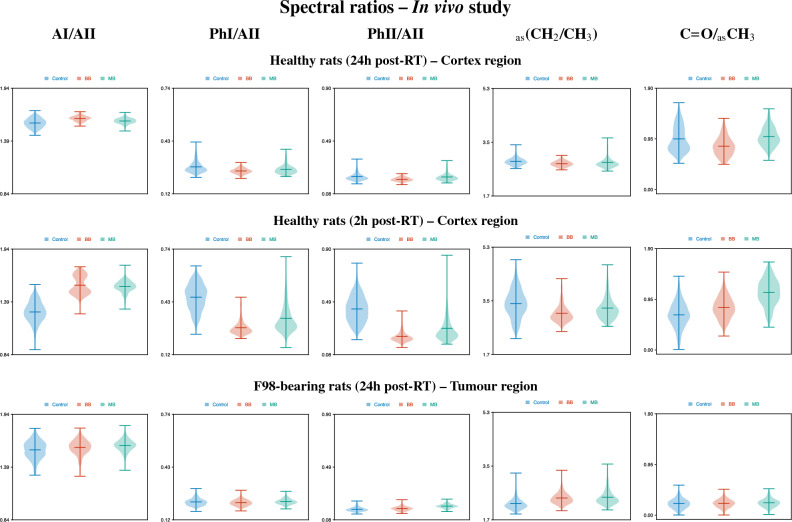
The biology underlying proton minibeam radiation therapy (pMBRT) is not fully understood. Here we aim to elucidate the biological effects of pMBRT using Fourier Transform Infrared Microspectroscopy (FTIRM). In vitro (CTX-TNA2 astrocytes and F98 glioma rat cell lines) and in vivo (healthy and F98-bearing Fischer rats) irradiations were conducted, with conventional proton radiotherapy and pMBRT. FTIRM measurements were performed at ALBA Synchrotron, and multivariate data analysis methods were employed to assess spectral differences between irradiation configurations and doses. For astrocytes, the spectral regions related to proteins and nucleic acids were highly affected by conventional irradiations and the high-dose regions of pMBRT, suggesting important modifications on these biomolecules. For glioma, pMBRT had a great effect on the nucleic acids and carbohydrates. In animals, conventional radiotherapy had a remarkable impact on the proteins and nucleic acids of healthy rats; analysis of tumour regions in glioma-bearing rats suggested major nucleic acid modifications due to pMBRT.
© 2024. The Author(s).
Conflict of interest statement
The authors declare no competing interests.
Figures


Similar articles
-
Synchrotron-based infrared microspectroscopy unveils the biomolecular response of healthy and tumour cell lines to neon minibeam radiation therapy.Analyst. 2025 Jan 13;150(2):342-352. doi: 10.1039/d4an01038h. Analyst. 2025. PMID: 39668677 Free PMC article.
-
Tumor Control in RG2 Glioma-Bearing Rats: A Comparison Between Proton Minibeam Therapy and Standard Proton Therapy.Int J Radiat Oncol Biol Phys. 2019 Jun 1;104(2):266-271. doi: 10.1016/j.ijrobp.2019.01.080. Epub 2019 Jan 29. Int J Radiat Oncol Biol Phys. 2019. PMID: 30703513
-
Spatially Modulated Proton Minibeams Results in the Same Increase of Lifespan as a Uniform Target Dose Coverage in F98-Glioma-Bearing Rats.Radiat Res. 2020 Dec 1;194(6):715-723. doi: 10.1667/RADE-19-00013.1. Radiat Res. 2020. PMID: 32991712
-
Technical aspects of proton minibeam radiation therapy: Minibeam generation and delivery.Phys Med. 2022 Aug;100:64-71. doi: 10.1016/j.ejmp.2022.06.010. Epub 2022 Jun 21. Phys Med. 2022. PMID: 35750002 Review.
-
Synchrotron Infrared Microspectroscopy for Stem Cell Research.Int J Mol Sci. 2022 Aug 30;23(17):9878. doi: 10.3390/ijms23179878. Int J Mol Sci. 2022. PMID: 36077277 Free PMC article. Review.
Cited by
-
Mini-GRID therapy delivers optimised spatially fractionated radiation therapy using a flattening free filter accelerator.Commun Med (Lond). 2025 Apr 5;5(1):101. doi: 10.1038/s43856-025-00809-7. Commun Med (Lond). 2025. PMID: 40188304 Free PMC article.
-
Synchrotron-based infrared microspectroscopy unveils the biomolecular response of healthy and tumour cell lines to neon minibeam radiation therapy.Analyst. 2025 Jan 13;150(2):342-352. doi: 10.1039/d4an01038h. Analyst. 2025. PMID: 39668677 Free PMC article.
References
-
- Zhang H, Mayr NA, editors. Spatially Fractionated, Microbeam and FLASH Radiation Therapy. IOP Publishing; 2023. pp. 2053–2563.
MeSH terms
Substances
Grants and funding
- PRE2021-097298/Ministerio de Ciencia, Innovación y Universidades
- PID2020-114079RA-I00/Ministerio de Ciencia, Innovación y Universidades
- PID2020-114079RA-I00/Ministerio de Ciencia, Innovación y Universidades
- 817908/H2020 European Research Council
- IDEAS21849MART/Fundación Científica Asociación Española Contra el Cáncer
LinkOut - more resources
Full Text Sources
Miscellaneous
